Author: Balder
Translation: Deep Tide TechFlow
Deep Tide Preview: Prices doubled in the first quarter, capacity sold out until 2027, and new contract prices grew several times. The author believes that the memory shortage related to HBM is not a cyclical tightness, but a long-term supply-demand dislocation that will not be reconciled before 2029.
A commodity no longer behaves like a commodity
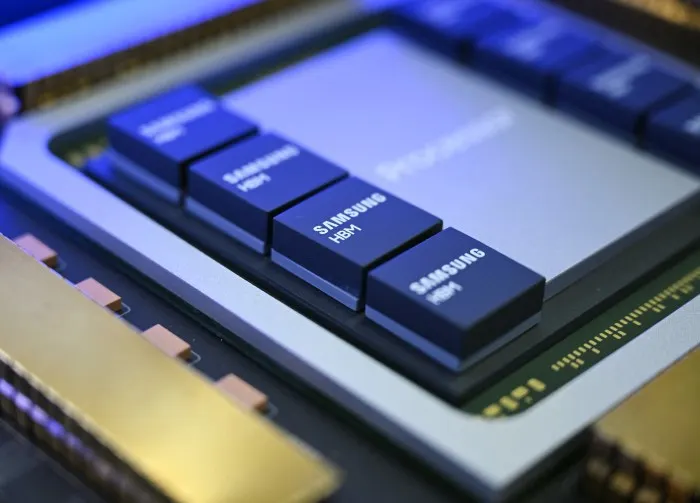
For forty years, memory has been a textbook example of a cyclical product: surging demand, factories built, prices plummeting, and repeating cycles. This rhythm has now clearly broken. In the first quarter of 2026, the boring, commoditized half of the traditional DDR5—DRAM market saw contract prices soar 90% to 95% in a single quarter, not because PC buyers were ordering frantically, but because high-bandwidth memory was eating up the wafers previously occupied by DDR5. Three HBM suppliers—SK Hynix, Samsung, and Micron—have already sold out all their capacity for 2026, with allocations for 2027 also being locked in. The head of Samsung's memory division warned in April that a "serious shortage" would last at least until 2027, with customer demand satisfaction rates hitting an all-time low; the chairman of SK Group hinted that pressure might persist until 2030.
In the second quarter of 2026, negotiations for the 2027 HBM4 supply contracts began—suppliers were seeking price increases by several times, not just a few percent.
Stop and think about what this means. Prices serve as a rationing mechanism. When a market must leverage prices to multiply in order to allocate output for the next two years, this is not "tightness." This is the formal definition of demand exceeding supply—sustained, structural, and, this article will argue, still underestimated. The following assertion is specific and falsifiable: under any reasonable arithmetic, HBM supply cannot intersect with HBM demand before 2029. Predictions will continue to be revised in one direction, as they utilize tools to linearly increase capacity, attempting to catch up with three exponential curves with two to four year delivery timelines.
Every credible forecaster now acknowledges the shortage. The argument of this article is that they still underestimate its depth and duration—because it is structural, not cyclical.
The memory wall: Two decades of divergence finally due
The root cause is older than ChatGPT. For about twenty years, peak computing throughput for processors has grown about 60,000 times—doubling approximately every eight months—while DRAM bandwidth has increased only about 100 times. Interconnect bandwidth performs even worse. Hardware designers refer to it as the memory wall: the pipelines delivering data to the computational units have fallen three orders of magnitude behind the computational units themselves.
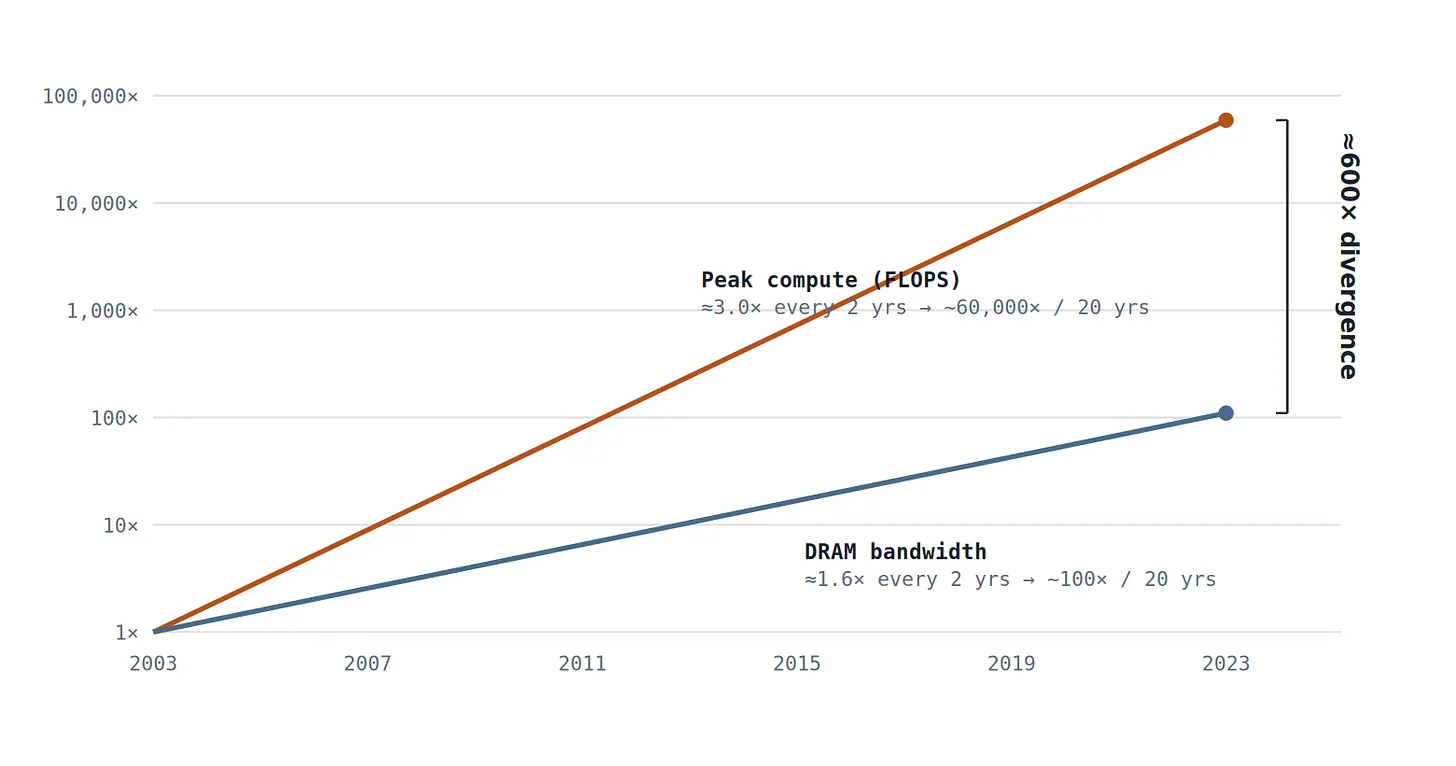
Figure 1 — The growth rate of computing throughput is roughly twice the growth rate of memory, and in the past twenty years, the gap has expanded 1001600 times. The Transformer model (attention mechanisms plus autoregressive decoding) is the largest bandwidth-consuming workload in large-scale deployments to date, sitting precisely at the bandwidth consumption limit side of this chart. (Source: Gholami et al., "AI and the Memory Wall," IEEE Micro, 2024.)
Then the industry standardized architectures least suited to this gap. Transformer inference is dominated by autoregressive decoding: to output each token, hardware must stream model weights and the entire accumulated KV cache from memory. The computation per byte movement is negligible. Kim Jung-ho, a professor at KAIST—often referred to as the father of HBM—estimates that under AI workloads, GPUs spend only 10% to 30% of their time computing; the rest of the time is spent waiting for memory. Computation is abundant. The bytes per second are the scarce resource. This means that every dollar of incremental AI capital expenditure is essentially an order for bandwidth—and today's bandwidth means HBM.
Demand: Three exponential curves, one bottleneck
HBM demand is the product of two factors—the shipment of accelerator units and the gigabytes of HBM per accelerator—both growing exponentially. Let's start with the per package content, as it is the cleanest public number:
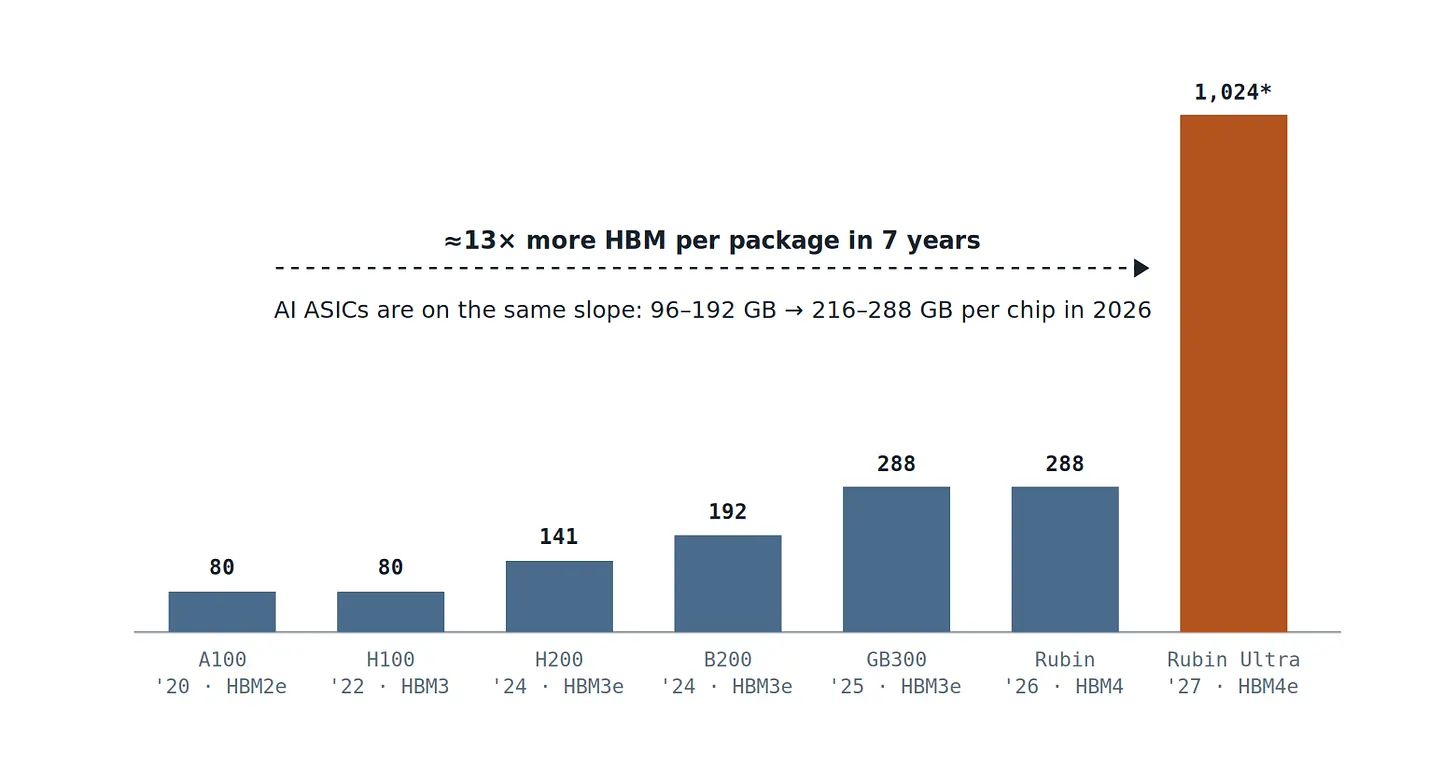
Figure 2 — HBM capacity for NVIDIA's flagship packages, forecast from 2020 to 2027. Rubin Ultra features a four-chip package with 1 TB of HBM4e memory (TrendForce's model shows each GPU chip's memory capacity is 384 GB). Regardless, the memory capacity per slot is growing at an annual rate of 45% to 55%—which is then multiplied by double-digit to high double-digit shipment growth rates, and a second demand pool (Google TPU, AWS Trainium, and other ASICs) that barely existed two years ago. (Data source: NVIDIA product roadmap disclosures; TrendForce, June 2026.)
Why is the content per slot growing so dramatically? Because three independent demand curves are all released onto the same component.
Training: Memory sets the cap, computation is just along for the ride
Training cutting-edge models is an exercise in trading memory for computation. Technologies like ZeRO-3 exist solely because summary memory of the cluster—rather than summary FLOPS—sets the maximum for the trainable model across tens of thousands of GPU-sharded parameters, gradients, and optimizer states. The largest model you can build is a function of total memory. This makes HBM capacity—rather than computation—the constraint for the cutting edge itself.
Inference: Agents turn KV cache into the main character
In the era of agents, context is the means of production. Multi-turn dialogue, tool calls, and long task regularities routinely push work context into hundreds of thousands of tokens, while the KV cache—Transformer's working memory—grows linearly with each token for every concurrent user. The math is unforgiving:
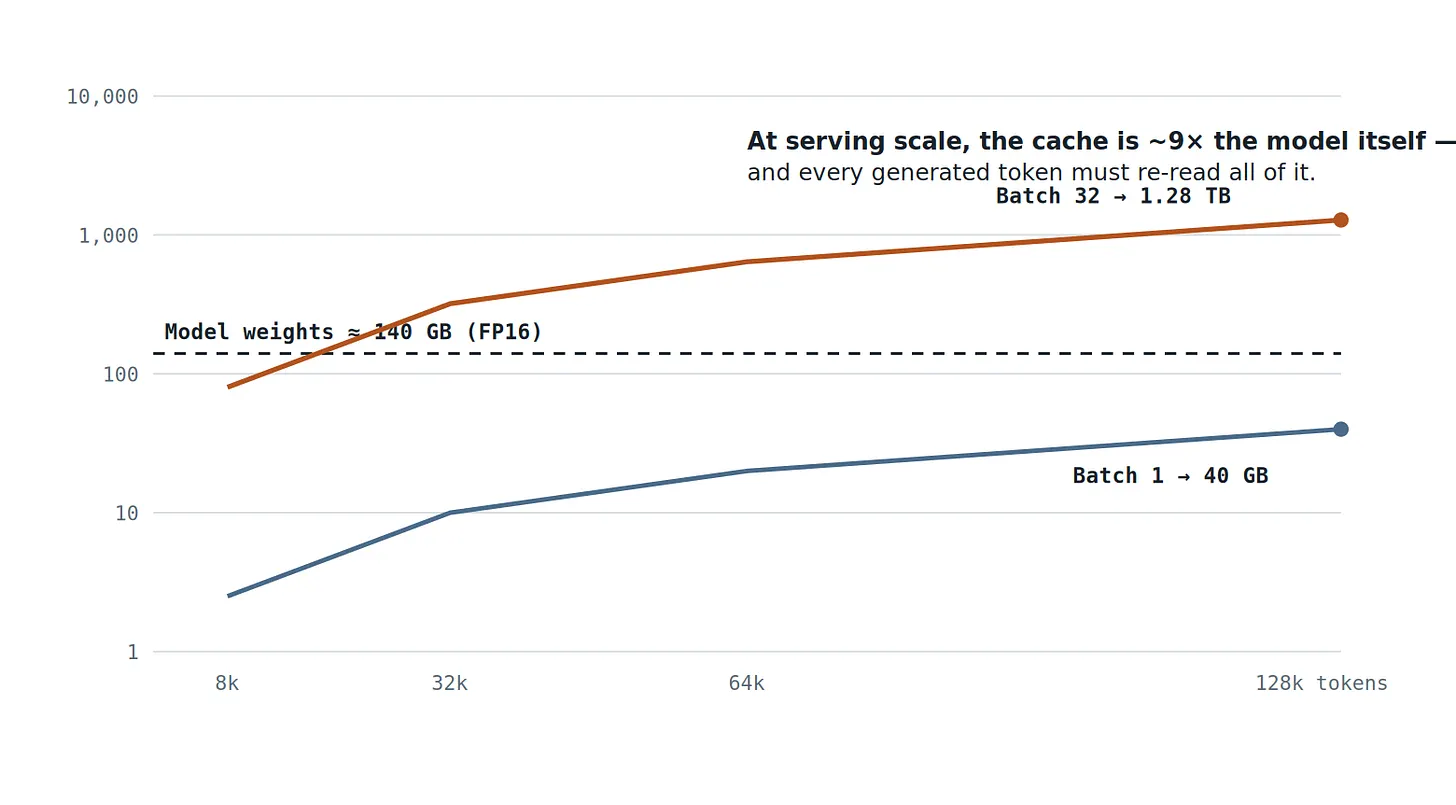
Figure 3 — The relationship between KV cache and context length for a 70B model (80 layers, 8 KV heads, head dimension 128, FP16): Each token in each sequence occupies 0.32 MB. In an actual service batch with 32 concurrent 128k token contexts, the KV cache alone occupies 1.28 TB—nine times that of model weights—and each generated token must reread the entire cache. This is why the limiting factor on how many users a GPU can service is the HBM capacity of each package, not FLOPS. (Author calculated.)
Inference: Paradigm shift happens at the worst stage
The third curve is the newest and steepest. With diminishing returns on pretraining, the frontier has shifted to compute at test time: inference models buy capability by generating tens to hundreds of times more thought chain tokens for each task. Each of these tokens is generated during the decoding phase—at this phase, the GPU is not computing but streaming weights and KV cache from memory. Pre-filling consumes FLOPS; decoding consumes bandwidth; inference shifts the entire token ensemble to decoding. The industry's path to higher intelligence routes all new demands to the most constrained single resource in data centers.
Data confirms this. Google disclosed that its product handled about 480 trillion tokens in May 2025—reaching 1.3 quadrillion monthly by October, nearly tripling in five months. Token generation is the fastest-growing industrial output on earth, and tokens are forged from memory bandwidth.
Conversion tax: Why capacity cannot simply "catch up"
The intuitive counterargument is that memory manufacturers have seen shortages before: spend enough capital expenditure, and the bits will appear. But HBM breaks this intuition in two places—wafers and calendars.
Wafers. HBM is not ordinary DRAM sold at a premium; it is manufactured in a way that uses physical waste from wafers, permissible because the bandwidth is priceless. Each chip is larger, occupying the area of thousands of silicon vias, and stacking eight to sixteen chips multiplies yield loss—one faulty chip can jeopardize the entire stack. The net result: producing one terabyte of HBM consumes wafer capacity that is roughly four times that of one terabyte of standard DRAM. TrendForce's forecasts make this tax visible:
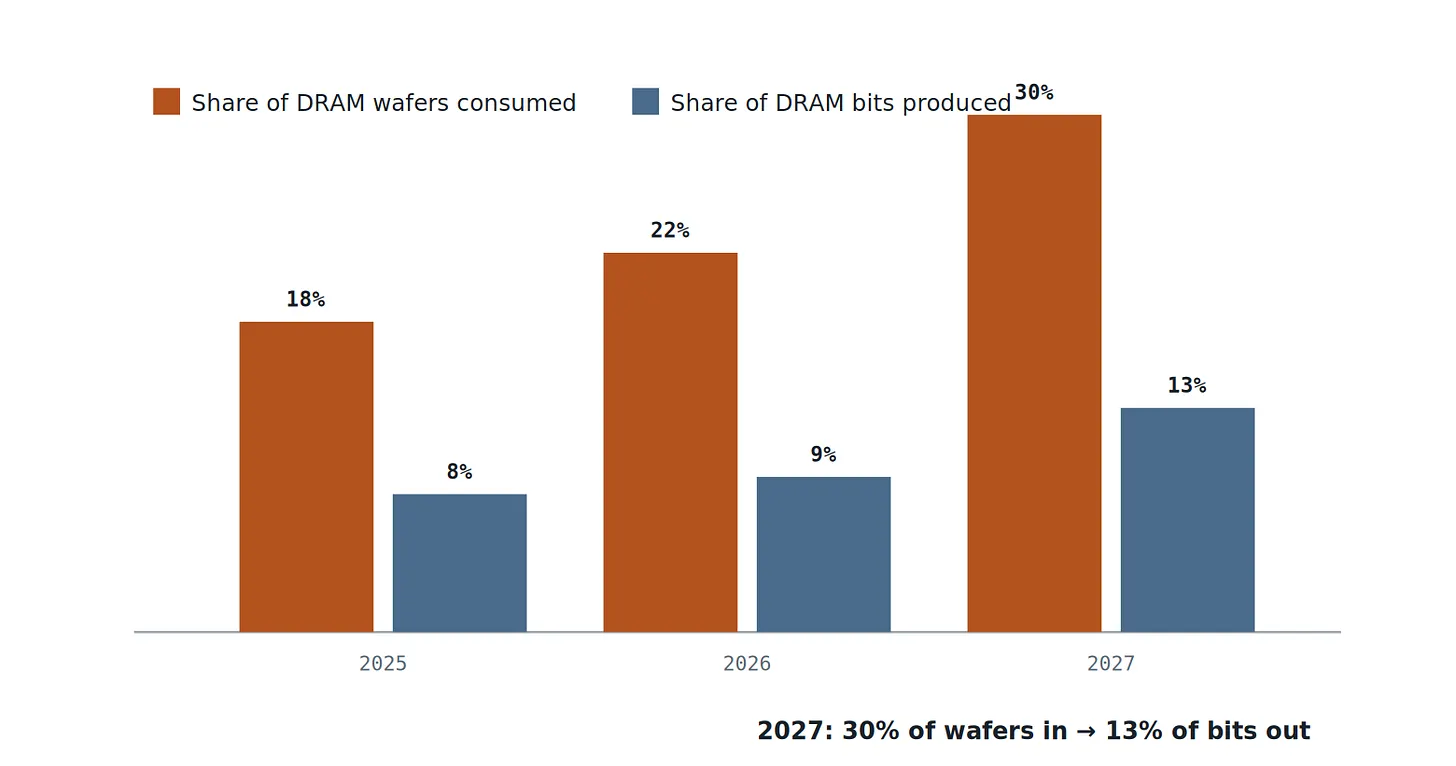
Figure 4 — The relationship between HBM's share of DRAM wafer inputs and its share of DRAM bit outputs. For every 1% increase in HBM bit share, the wafer share decreases by 2.3%. Transitioning wafer fabs to HBM will slowly increase HBM bits while rapidly decreasing traditional DRAM bits—the soaring prices of DDR5 by 90-95% is a reflection of this trend. (Source: TrendForce, June 2026.)
Calendar. If the wafer tax is a physical problem, delivery times are a logistics problem. Total bit output in the DRAM industry grows by only about 20% annually (Micron’s own guidance for 2025 and 2026) as 2026 DRAM capital expenditure—growing 14% to $61.3 billion—is directed toward node transitions, TSV equipment, hybrid bonding, and HBM conversions, rather than net new wafer starts. TrendForce is blunt: cleanroom space is the constraint, and increasing capital expenditure has a "minimal impact" on bit supply growth in 2026. Real new wafers arrive according to factory schedules, and these schedules are measured in years:
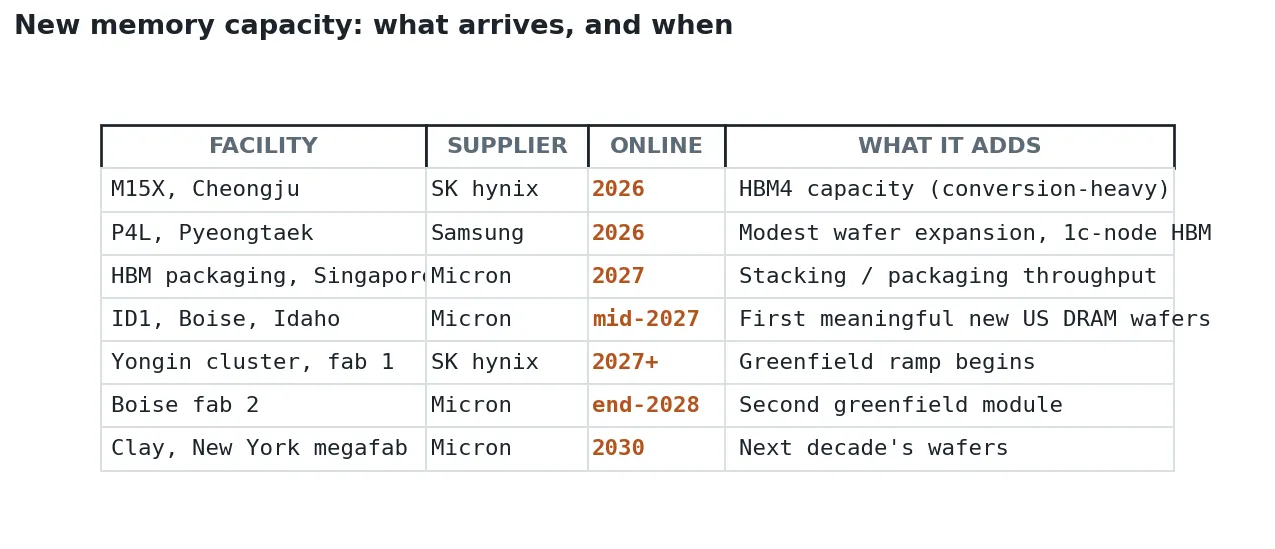
Data source: Micron's Q1 FY2026 earnings call; TrendForce; company announcements. Note that nothing in this list will make a significant impact on total bit supply before 2027, with the largest increases expected between 2028 and 2030.
So the supply side faces a closed loop: it can only forge HBM bits by burning wafers at a rate of 4:1, it cannot quickly increase wafer output, and each wafer converted will spike prices elsewhere in the DRAM ecosystem. This is not a supply curve catching up with demand. This is a supply curve being rationed in two simultaneous shortages.
Calculate the arithmetic: The deficit cannot be bridged
Putting both sides together, using the suppliers' own numbers. Supply side: TrendForce's bit share path (8%→9%→13% of DRAM bits, 2025-2027) stacked on about 20% total DRAM bit growth means HBM bit supply will grow about +35% in 2026 and about +73% in 2027—a truly heroic acceleration. Demand side: TrendForce predicts that HBM demand will grow about 70% in 2026, driven by ASIC content jumps (96-192 GB→216-288 GB per chip), then accelerated again in 2027 by the 384 GB level GPUs of the Rubin Ultra and expanding TPU deployments. Even if we take the most optimistic path for supply and hold demand at a conservative compound growth of about 70-75%:
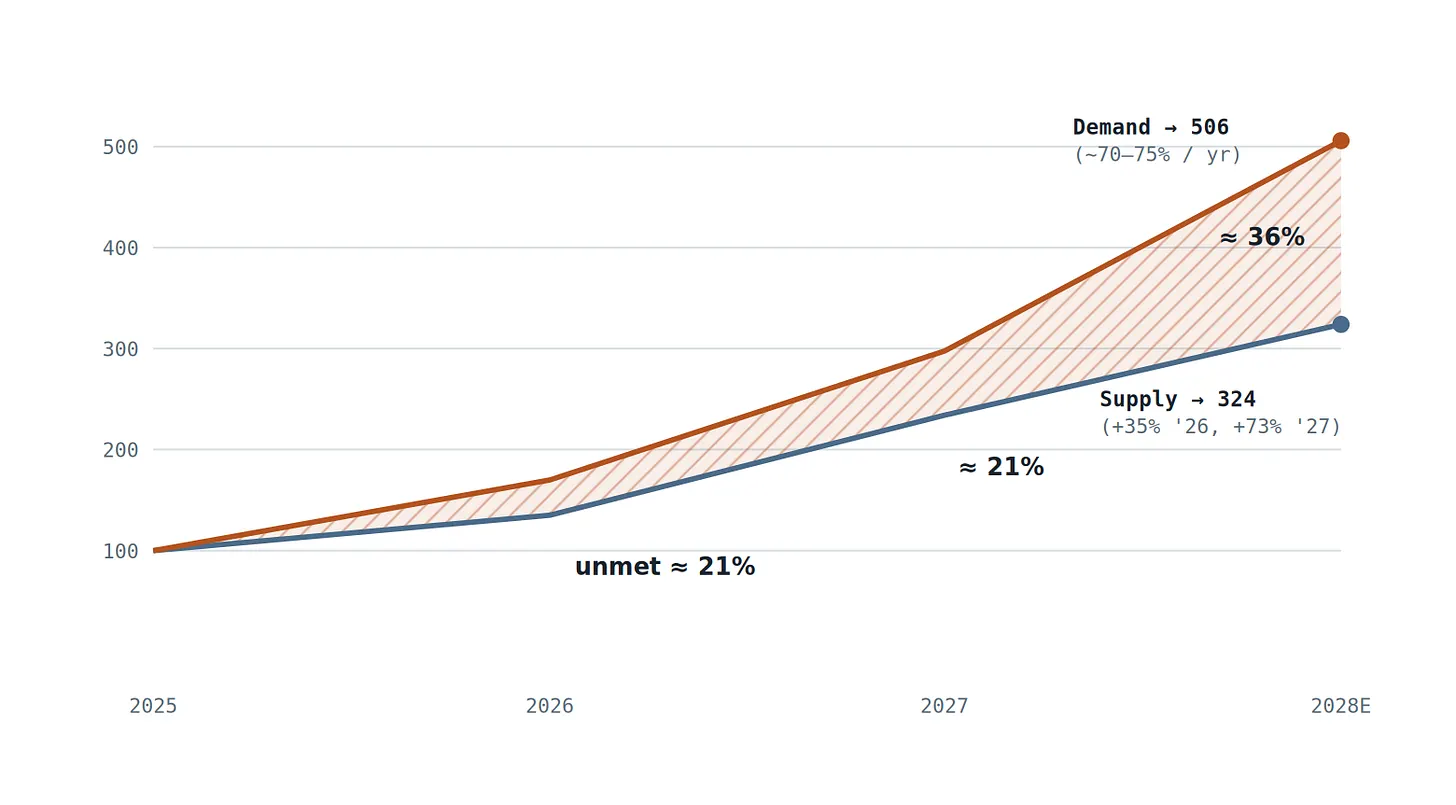
Figure 5 — Comparison of HBM bit supply to unconstrained bit demand (2025 = 100). The supply path is based on TrendForce's bit share estimates and is based on Micron’s projected annual growth rate of total DRAM bits of 20%; the demand figure is 70% (TrendForce, 2026), followed by a compound growth rate of 75%. The wedge area represents the critical point: even if the supply accelerates to a growth of 73% per year, it will never intersect with a demand curve that is based on a higher base and a faster compound growth rate—and this gap will further widen in 2028, precisely as new wafer fabs begin to come online. (Author model; assumptions explained; this gap will persist for any situation with a demand compound annual growth rate ≥ 60%.)
Are you skeptical of anyone’s model, including this one? Then let’s use the market's own track record of corrections. Prediction adjustments are the cleanest evidence of systematic underestimations—and they only move in one direction:
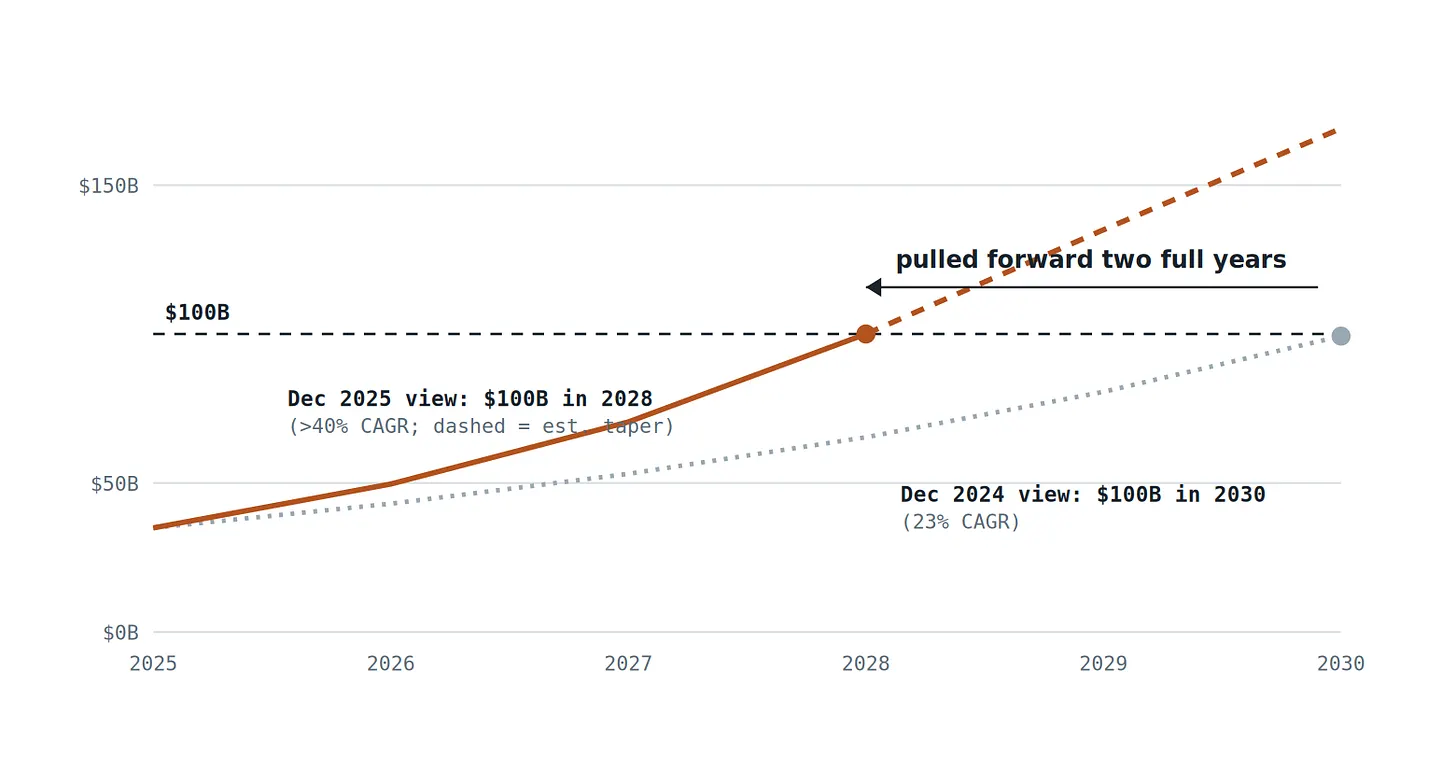
Figure 6 — Micron Semiconductor HBM market (TAM) forecasts: Comparison of December 2024 outlook with December 2025 outlook. Within just twelve months, this supplier advanced its $100 billion milestone target from 2030 to 2028, while nearly doubling its implied growth rate—raising total HBM cumulative revenue from 378 billion dollars between 2025 and 2030 to 555 billion dollars (a growth of 47%). TAM is a prediction of producible and salable products; as delivery rates are at historical lows, actual demand is higher than every line in the graph. (Data source: Micron Semiconductor disclosures; The Next Platform, December 19, 2025.)
Pricing trends tell the same story from a third angle. Annual HBM contract negotiations lag so severely behind the spot explosion in 2025-26 that by the first quarter of 2026, the profits from a commodity DDR5 RDIMM wafer briefly surpassed those of an HBM wafer—this is precisely why suppliers seek multiple increases when entering the 2027 HBM4 negotiations. When a scarce input can credibly threaten to be reallocated to its alternative scarcity, you are not in a cycle. You are in an auction.
Three honest counterarguments—and what they actually change
Counterargument one: Efficiency will shrink demand. This is a serious one. Because bandwidth is the bottleneck, the entire research community is attacking it: multi-head potential attention could compress KV cache by about 90%; sparse attention schemes stop rereading the entire context; KV quantization halves bytes again; speculative decoding restores arithmetic intensity; NVIDIA's Rubin CPX pushes pre-filling onto cheaper GDDR7 specifically to save HBM for decoding. All of these are real, and any one of them could absorb a year's worth of "exponential demand." But the record so far is pure Jevons paradox: every tenfold decrease in per-token cost has expanded token consumption by more than tenfold—the threefold increase at Google happened during the fastest efficiency improvement period in the industry's history. Efficiency changes the noise of the slope, not its sign. It is a timing risk for any given quarter, not a rebuttal to the deficit.
Counterargument two: Memory at the top always looks structural. Fair enough. The up cycles in 1995, 2018, and 2021 each forged a "this time is different" argument about eighteen months before profit margins collapsed because high prices historically triggered a wafer capacity arms race. But look at where the money has gone this time: capital expenditure has discipline growing 14%, directed toward node migrations and HBM conversions within existing cleanroom space—according to Figure 4, this reduces traditional bits while increasing HBM bits. The classic depression mechanism comes from excess supply of new wafers; the earliest batch of true new wafers arrives in mid-2027, with the large ones coming in 2028-2030. The excess supply scenario is not impossible—it has a timeline. Its earliest credible window is 2029, and only if demand growth simultaneously halves.
Counterargument three: China. Changxin Storage holds a high single-digit share in DRAM, concentrated in traditional nodes, and faces equipment limitations on the EUV adjacent and TSV-dense processes required for HBM4. Chinese supply is a real force in the next downturn of commodity DRAM; it is not a force leading HBM from 2026-2028.
Notice that none of these counterarguments dispute the direction. The bears argue about when the gap will close. No credible person is still arguing that it does not exist.
The mean itself is shifting
Cyclical commodities oscillate around a stable mean of demand. HBM demand is the product of three exponentially growing curves—model size, context length, and inference amount—pressed against a supply system that pays a 4:1 wafer tax and increases capacity over multiple years of delivery timeline. The mean is unstable; it is moving upward exponentially, and the suppliers' own correction history (Figure 6) shows that even those building factories cannot improve their estimates fast enough to keep up with it.
The assertion of this article is intentionally constrained: it does not say that memory will never cycle again, but at least until 2028, HBM supply cannot intersect with demand—therefore, prices, quotas, and multi-year prepayments will continue to bear the rationing function. The evidence is laid out in the accounts: delivery rates are at historic lows, capacity has sold out for two years ahead, and 2027 contract prices have reached multiples of premiums.
This assertion is also falsifiable. Three signals would break this judgment, and readers should watch for them: 2027 HBM4 contract prices level off rather than multiple premiums; suppliers' delivery rates return to normal while rebuilding inventory; or capital expenditure shifts significantly from process and conversion spending to net new wafer starts ahead of schedule. Until any of these signals出现, the baseline scenario remains valid.
Betting on a return to cyclical normal is betting that the three exponential curves will pause long enough for the four-to-one wafer tax and two-year factory construction timelines to catch up with them. The arithmetic tells us otherwise.
Betting on a return to cyclical normal is betting that the three exponential curves will pause long enough for the four-to-one wafer tax and two-year factory construction timelines to catch up with them. The arithmetic tells us otherwise.
Sources and notes: TrendForce (June 2, 2026; November 13, 2025; December 26, 2025 via Commercial Times); Micron Q1 FY2026 earnings call and TAM disclosures (via The Next Platform, December 19, 2025); Tom's Hardware report on Samsung/SK Hynix shortage warnings (May 2026); Gholami et al., "AI and the Memory Wall," IEEE Micro (2024); Kim Jung-ho (KAIST) public lectures; Google/Alphabet token amount disclosures (2025); DeepSeek-V2/V3 Technical Reports; NVIDIA Rubin CPX release (September 2025); SemiAnalysis, "Memory Mania" (February 2026). Figures 3 and 5 are calculations by the author, with assumptions noted in the figure captions.
Disclosure: This article represents independent analysis and opinion for informational purposes only. This article does not constitute investment advice, and the forecasts in it carry significant uncertainties. Readers should verify data against original sources before making decisions.
免责声明:本文章仅代表作者个人观点,不代表本平台的立场和观点。本文章仅供信息分享,不构成对任何人的任何投资建议。用户与作者之间的任何争议,与本平台无关。如网页中刊载的文章或图片涉及侵权,请提供相关的权利证明和身份证明发送邮件到support@aicoin.com,本平台相关工作人员将会进行核查。


