The market for tokenized stock perpetual contracts now presents an unbalanced structure typical of early markets: retail investors are clustered in leveraged long positions, while market-making and arbitrage capital have not yet stepped in to fill the other side. Additionally, there is serious fragmentation among exchanges, with prices reported independently.
Written by: @BlazingKevin_, Blockbooster researcher
Summary
The market for tokenized stock perpetual contracts has emerged from nothing in the past three quarters. It now exhibits an unbalanced structure typical of early markets: retail investors are clustered in leveraged long positions, while market-making and arbitrage capital have not yet stepped in to fill the other side, compounded by severe fragmentation among exchanges and independently reported prices.
This imbalance will "cost" willing short-sellers in two ways:
- Continuously positive funding rates;
- Price differentials for the same stock across different exchanges.
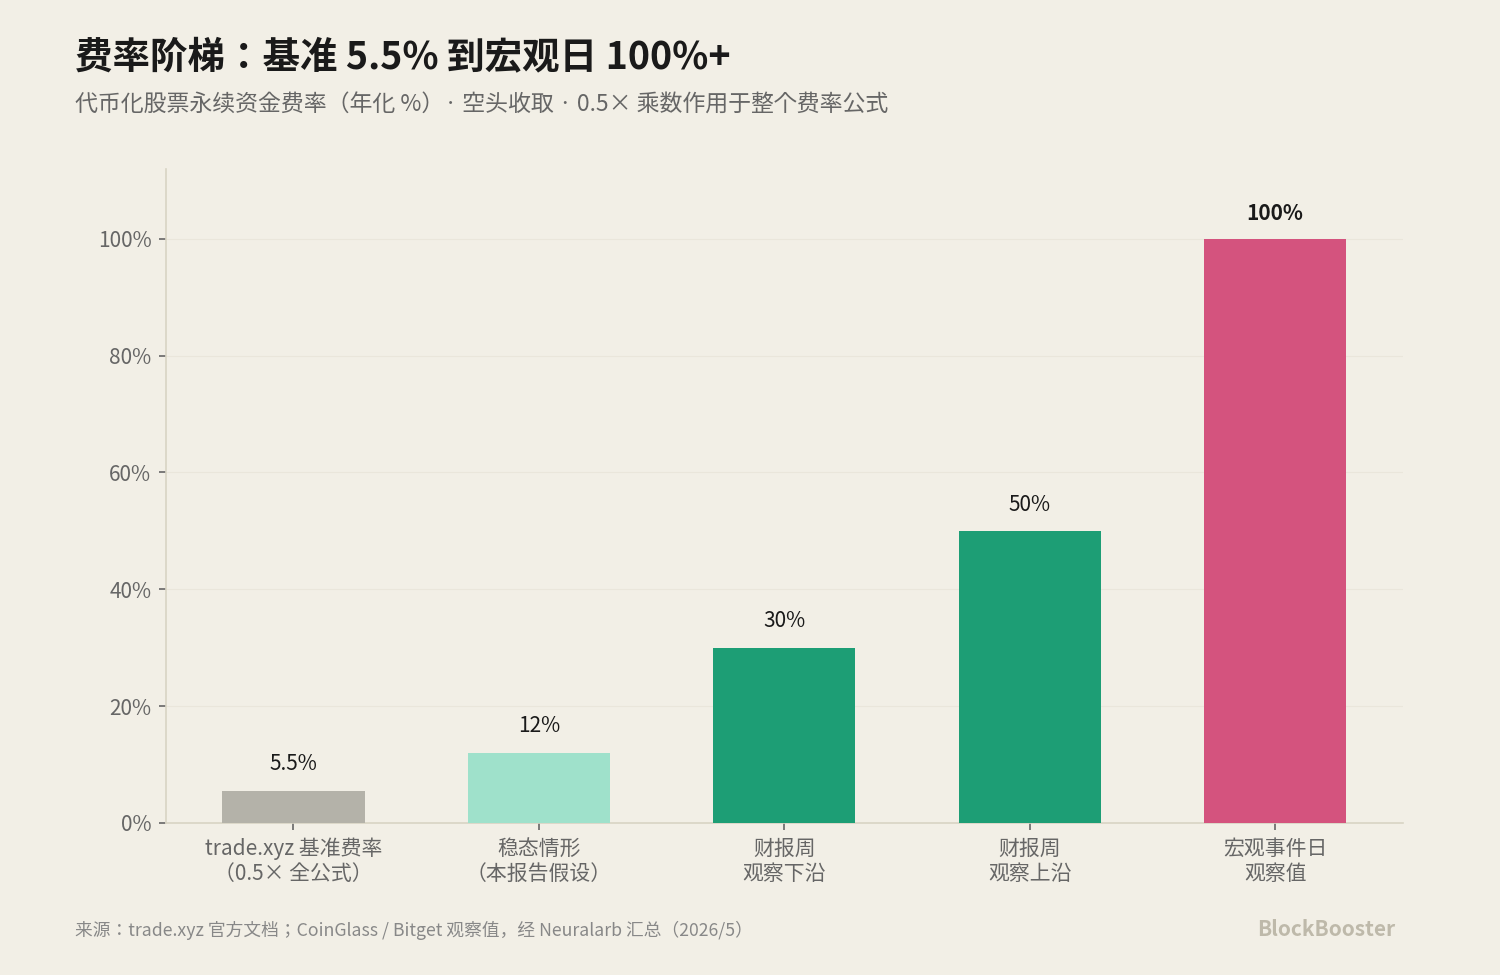
Popular individual stocks during earnings reporting weeks can see annualized funding rates rise to 30–50%; on days of major macroeconomic events, they can even exceed 100%.
Our conclusions on arbitraging tokenized stock perpetual funding rates are as follows:
1: After accounting for all costs, targeting "event-level" assets and adopting a "long-term holding to earn funding rates" strategy, the total capital can yield excess annualized net returns of about 10–17.5% (with a neutral estimate of 13–14%; absolute returns excluding risk-free rates around 14–21%). However, trying to profit from "event window quick in and out" trades will result in losses in most cases.
The calculation for returns uses the "total capital, excess" basis:
- Total capital: the denominator includes cash tied up in hedging and margin used for perpetuals;
- Excess: further subtracting the risk-free rate SOFR from this basis.
Achieving a "window gross funding rate" of 30–50% is difficult. If held for only two days, the cost of opening and closing a position can consume or even exceed all funding received in those two days. It is only when the gross funding rate exceeds 100% and passive orders can be used that window trading becomes worthwhile. Thus, the correct strategy is to focus on "weeks-long long holding" and only opportunistically add positions during extreme funding rate situations, rather than chasing every event.
2: "Spike liquidation during thin trading sessions" has been systemically resolved on mainstream exchanges.
This addresses "spike liquidation," but the real risk of significant price gaps remains, relying on margin buffers and position rules to withstand it. Specifically:
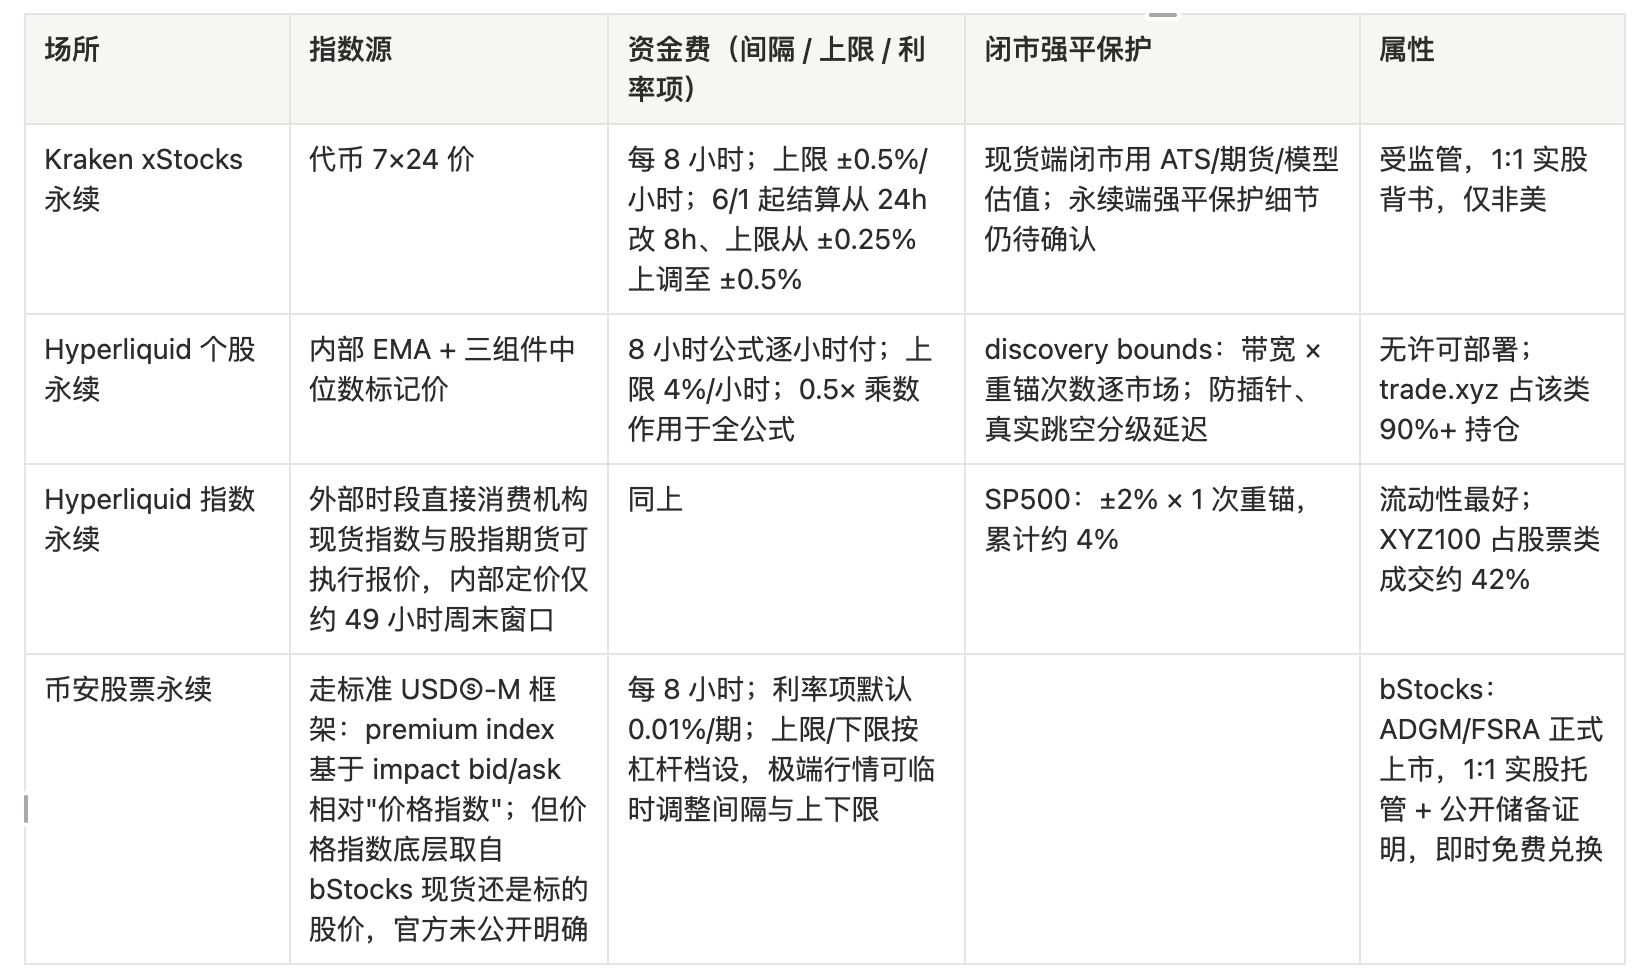
- Kraken's stock perpetuals reference their spot token prices 24/7. Thus, perpetuals and hedges drift together and won't split;
- On Hyperliquid, stock perpetuals switch to an internal pricing mechanism when external markets are closed and have a price band called "discovery bounds"—if a position's liquidation price falls beyond this effective boundary, it will not be liquidated during the boundary's effectiveness period.
Two points worth noting:
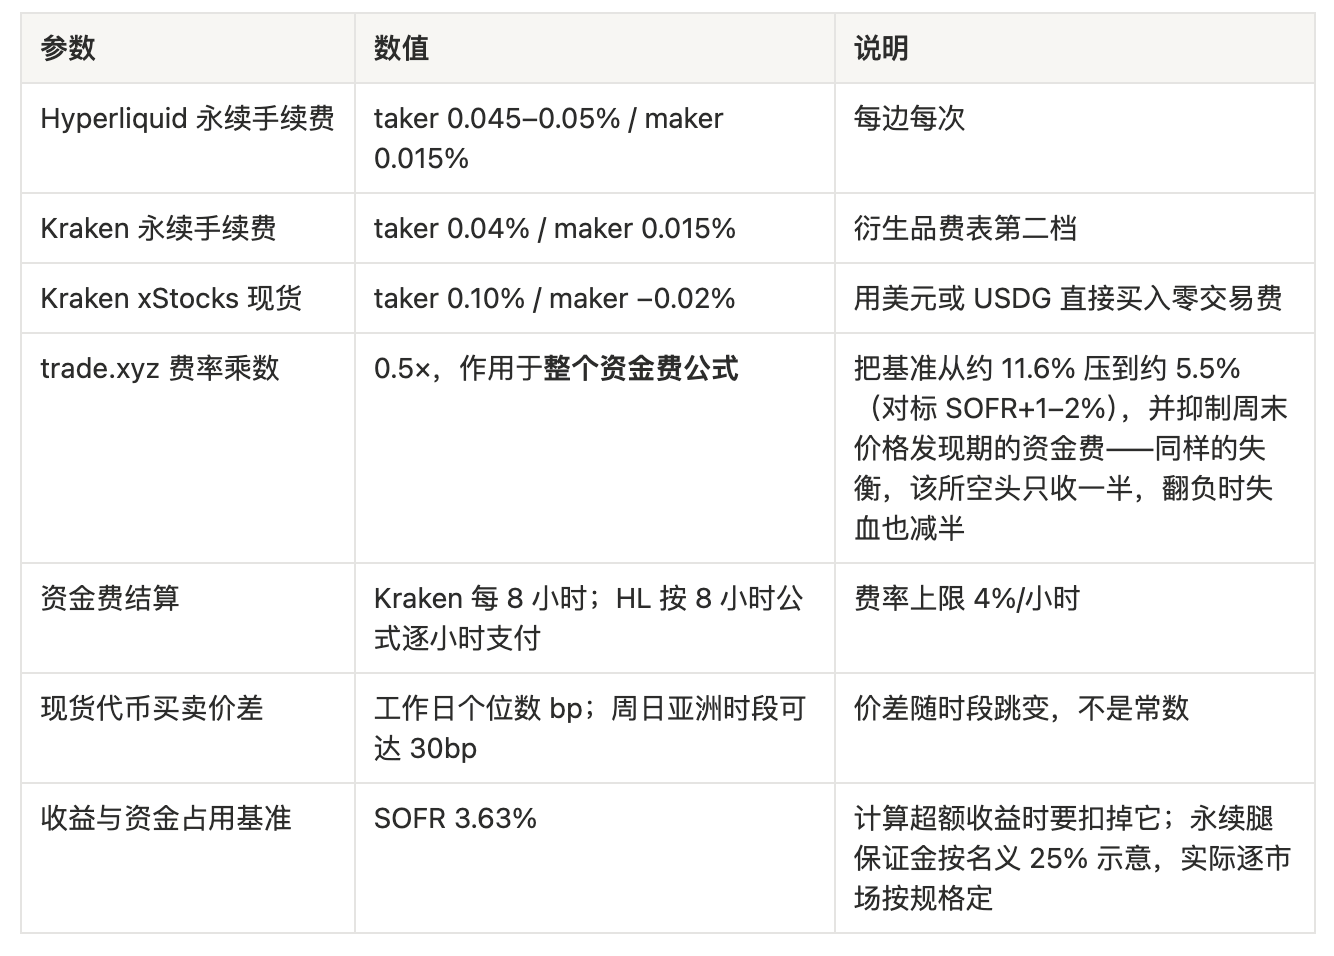
- trade.xyz has a 0.5 times funding rate multiplier, which applies to the entire funding rate formula. This means: for retail long positions, they can only receive half the funding rate for the short position in this exchange, directly halving carry income.
- The margin model is differentiating—index assets now support full margin, but individual stocks mostly remain on isolated margin.
3: The window is gradually narrowing.
Exchanges have begun to structurally lower funding rates. Binance's own closed loop product for tokenized stocks, bStocks, has been launched. This will accelerate the convergence of inter-exchange price differentials.
1. Where Opportunities Arise
Why do tokenized stock funding rates continue to be positive and high?
In a market dominated by retail investors using unilateral leveraged long positions, while market-making and arbitrage capital have not yet fully entered, contract prices will consistently be higher than spot prices. Thus, funding rates turn into "rent" that longs continuously pay to shorts. Data from Coinglass and Bitget show that funding rates for popular individual stock perpetuals often exceed annualized 30–50% during earnings weeks, with peaks above 100% during macro events.
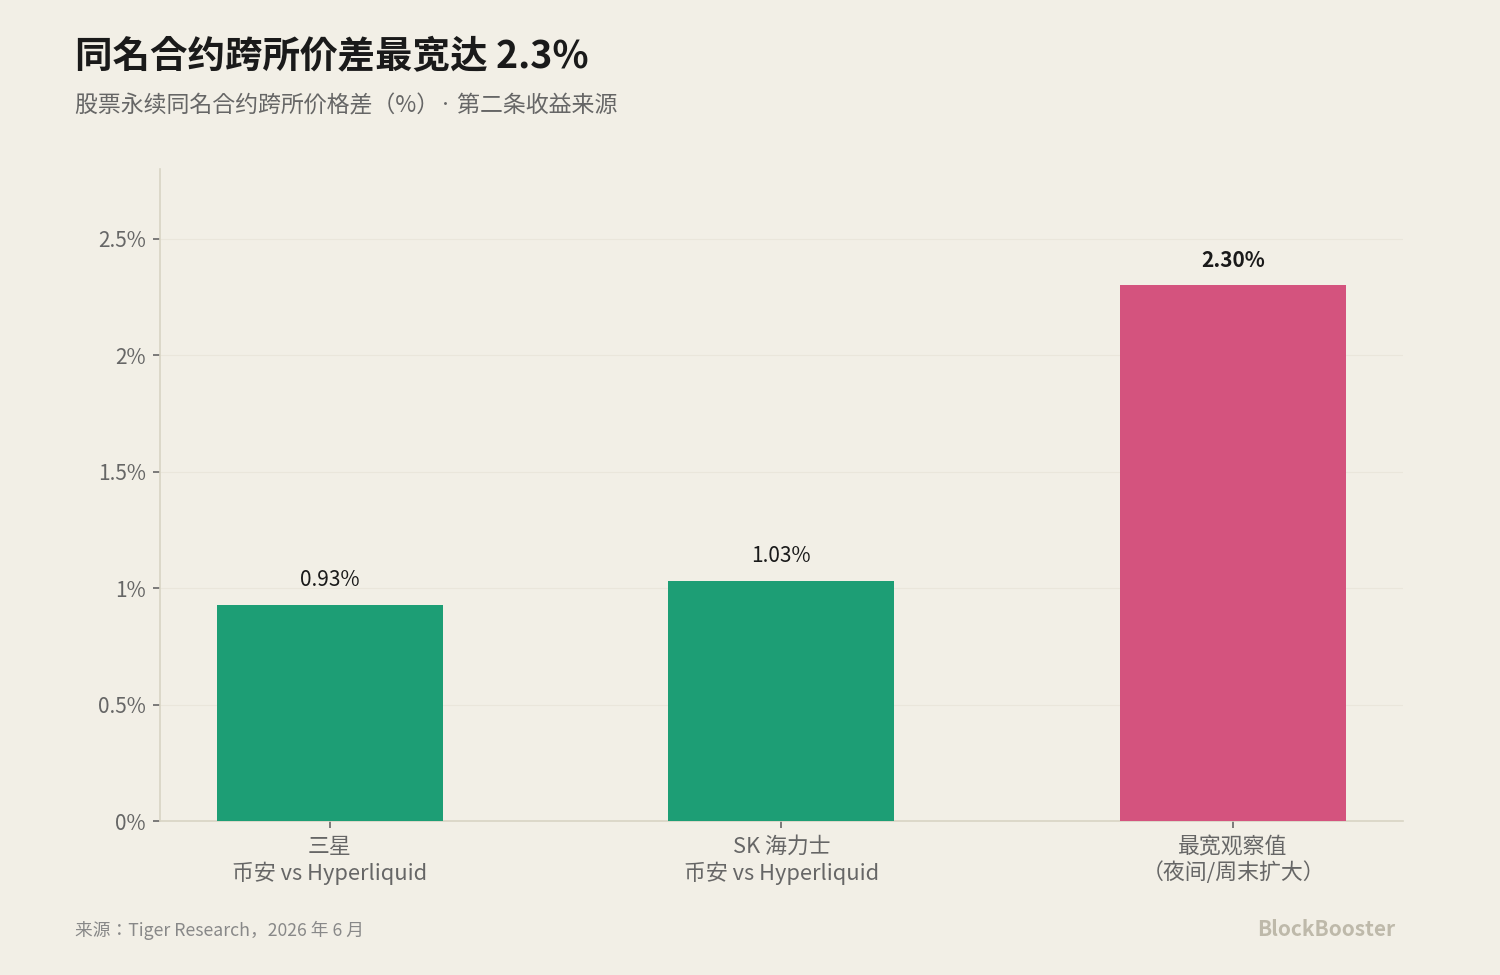
Inter-exchange fragmentation leads to a second layer of income. The same stock is differently priced at Kraken, Hyperliquid, Binance, BitMEX, etc., with funding rates and prices rarely aligning. In June: Binance's perpetual for Samsung was priced 0.93% higher than Hyperliquid's corresponding contract, SK Hynix was 1.03% higher, with the widest gap reaching 2.3%, and price differences tend to widen overnight and over weekends.
Even in the more mature BTC/ETH perpetuals, inter-exchange funding rate differences have long existed—public tests show that the funding rate difference between Hyperliquid and Binance can stabilize at about 6–11% annually, with peaks reaching 23–48%. The fragmentation in stock perpetuals is even greater than this.
2. Not "Risk-Free Arbitrage" Returns
Arbitraging tokenized stock perpetual funding rates has two distinctly different sources of income:
2.1 Funding Rate Carry is a Form of "Risk Compensation"
This is akin to our previous conclusion about "crypto benchmark interest rates": the interest differentials among various on-chain rates form a "risk map," rather than a "free arbitrage surface"—the existence of interest differentials indicates that they are pricing some risk.
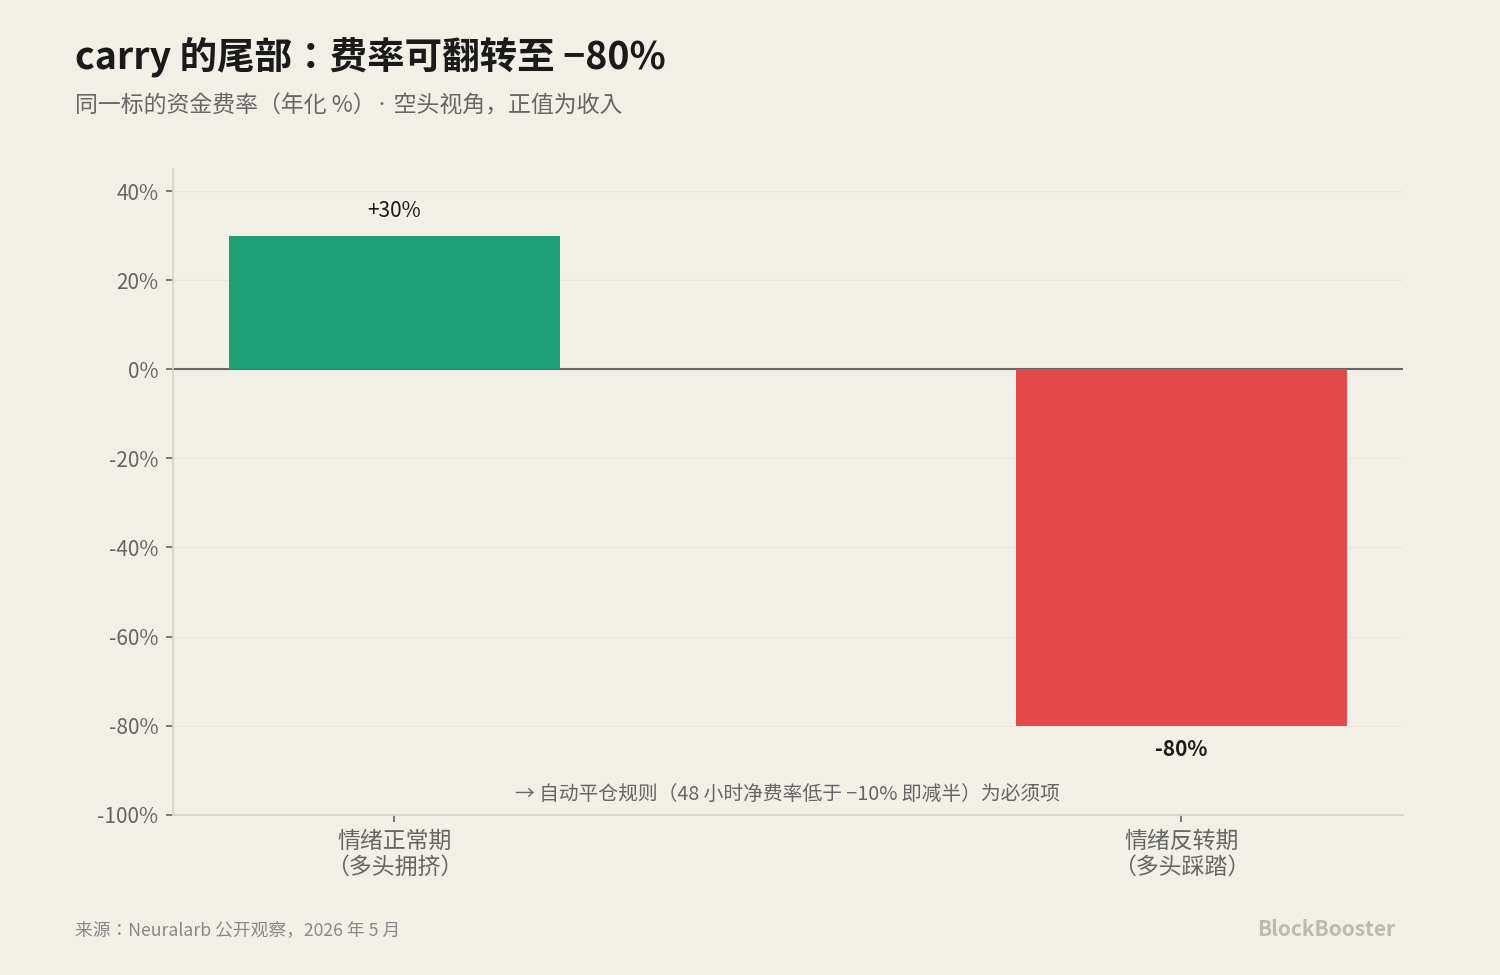
The risk being priced here is "tail risk": the funding rate for popular assets might flip from an annualized +30% to -80% when market sentiment reverses. Once negative, holding carry positions will result in continuous losses during each settlement period until closure.
2.2 Inter-Exchange Price Differentials: Closer to True Arbitrage, But with Its Own Risks
The method is: short the contract at the expensive exchange, go long the same contract at the cheap exchange, betting that the price differential will eventually converge. Here are two traps:
- The differential may initially widen before converging. Meanwhile, the liquidation for shorts is referenced to the marked price of the expensive exchange—if the differential widens, you get closer to liquidation.
- The time until convergence is uncertain. "Waiting for convergence" can easily turn into a "holding position."
Therefore, the price differential position must have its own rules, independent of carry: a stop-loss line, maximum position size, and maximum holding period.
On the Choice of Hedging Tools
The choice of what to use for hedging will also change the shape of risks:
- Using spot tokens for hedging: bears the basis risk between "tokens vs real stocks."
- Using perpetuals from another exchange for hedging: bears the risk of inter-exchange convergence, plus the "double oracle risk" where both oracles may fail.
- Using broker-dealer actual stocks for hedging: this is the worst choice. Because actual stocks only have liquidity during U.S. trading hours; by the weekend, the entire hedge leg becomes frozen—thus placing the gap risk at its maximum.
3. Net Return Estimates Under Three Scenarios
All fee parameters below are taken from the official fee schedule and publicly available documents of each exchange.
Verified Fees and Mechanism Parameters
Execution cost basis:
- Passive execution: about 0.15-0.2%;
- Active execution: about 0.6-0.9%, of which the price differential for the spot token leg is significant.
Return Basis
- "Total capital" = full cash in the hedge leg + margin for the perpetual leg, totaling equivalent to 1.25 times the nominal;
- "Excess" = returns after deducting SOFR from total capital.
The table will first provide a "nominal basis subtotal" for easy cross-checking of various costs, but the final conclusions will refer to the last row of "total capital excess returns."
Scenario One: Steady Long Hold
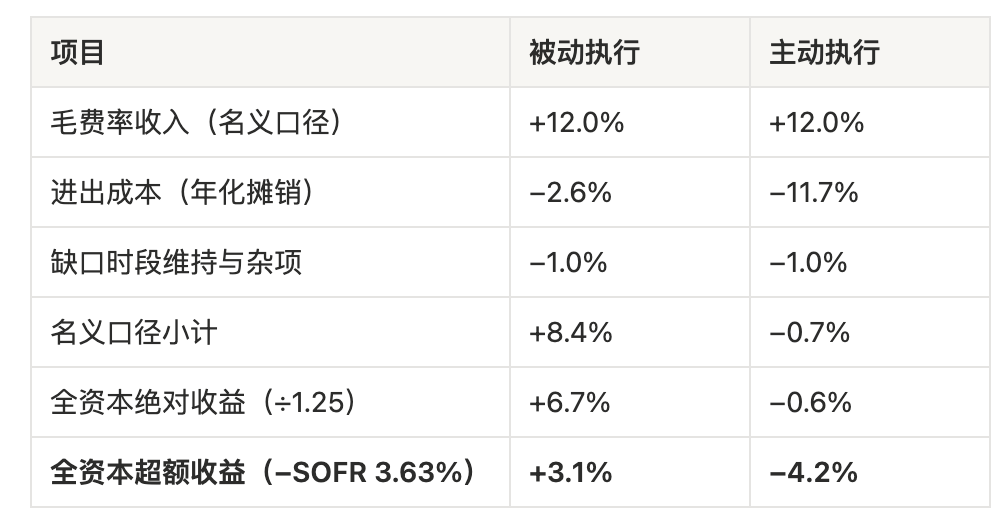
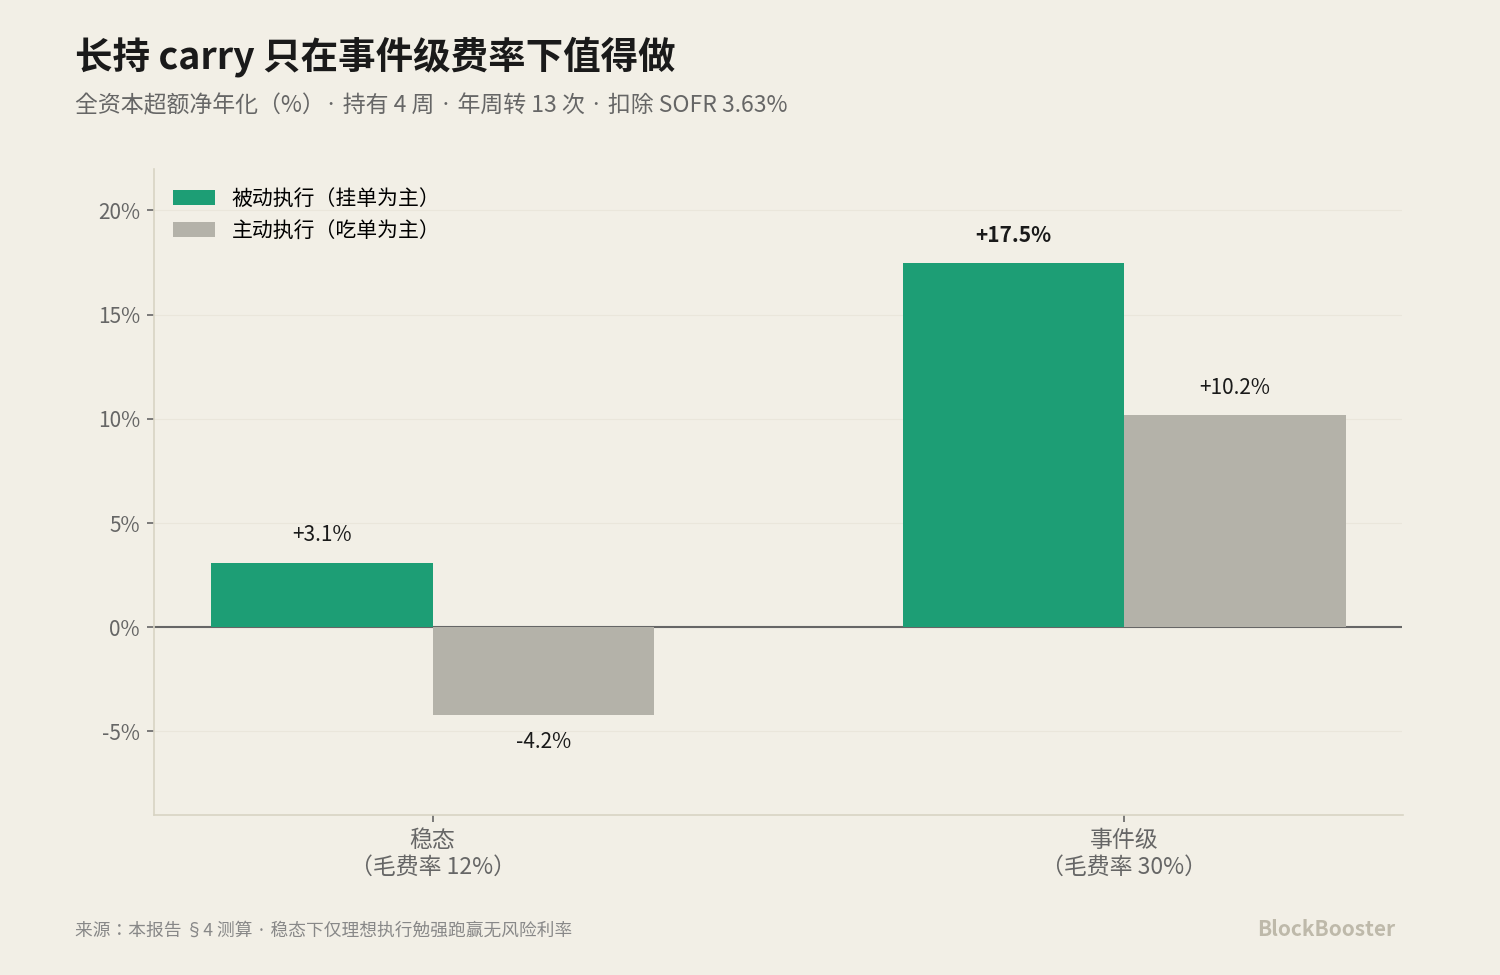
In a steady state with gross funding rates, this strategy only barely outperforms the risk-free rate under ideal execution. In other words, the steady state itself does not justify pursuing this strategy. The premise for the strategy's validity is that the funding rates are in a state of "event-level uplift."
Scenario Two: Event-Level Long Hold
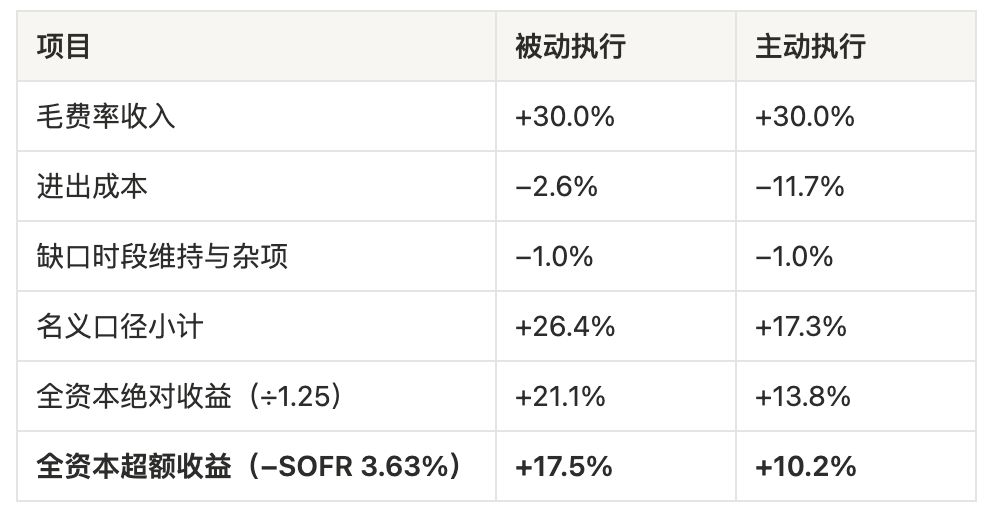
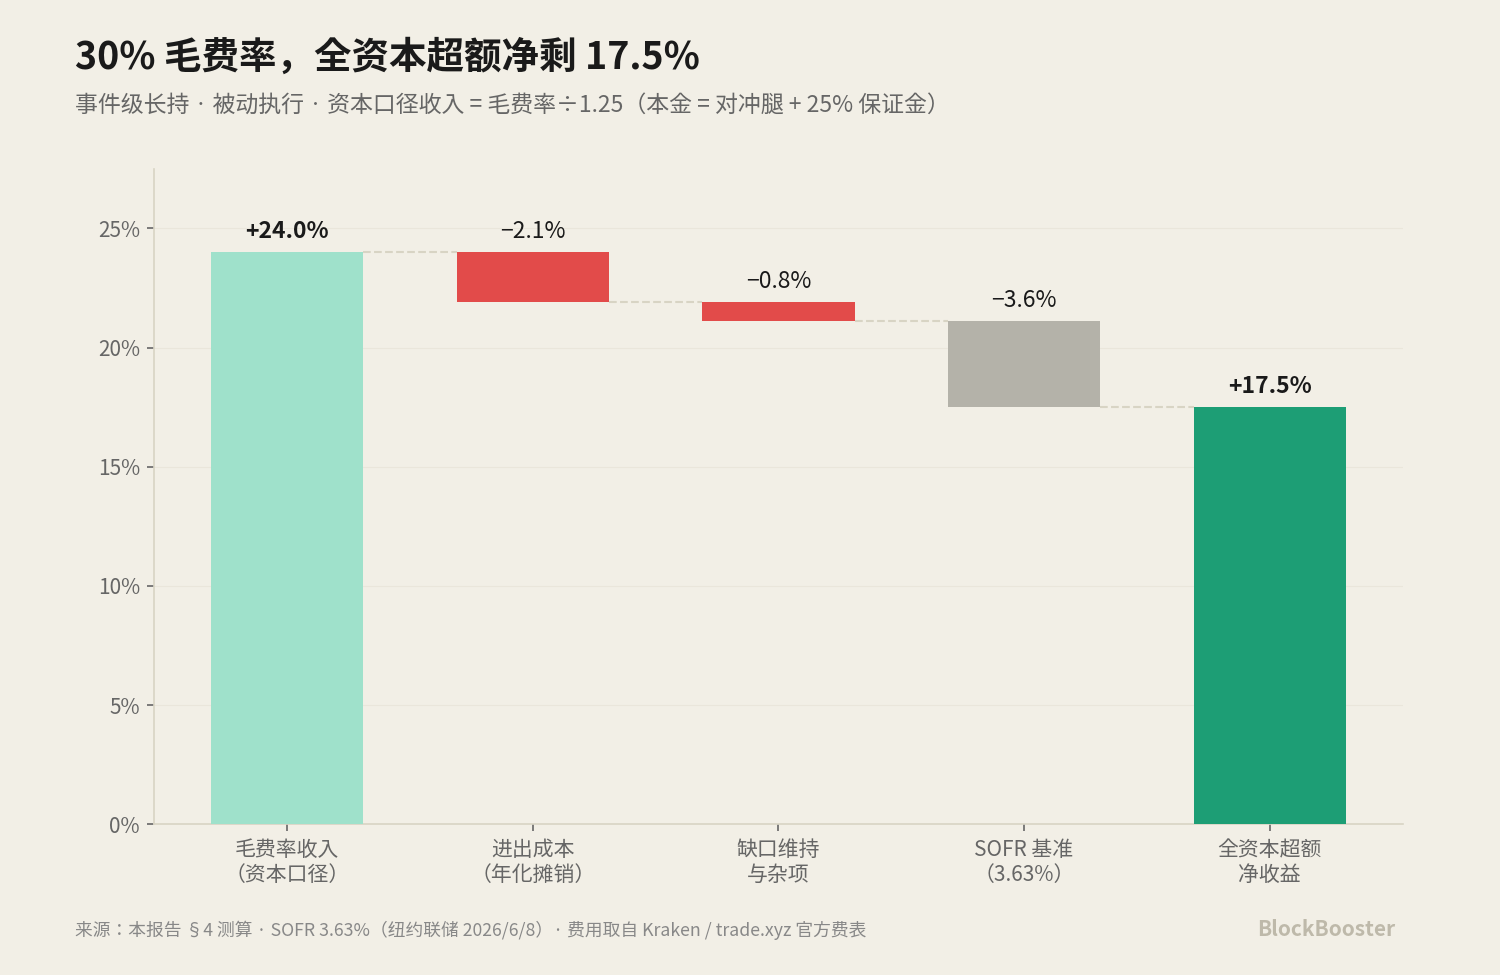
Total capital excess net returns are approximately 10.2–17.5%, with a neutral estimate of 13–14% (absolute returns 13.8–21.1%). The active execution tier aligns with industry experience; the upper tier derives from passive execution.
Two points must be noted in the table:
A 30% gross funding rate during the holding period is not guaranteed—it may diminish or even turn negative.
The 0.5 times multiplier is a double-edged sword. The gross funding rate values in this table are "venue neutral." The same imbalanced long position, if occurring on Hyperliquid, would result in the short position receiving only half—meaning that to achieve a 30% gross funding rate on Hyperliquid, a disparity equivalent to 60% elsewhere is needed.
Scenario Three: Quick In and Out During Event Window
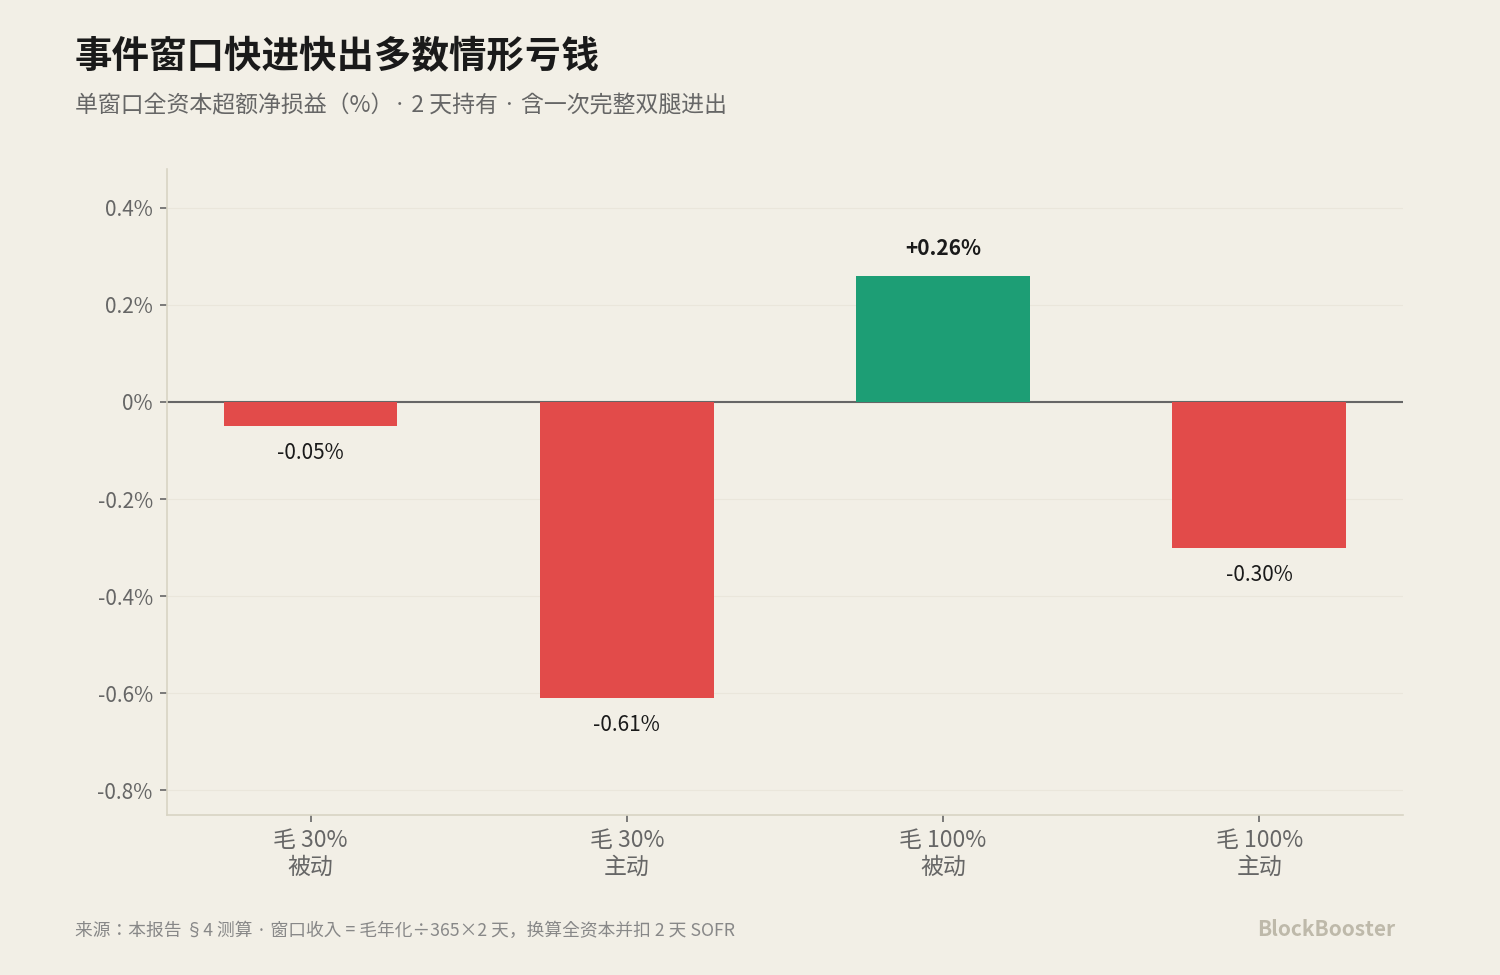
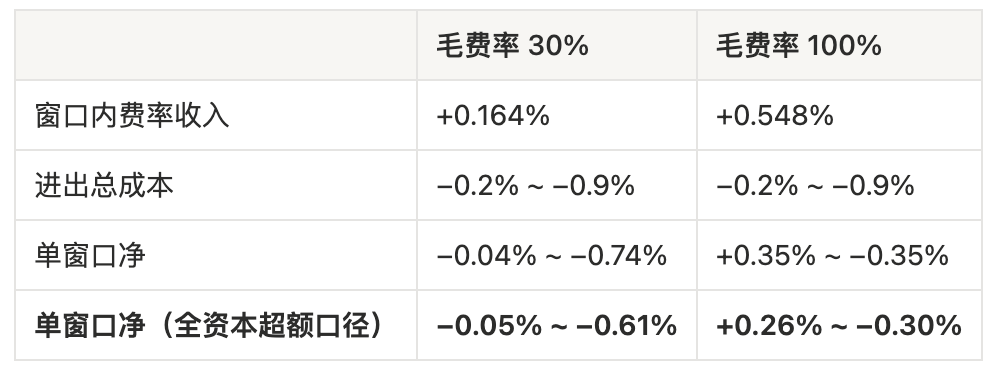
A 30–50% window gross funding rate is simply unfeasible. Due to the short two-day holding period, the costs of full entry and exit cannot be sufficiently spread out, so in most instances, individual windows yield negative results. The only scenario yielding a positive result according to the total capital excess basis corresponds to annualized returns of about 47%—but this happens during the worst periods of liquidity and hardest times for passive execution.
Thus, the execution principle is confirmed: primarily, focus on "event-level long holding"; add positions opportunistically during extreme funding rate situations; never pay the execution cost just for the window itself.
4. Risks
The feasibility of the entire hedging structure depends on a mechanistic question—what does the index price of perpetual contracts track when the underlying stock markets are closed? Three designs correspond to three entirely different risk profiles:
Design A: Tracks the token's price 24/7 → both legs drift synchronously, with a small basis, allowing for effective hedging. Kraken belongs to this category: its stock perpetuals explicitly reference the continuous on-chain price of xStocks, providing real-time reference prices even when traditional markets are closed.
Design B: Tracks the underlying stock price → perpetuals continue to move while reference prices remain static, causing both legs to split, thus rendering hedging ineffective every weekend. Binance belongs to this category.
Design C: Internal pricing + price band protection → the optimal form. The stock perpetuals on trade.xyz from Hyperliquid operate this way:
- When external markets are open, they use the external fair price;
- When closed, oracles switch to an internal mechanism that adjusts the price differential based on the order book, continuously advancing with a 30-minute time constant for exponential weighting; the marked price is taken as the median of three components to filter out anomalous trades;
- The crucial aspect is the discovery bounds mechanism: the marked price is constrained within an instantaneous range of "reference price ± (1/maximum leverage)." When prices reach the threshold of the range, they "reanchor" according to a preset number of times; once cumulative limits are reached, it rigidly caps until external pricing resumes. Positions with liquidation prices outside the effective boundary cannot be liquidated during the effective period.
Price band parameters are configured per market and do not share a unified numerical value across markets, requiring per-line reading from the trade.xyz Specification Index. For example: SP500 is ±2%, allowing for 1 reanchor; the instantaneous range for individual stocks at 20x leverage is ±5%, and cumulative limits grow exponentially with allowed reanchor counts. The international site of Coinbase also employs a similar structure for its stocks and pre-IPO perpetuals.
This mechanism protects against "spikes," not "gaps."
Price bands will progressively expand, and each reanchor may move the liquidation price of positions into the new boundaries—thus, a true large gap results not in cancellations of liquidations but rather in tiered delays; once cumulative capping occurs, the remaining gap will be filled in a single instance as external pricing resumes.
Economically, losses remain bounded: at the moment of liquidation, the hedging is generating synchronous profits, so net losses approximate "liquidation friction + subsequent naked exposure," rather than the entire gap. The price band protects up to the cumulative boundary, beyond which margin buffers and position rules take over.
4.1 Three Residual Risks
Risk One: Token liquidity and decoupling. A single event can cause secondary price differentials to explode—public records already show that spot price differentials can widen from 1bp on weekdays to 30bp during the Asian weekend.
Risk Two: Mismatches in margin structures and liquidation timings. When perpetual contracts require additional margin, unrealized profits on hedging tokens may not be immediately usable. Constraints are diverging here: Hyperliquid's individual stock perpetuals mainly use isolated margin, while indices support full margin. The trouble with isolated margin is this: after opening a position, you can only add margin, but cannot withdraw—this operates as a "one-way door." Thus, mismatch risks for individual stocks can only be offset by thicker single positions and will require automatic margin replenishment mechanisms and reserved funds. Binance remains the only venue where the account structure can alleviate this risk for individual stock carry because perpetuals and spot trades are under the same regulated entity.
Risk Three: Continuity of hedging over weekends. If spot trading is indeed closed on weekends: existing hedges remain unaffected, but the ability to "rebalance and add" over the weekend is interrupted—forcing a reliance on on-chain DEX, which is precisely when price differentials are widest. Hence, weekends triple the adversities: perpetuals fluctuate, spot trading may close at the same exchange, and on-chain backups are thin. The operational strategy is not reliant on verification results: always build positions according to "zero weekend rebalancing," keeping delta adjusted before the closing of U.S. markets every Friday.
5. Mechanism Comparison
Priorities must be viewed through "two sets of accounts."
- Carry account: Binance and Kraken are prioritized—rates are not discounted by multipliers, they are regulated, and they are the only platforms for individual stocks that can alleviate liquidation mismatches using the same exchange account structure; Hyperliquid ranks lower in the carry account.
- Price differential account: Hyperliquid retains and is prioritized—it is the main battleground for price discovery, has low order costs, and also halves losses when rates turn negative; furthermore, inter-exchange differential trades naturally split between two exchanges and do not rely on mutual margin.
The risk profile for index assets is clearly superior to that of individual stocks: its oracles directly operate with institutional quotes and traditional stock index futures during extended periods, with internal pricing having only about 49 hours of weekend windows remaining, and they already use full margin. Therefore, if a portfolio includes index perpetuals, it merits separate, broader risk budgets.
免责声明:本文章仅代表作者个人观点,不代表本平台的立场和观点。本文章仅供信息分享,不构成对任何人的任何投资建议。用户与作者之间的任何争议,与本平台无关。如网页中刊载的文章或图片涉及侵权,请提供相关的权利证明和身份证明发送邮件到support@aicoin.com,本平台相关工作人员将会进行核查。


