Bitcoin signals of a bottom forming around $60,000 emerge.
Written by: Glassnode
Translated by: AididiaoJP, Foresight News
Bitcoin has fallen to near $60,000, with losses widening, putting pressure on recent buyers. However, improvements in liquidity, increased passive buying, and the patience shown by ETF holders suggest that the market may be forming a bottom.
Summary
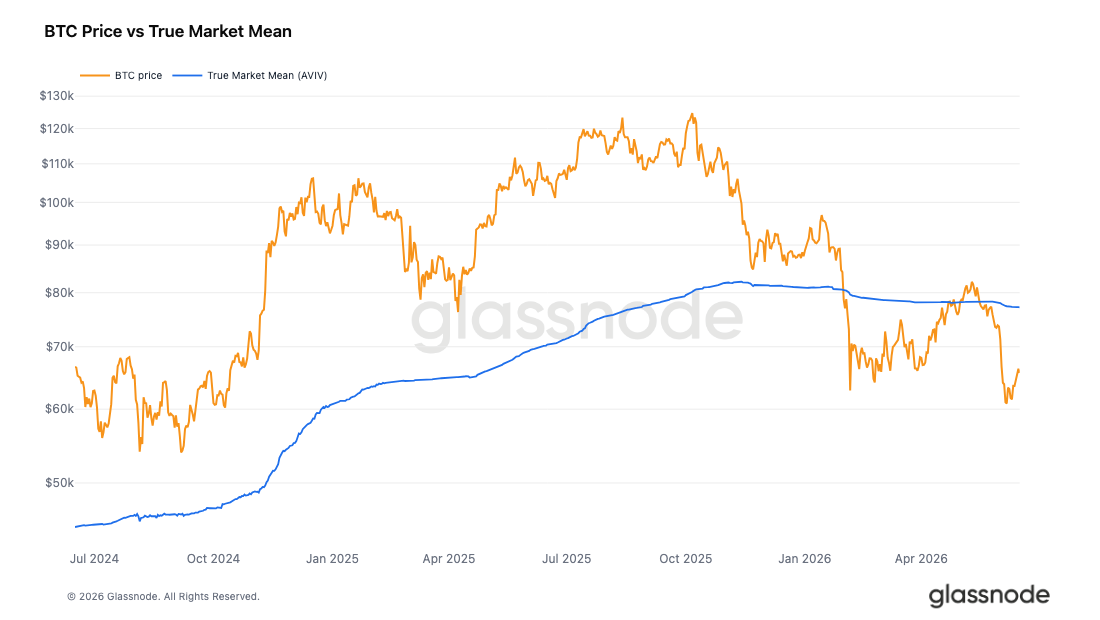
- Bitcoin is trading at a 15% discount compared to the true market mean of $77,200, confirming that it is still in a bear market range, despite a rebound after the ceasefire that alleviated geopolitical risk premiums.
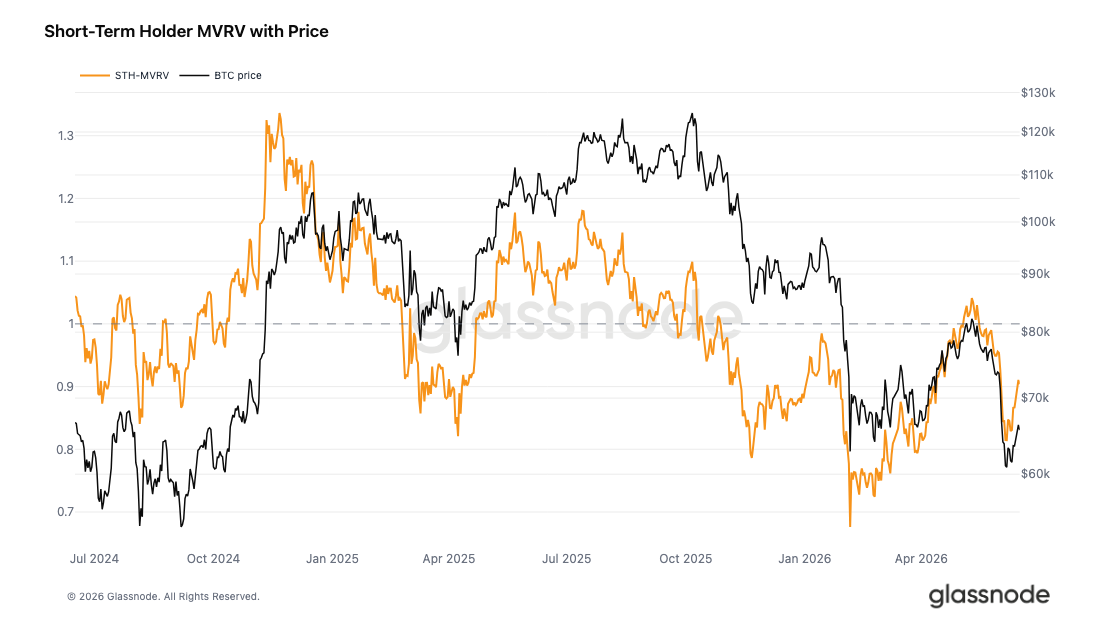
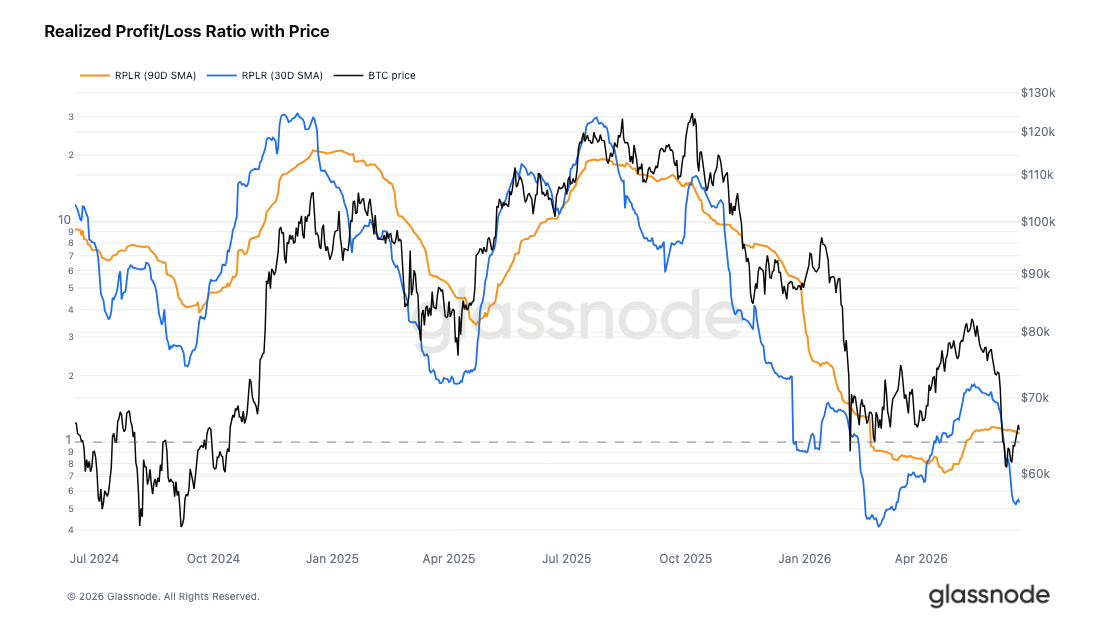
- Short-term holders' MVRV has rebounded from 0.81 to 0.90, but it remains below the breakeven line of 1.0, with a profit-loss ratio of 0.53 over the 30-day SMA confirming that realized losses still dominate capital flows.
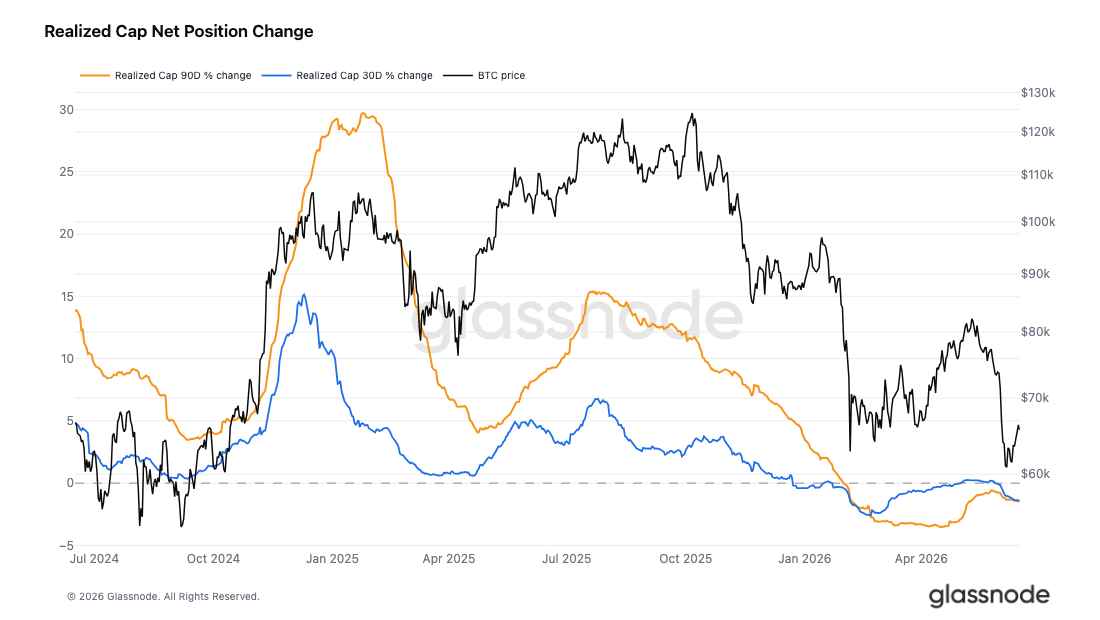
- The realized market cap has contracted by 1.45% to $1.07 trillion over the past 90 days, but the 7-day change is close to stagnation (-0.18%). A return to positive growth and recovery of the true market mean is a key condition for a credible shift into the pre-bull market phase.
- Spot liquidity conditions have improved, with passive buying deepening after Bitcoin's decline towards $60,000, reducing reliance on aggressive buyers, indicating that selling pressure is being absorbed more efficiently.
- The total value of open contracts remains low, but large passive buying continues to absorb supply, with aggressive selling pressure receding, indicating that a more patient buyer base is beginning to provide support at current price levels.
- Implied volatility has largely normalized, while realized volatility continues to rise, pushing the volatility risk premium into negative territory.
- Skew has retreated from recent extremes, indicating that downside protection demand has significantly eased.
- Options flow is tending towards balance, but the positions of market makers remain concentrated in the $68,000 negative gamma region.
Macro Insights
The decline of Bitcoin in May-June was a war premium event. In the first three weeks, BTC dropped about 22% from $77,486 to a low of $60,861, while WTI crude oil held above $90, and gold rose due to safe-haven demand. A classic case of geopolitical-stagflation.
The peace agreement between the US and Iran announced on June 14 broke this pattern within just 48 hours. Oil collapsed from $86 to $76, and the safe-haven premium of gold faded. BTC then rebounded, returning to the $65,000-$66,000 range that was lost during the previous decline.
The percentage change in oil has far exceeded other assets, which is the key interpretation. The energy and geopolitical premiums that suppressed risk assets over the past three weeks have been removed. Gold is the only asset among the three close to its starting position. Both BTC and oil are below their pre-shock ranges but for opposite reasons: oil is re-pricing the real demand outlook, while BTC is re-pricing "no headwinds."
As geopolitical risk premiums ease, the conditions pushing capital towards safe-haven assets and away from risk assets are also alleviating. Historically, this rotation has been favorable for BTC.
On-Chain Insights
Below Market Mean
With the easing of geopolitical risk premiums following the US-Iran peace agreement and oil's decline from $86 to $76, the macro headwinds that recently suppressed risk assets are easing. This backdrop provides an opportunity to reassess Bitcoin's position within its own cyclical rhythm (assuming the structural patterns of previous cycles still hold).
The clearest standard to distinguish between structural bulls and bears is to compare spot prices with the cost basis of active investor groups. The true market mean tracks the average buy price of actively traded coins and has historically been the dividing line between bear and bull markets.
Currently, the true market mean is $77,200, approximately 15% higher than the spot price of $65,600, indicating the market is still in an obvious discount range. The price briefly approached this level during the mid-May peak, but the subsequent pullback significantly widened the gap.
Despite the recent rebound, on-chain indicators still firmly indicate the bear market range. Only a rapid recovery of the true market mean can trigger a shift in our overall outlook from a bear market to a potential pre-bull market phase.
Recent Buyers Still in Loss
Given the ongoing discount to the true market mean confirming the overall bear market backdrop, the next question is: how is the rebound since the early June low faring for new entrants? The MVRV for short-term holders measures the overall unrealized profits and losses of moving coins over the past 155 days, with 1.0 being the collective breakeven point for this group.
Last week's report indicated this metric was at 0.83, with new buyers deeply in loss. It has since rebounded to 0.90 as prices recovered from the lows, but it still remains below the critical 1.0 threshold. The implied cost basis for this group is around $72,600, with an average unrealized loss of about 10%.
Although the recent rebound has brought some relief, it is still insufficient for this group to return to overall profit, which is a prerequisite for exiting the bear market. The increase from 0.81 to 0.90 has eased the pressure on recent buyers, but it hasn't fully resolved the situation. As long as the STH MVRV fails to return to 1.0, this group remains a potential source of selling pressure during any attempts at a rebound.
Losses Still Dominating Capital Flows
Further confirmation of the bear market framework and that the recent rebound hasn't propelled STH MVRV back to breakeven is that the overall market profit situation points to the same conclusion. The realized profit-loss ratio compares the dollar value of profitable coins to that of losing coins. A value above 1 indicates profit-taking dominance, while below 1 reflects that losses are the dominant force.
The 90-day SMA for this ratio is currently 1.10, far below the four-year average and only slightly above the neutral line of 1.0, indicating that the market is in a state of indecision on a quarterly smoothing level. Meanwhile, the 30-day SMA is more explicit, at only 0.53, confirming that losses realized over the past month significantly outweigh profit-taking.
The capital flow configuration with the 90-day SMA hovering around 1.0 and the 30-day SMA at 0.53 firmly confirms that we are currently in a bear market. Only when both SMAs sustainably rise above the bull market range of 2 will it be the first meaningful signal of a shift in underlying preferences.
Capital Quietly Outflowing
Measuring profit preferences through the realized profit-loss ratio is only half of the capital flow picture; the scale provides the complete view. The realized market cap measures the total cost basis of all circulating coins, increasing when capital flows into the network and decreasing when it flows out. Currently, the realized market cap stands at $1.07 trillion, having contracted by 1.45% over the past 90 days, with a 30-day change of -1.39%, reflecting sustained capital outflow on a cyclical level rather than a single sharp shock.
A weakly positive signal from the recent rebound is that the 7-day change has nearly stagnated (-0.18%). The contraction of the realized market cap corroborates the bear market assessment established by valuations and capital flow levels, indicating that the market is in a deep bear market with valuation discounts aligning with capital flows.
To reach a credible pre-bull market phase, specific measurable conditions need to be met: reclaiming the true market mean around $77,200, short-term holders' MVRV returning above 1.0, and a 90-day realized market cap turning to positive growth.
Off-Chain Insights
Spot Liquidity Turning Supportive
After Bitcoin's decline towards the $60,000 range, the conditions of the spot market began to improve. The Binance spot order book depth has clearly shifted towards buying, with buyer liquidity now exceeding pending sell orders, reaching the most abundant level in recent months.
This indicates that market participants are increasingly inclined to absorb supply at lower price levels rather than providing liquidity during a rebound. Although order book liquidity is fundamentally dynamic and can be quickly withdrawn, this recent shift marks a significant change from the previously seller-dominated conditions during the retreat.
Historically, a sustained buyer dominance often accompanies market stabilization, as deeper buy walls can provide support below the price and enhance the market's ability to absorb further selling pressure.
While this alone is insufficient to confirm a bottom, the emergence of strong buy depth indicates that spot market participants are increasingly willing to defend the current price levels.
Patient Buying, No Aggressive Behavior
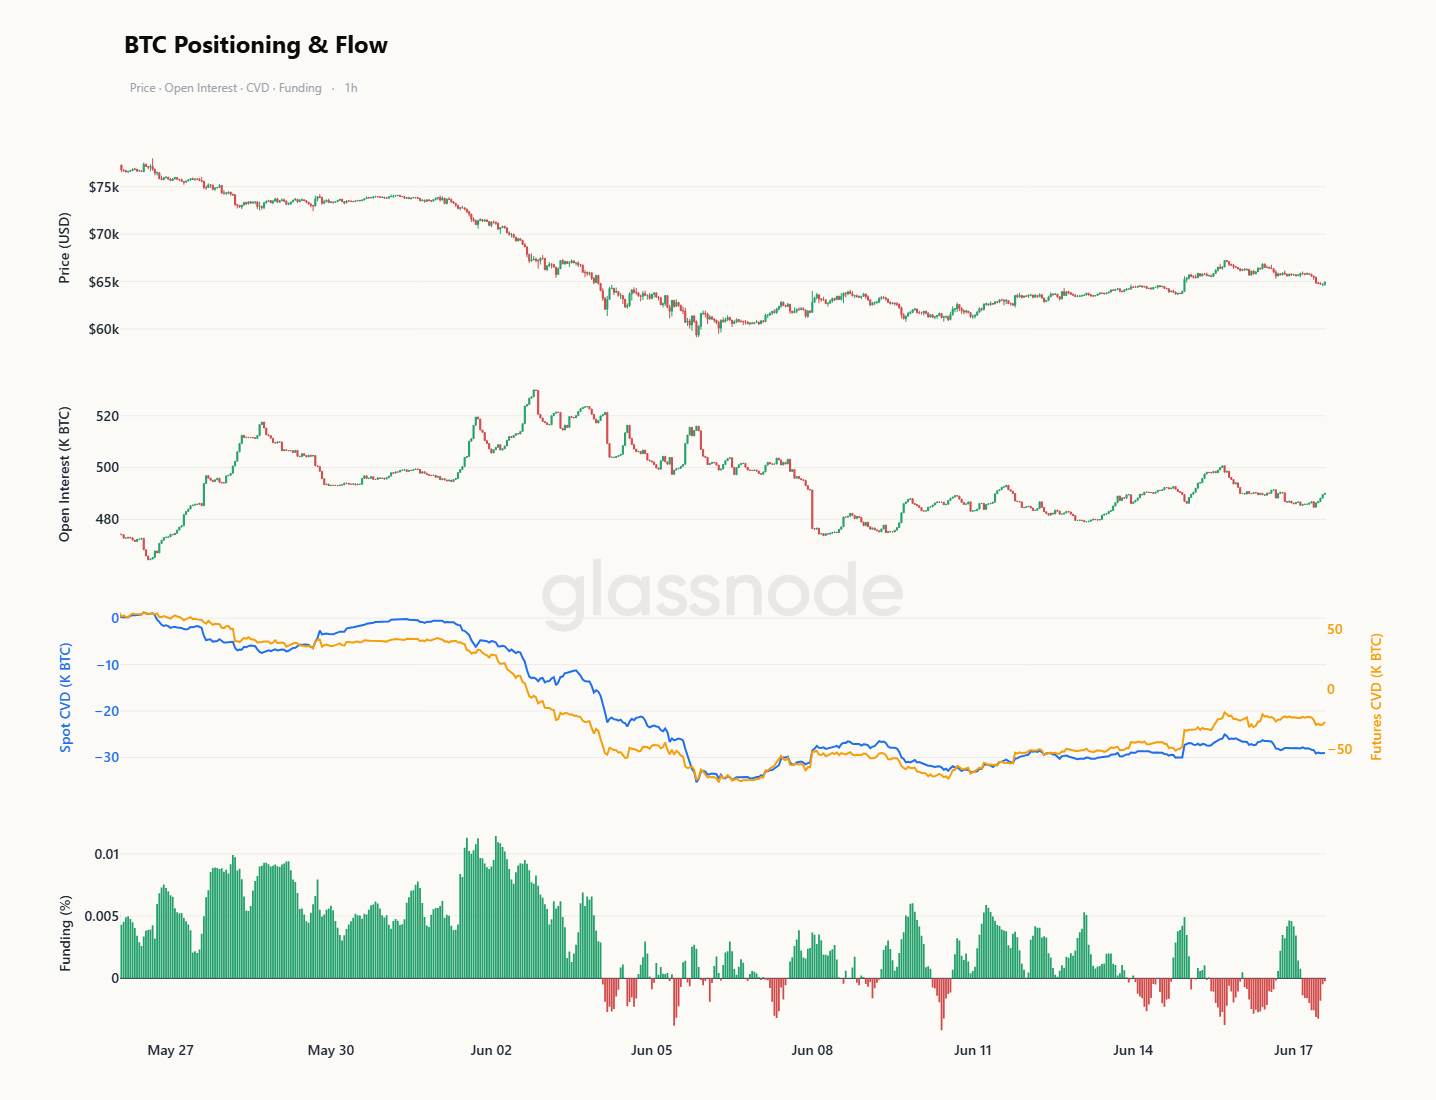
The open interest was at a recent high level at the end of May, providing financing for pushing local peaks higher. When prices broke downward at the beginning of June, both spot CVD and futures CVD turned negative simultaneously, indicating that real funds and leverage participants were jointly selling rather than a one-sided long liquidation. Subsequently, open interest significantly compressed from the peak, confirming genuine deleveraging. The funding rate retreated from clearly positive values to oscillate near zero, indicating neither crowded long premiums nor aggressive short preferences.
Since the washout, open interest has hardly recovered, so the slight rebound of futures CVD only reflects weak leverage demand. Spot CVD has not followed suit and remains in a flat to downward state. However, this is precisely the feature of the passive limit buy orders discussed earlier. Passive orders absorb supply below the spread; even if coins are sold, it causes the spot CVD to present downward trends, while continuously replenishing buy orders maintain this feature. This accumulation is quiet and lacks aggressiveness.
Only a sustained upward turn in spot CVD will indicate that real buyers are beginning to rush in rather than placing patient orders. If this signal aligns with the currently dismal futures signal moving upwards, it will form a constructive pattern of dual upward alignment in capital flows.
Implied Volatility Continues Normalizing
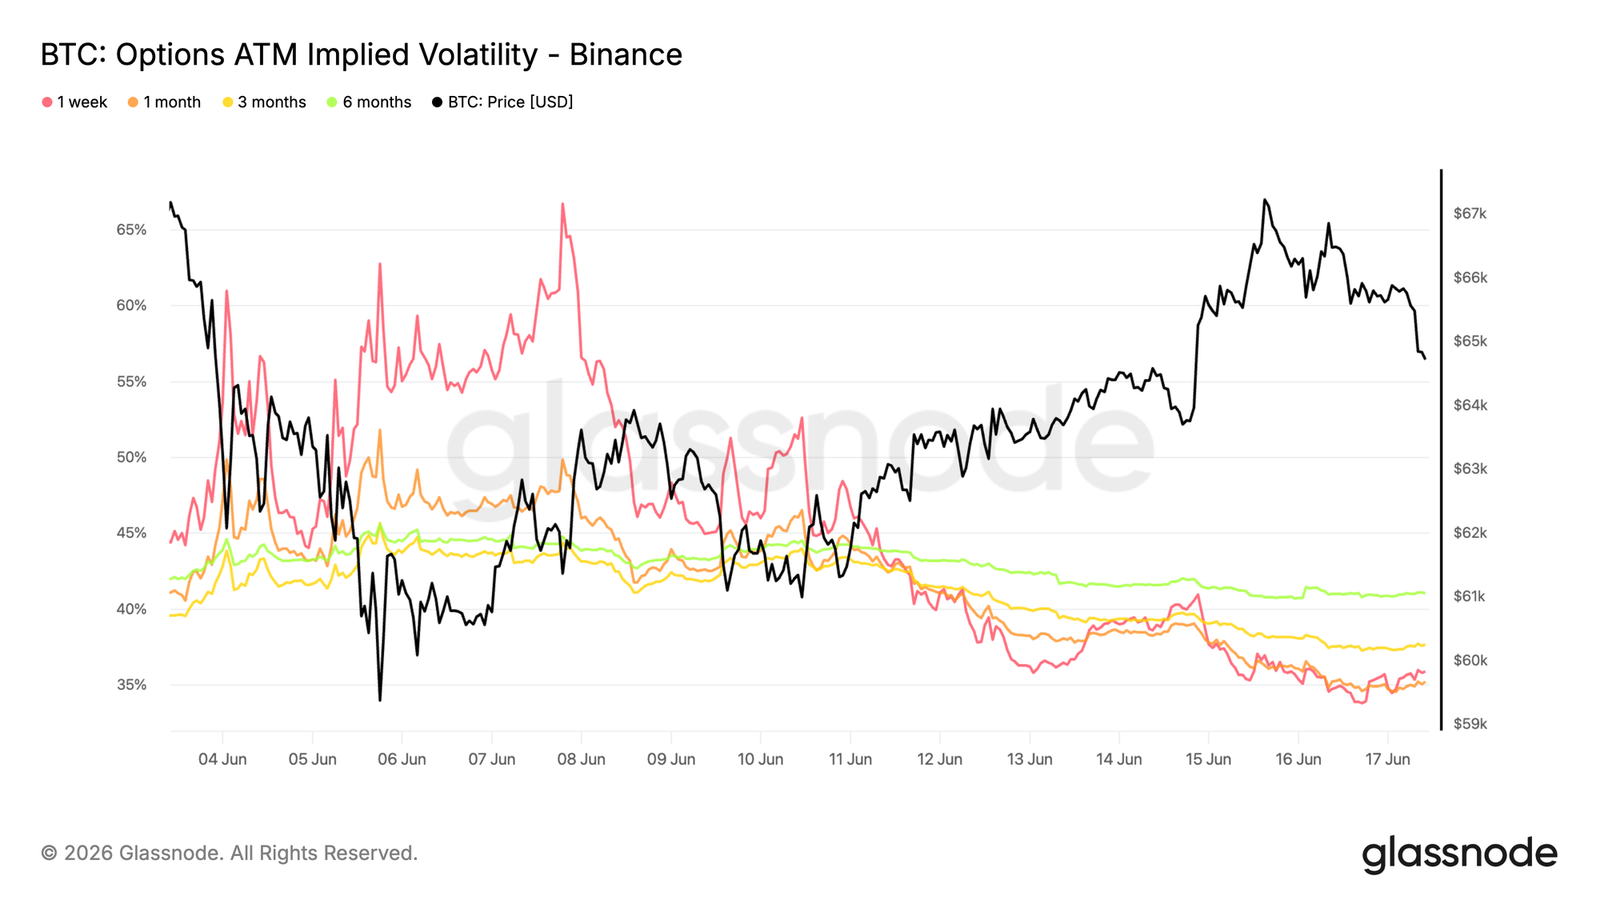
From the perspective of implied volatility, the violent repricing triggered by Bitcoin breaking below the multi-month range continues to dissipate as the spot stabilizes at $65,000 and rebounds from the June lows.
The adjustments at the front end have been the most dramatic. The one-week ATM implied volatility has fallen from peaks above 65% to around 35%, while the one-month term decreased from about 50% to 35%. Longer-term adjustments have been smaller, with the six-month term declining from about 44% to 41%.
This decline reflects the market's increasing adaptation to the current price environment. Despite Bitcoin rebounding from the June low of $59,000 to near $67,000, the demand for options has consistently declined across all terms, with traders unwinding the protective premiums built during the sell-off.
The volatility shock has largely been absorbed, and the options market is steadily removing the premiums from the recent pressure period pricing.
Volatility Risk Premium Turns Negative
With the normalization of implied volatility, the relationship between implied and realized volatility has changed significantly over the past week.
The one-month implied volatility has decreased from about 47% to 35%, while realized volatility continues to rise from about 27% to 42%. As a result, the volatility risk premium has compressed dramatically, moving from double-digit premiums at the beginning of June into the negative territory.
Charts indicate that the volatility premium established during selling pressure has been steadily unwound. As implied volatility normalizes, recent market volatility enters realized volatility, with the spread compressing and eventually turning negative.
Currently, realized volatility exceeds implied volatility, completely reversing the situation from early June.
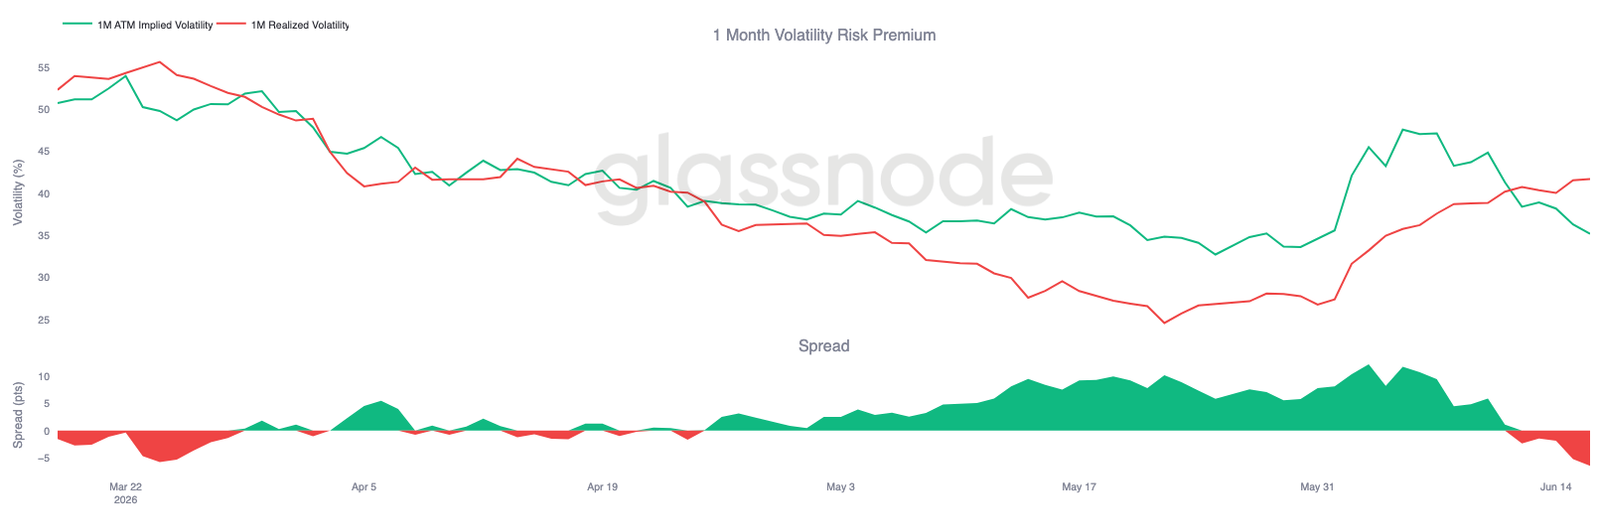
A negative volatility risk premium indicates that the options market currently anticipates a calmer environment than what recent price actions imply.
25 Delta Skew Normalizing After Protection Surge
As the volatility risk premium reverses, skew shows us how directional protection demand has evolved since the selling pressure.
Skew is calculated as the difference between put volatility and call volatility, with positive values indicating that put options have a premium over equivalent call options. Earlier this month, downside protection became significantly more expensive, with one-week skew briefly approaching 30% and one-month terms rising above 24%, as traders rushed to hedge against the downside trend towards the June lows.
This demand has now eased. One-week skew has retreated to around 13%, with one-month terms dropping to about 14%. Longer terms have also normalized, with three-month and six-month terms currently around 13% and 11%, respectively.
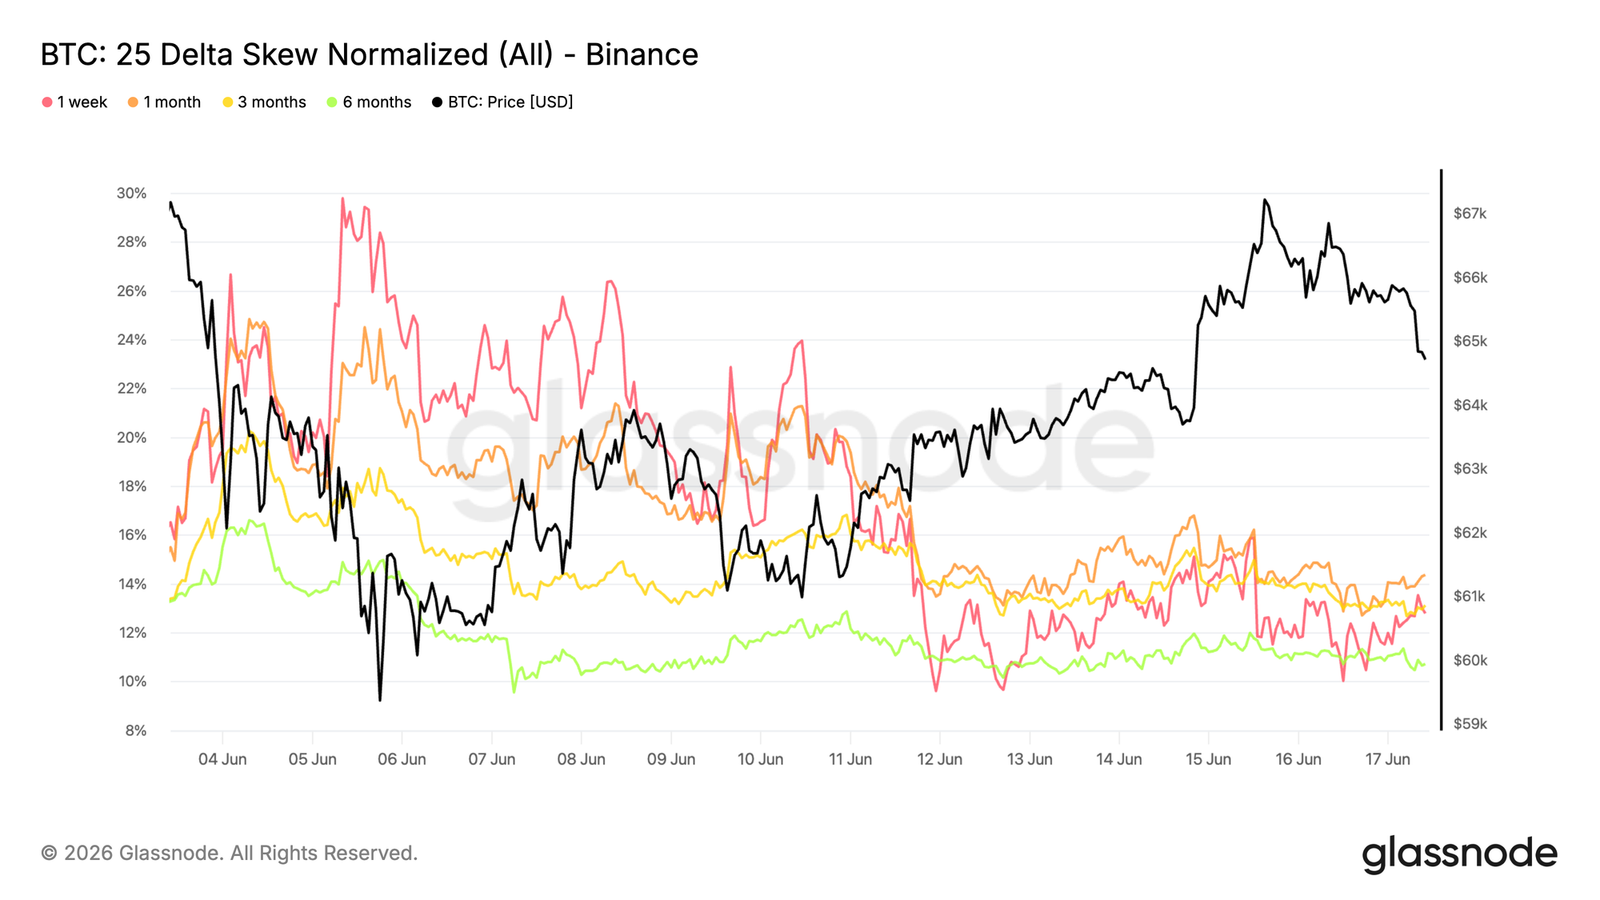
Protection demand remains above pre-selling pressure levels, but as market conditions stabilize, the acute rush for downside hedges has largely dissipated.
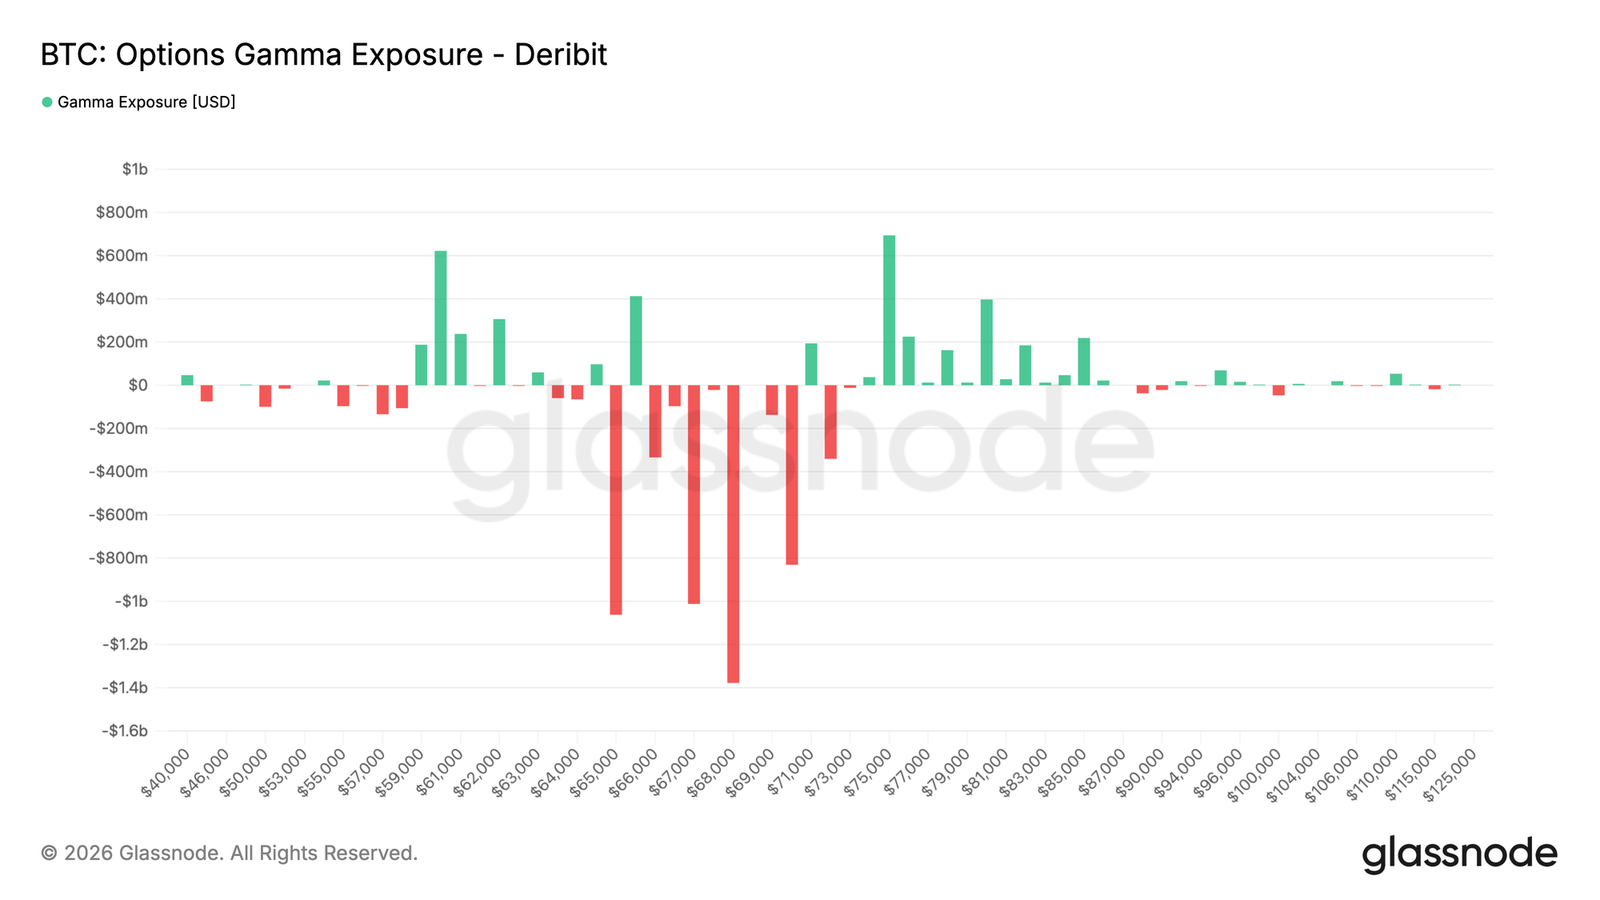
Gamma Exposure Concentrated Above Current Spot
Apart from pricing and sentiment, gamma exposure helps identify the strike price levels where market makers' hedges are likely to have the most significant impact on market dynamics.
Recent options flow is tending towards balance. Over the past seven days, put buying has taken the largest share of trading premium (28.1%), followed closely by call buying (24.1%). In the past 24 hours, call buying has slightly surpassed put buying.
This evolution is reflected in the gamma distribution. The largest negative gamma cluster is currently at $68,000, with another short gamma exposure extending from $66,000 to $71,000. Bitcoin is currently trading near $65,000, with spot still slightly below the main short gamma concentration zone. Positive gamma exposure is significantly above the current price, in the high $70,000 range, indicating that Bitcoin remains far from the nearest stable market maker position area.
As protection demand normalizes, market makers' positions remain concentrated above the current spot, with the largest negative gamma area centered around $68,000.
Conclusion
Bitcoin remains in a corrective phase, but market characteristics are beginning to shift. While profit conditions are deteriorating, realized losses are accelerating, and recent buyers are under pressure, multiple indicators suggest that the market is transitioning from forced selling to stability.
Liquidity conditions are improving, the spot order book is being rebuilt, and passive buyers are becoming increasingly active. Meanwhile, ETF holders continue to display relatively strong confidence, extending their holding periods rather than aggressively reducing positions. The options market remains cautious, with continued demand for downside protection, but volatility expectations have retreated from recent extreme levels.
The result is a market that is still fragile but increasingly supported by patient capital. Whether Bitcoin can establish a durable bottom near current price levels likely depends on improved liquidity and selective accumulation being able to outweigh persistent profit weakness and broader risk sentiment.
免责声明:本文章仅代表作者个人观点,不代表本平台的立场和观点。本文章仅供信息分享,不构成对任何人的任何投资建议。用户与作者之间的任何争议,与本平台无关。如网页中刊载的文章或图片涉及侵权,请提供相关的权利证明和身份证明发送邮件到support@aicoin.com,本平台相关工作人员将会进行核查。


