Author: Cointelegraph
Translation: Shenchao TechFlow
Guide by Shenchao: Bitcoin has rebounded 13% from below $60,000, returning to the $67,000 range. Multiple technical patterns point towards a recovery market at $100,000: a double bottom on the three-day chart and a bottom divergence on the weekly RSI. However, there’s a short-term risk — the bearish continuation flag hasn’t broken, and the volume of whales transferring coins to exchanges has surged nearly threefold. This article dissects the key price levels supporting this bullish scenario and which signal, if lost, would rewrite the story.
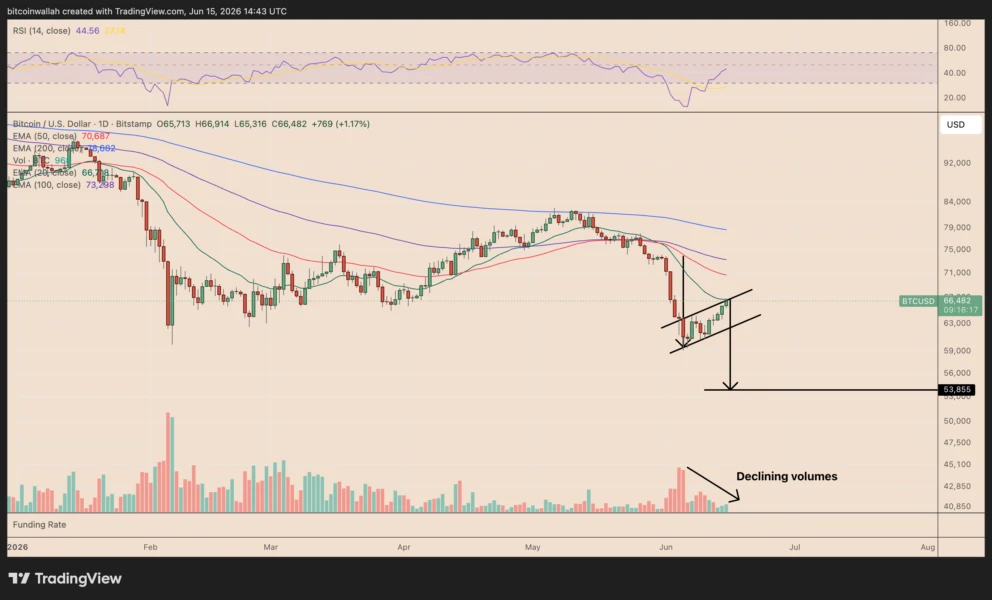
The technical analysis of Bitcoin's chart signals that BTC returning to $100,000 could happen before September.
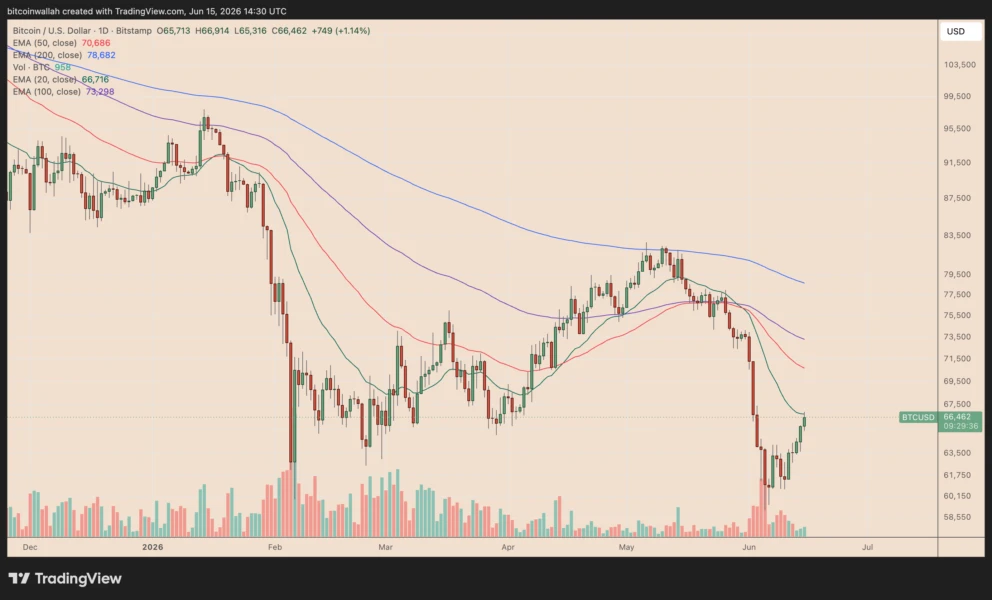
Caption:BTCUSD daily chart. Source: TradingView
Core Points:
- Bitcoin is emerging from a potential double bottom with a bullish divergence.
- BTC must break through the dense resistance area near $66,700.
Double Bottom Pattern Suggests 60% Upside Potential
BTC has rebounded 13.25% from a local low below $60,000. The catalyst was a preliminary ceasefire between the U.S. and Iran, reigniting global market risk appetite.
This recovery pushed BTC back to around $67,000 on June 15. It's supported by an overall breath of fresh air for risk assets — easing geopolitical tensions have lowered oil prices, and market concerns over short-term inflation have receded.
Now, on the three-day chart, Bitcoin is showing a potential double bottom reversal near the $60,000 support area.
This is the second time BTC has bounced off the $60,000 area in 2026. The same demand zone has held up during previous pullbacks, with buying pressure protecting it twice, strengthening the logic of the double bottom.
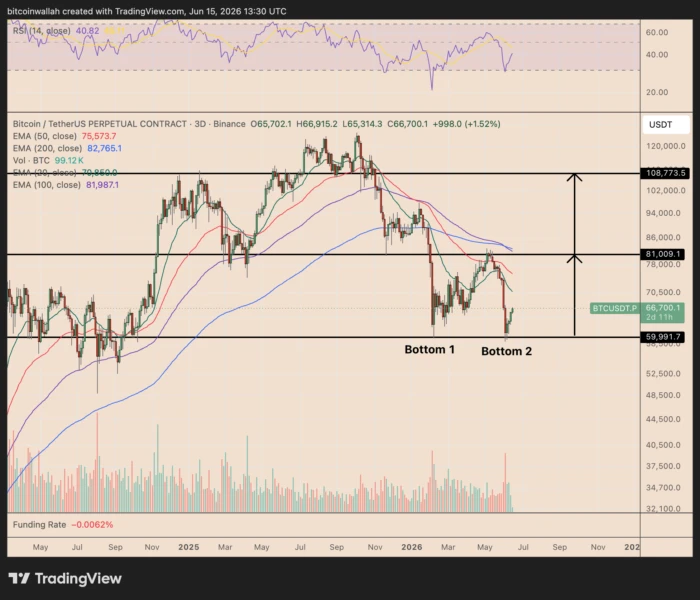
Caption:BTCUSDT three-day price chart
The first bottom appeared near the March low, while the recent bottom formed after a sharp drop in June, which briefly drove Bitcoin back down to the same position. As long as BTC holds the $60,000 support, the double bottom structure remains alive.
The neck line of this pattern is around $81,000, where Bitcoin previously paused before starting the recent decline.
If it can close above this level with significant volume, the double bottom would be confirmed, opening up the measured upside target towards $108,000, with a time window in August or September, offering more than a 60% increase relative to the current price level.
Bitcoin Weekly RSI Divergence Reinforces the $100,000 Scenario
The weekly chart of Bitcoin shows a bullish divergence between price and the Relative Strength Index (RSI, a momentum indicator).
Recently, BTC made a lower low in the support zone of $60,000 to $65,000, but its weekly RSI made a higher low. This indicates that while sellers pushed prices down, they exerted less force.
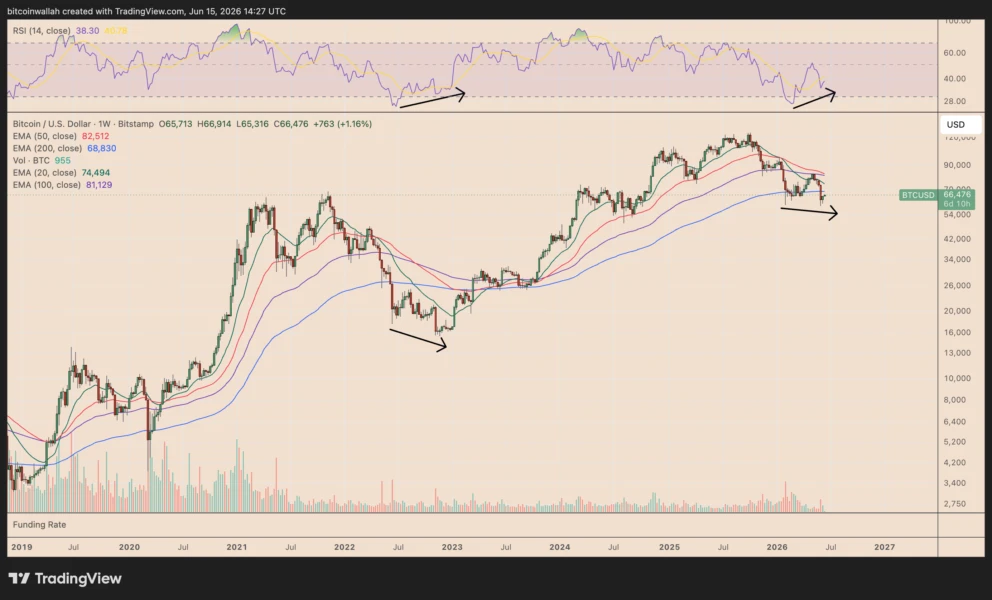
Caption:BTCUSD weekly chart
Similar divergences occurred near the bottom of the 2022 bear market — at that time, the RSI rebounded first, followed by a price increase, leading to a rally that lasted for months.
Analyst Jelle mentioned in a post on Monday that Bitcoin's movements in the coming months might "look very similar to late 2022."
This structure further strengthens the logic of the double bottom near $60,000. However, BTC still needs confirmation signals, with the first major resistances at the 20-week EMA of $74,500 and the 50-week EMA of $82,500.
Recovering these two positions would heighten the likelihood of the summer recovery trend moving towards $100,000. Conversely, if the weekly closes below $60,000, the bullish structure would be weakened.
Bitcoin's Bear Flag Remains a Risk Point
The short-term chart of Bitcoin still leaves room for another dip, after which a larger bullish reversal structure would be confirmed.
BTC is testing a dense resistance area, formed by the upper trend line of the bear flag and the 20-day EMA (green line), located around $66,700.
If it is pushed back in this zone, the price may drop again towards the lower trend line of the flag at $63,600, keeping Bitcoin trapped in this bearish continuation structure.
Caption:BTCUSD daily price chart
If the daily closes below the lower trend line with volume, the bear flag would be confirmed. Based on the height of the previous drop, the measured downside target would be $53,850, approximately 20% lower than the current price level.
The volume has been decreasing throughout the formation of the flag, increasing the probability of this move. Weak participation often indicates that this rebound is merely corrective and not a main upward wave.
Bitcoin Whales Increasing Deposits Heighten Downward Pressure
The short-term bearish structure aligns with the significant increase in selling actions by whales.
CryptoQuant analyst Darkfrost noted that after the recent pullback, the volume of BTC being transferred to Binance by whales has surged. Over the past month, large holders have averaged transferring 3,200 BTC to exchanges daily, up from only 1,200 BTC at the end of April.
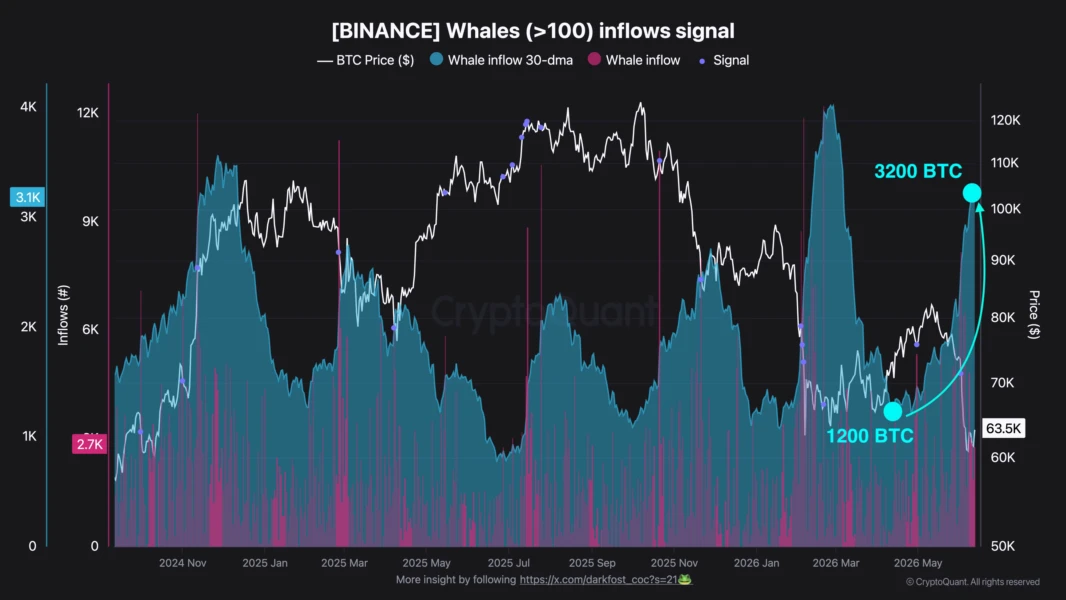
Caption: The amount of funds transferred to Binance by whales holding over 100,000 BTC
Source: CryptoQuant / Darkfrost
Core Data: The amount transferred to exchanges daily by large holders increased from 1,200 BTC at the end of April to nearly 3,200 BTC in the past month, an increase of about 167%
He wrote in a report on Monday: “This trend indicates that a number of large holders have intensified their selling actions during the recent decline, or at least are more willing to sell.”
免责声明:本文章仅代表作者个人观点,不代表本平台的立场和观点。本文章仅供信息分享,不构成对任何人的任何投资建议。用户与作者之间的任何争议,与本平台无关。如网页中刊载的文章或图片涉及侵权,请提供相关的权利证明和身份证明发送邮件到support@aicoin.com,本平台相关工作人员将会进行核查。


