After weeks of intense selling pressure, XRP is finally beginning to show signs of life.
The asset experienced a severe correction that drove it toward the $1.10 region after breaking below the 50-day exponential moving average (EMA) and losing the crucial $1.32 support zone. But since the start of the decline, XRP has made its strongest attempt to recover.
XRP pushed down
Following a capitulation-like selloff that momentarily drove XRP to local lows close to $1.08, there has been a recent surge. Buyers intervened swiftly, causing a sequence of higher lows and driving the asset back toward the $1.20 area. Even though the move is still small in comparison to earlier rallies, it is the first significant bullish reaction since XRP lost control of its short-term trend structure.
HOT Stories 'Never as Bad as It Seems': Coinbase CEO Remains Bullish on Bitcoin Shiba Inu (SHIB) on Verge of Shattering 3 Resistances, Will Cardano (ADA) Find Recovery Ground? XRP's Volatility Dangerously Close to Zero: Crypto Market Review
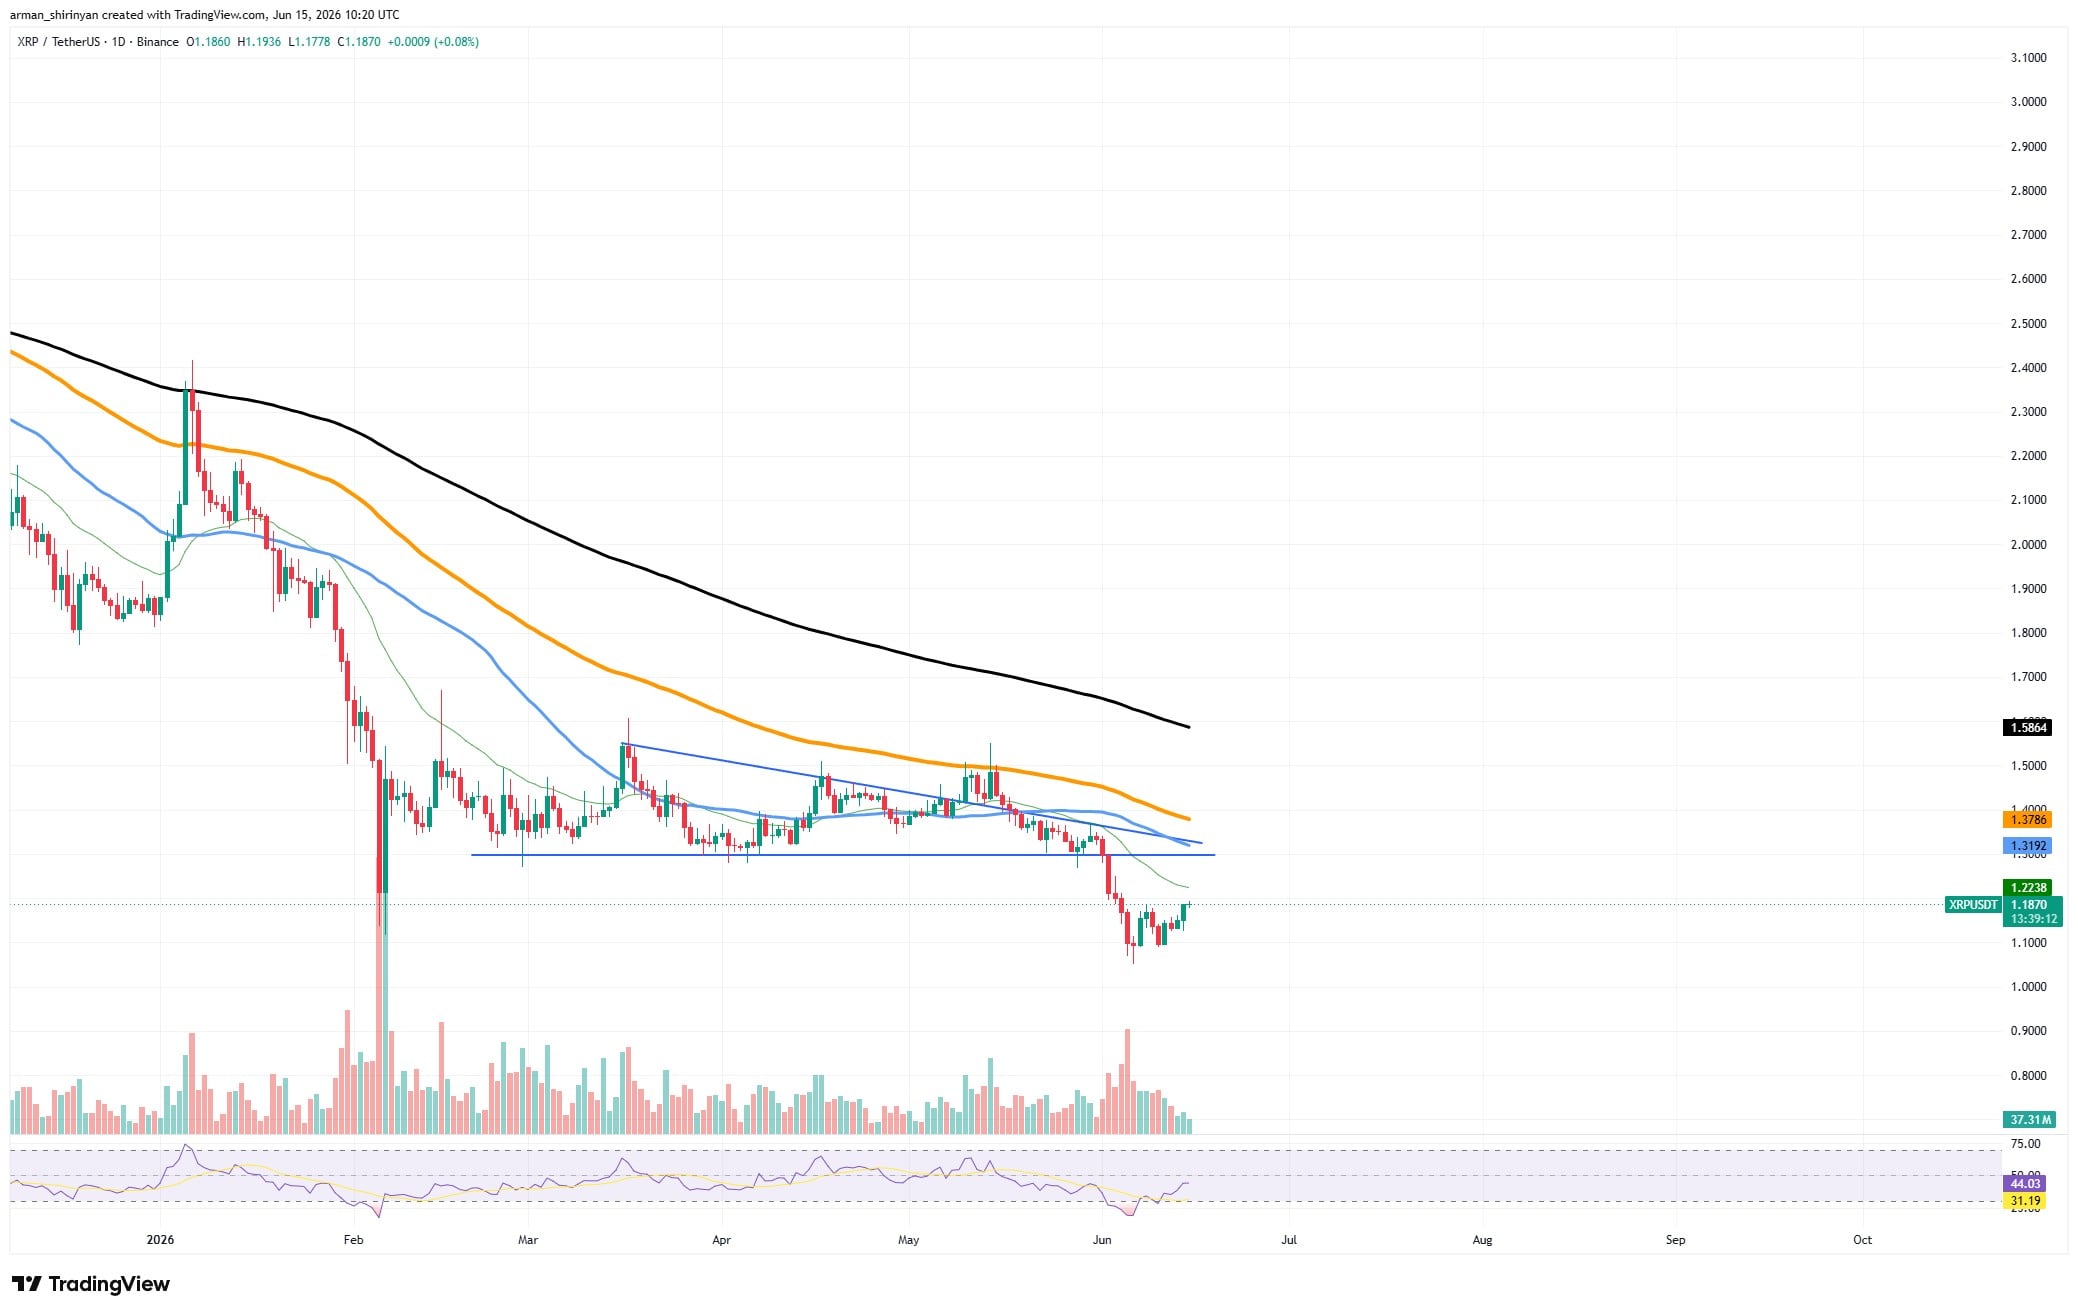
XRP/USDT Chart by TradingView
The notion that selling pressure may be lessening is supported by technical indicators. The Relative Strength Index has made a strong comeback from oversold territory and returned to neutral levels. In the past, when RSI recovers from extremely oversold conditions, especially following large-scale liquidation events, XRP typically sees relief rallies.
The fact that the move occurs during a period of comparatively robust XRP Ledger activity adds to its intrigue. According to on-chain data, transaction volume remained significantly higher than levels usually associated with network inactivity, while payment counts remained high throughout the correction.
Activity is bound to recover
The drop in network usage has been far less severe than the price decline, despite the fact that both metrics have cooled over the past few days. This divergence implies that despite negative market sentiment, underlying XRP Ledger activity is still present.
You Might Also Like

Sat, 06/13/2026 - 15:33 XRP Extends ETF Dominance to Week 5: How Long Till Bitcoin Picks up Pace?ByCaroline Amosun
Technically speaking, XRP will face its next obstacle at the previous support area around $1.22-$1.23. This region now serves as immediate resistance and aligns with the cluster of the short-term moving average. A successful break above it would greatly enhance the structure of the market and pave the way for a move toward $1.32, the location of the initial more significant breakdown.
The general trend remains pessimistic. XRP is still trading below the 50-, 100-, and 200-day moving averages, all of which are still pointing lower. But since the asset dropped below the 50 EMA, the current rebound is the most robust bullish response it has generated.
The ability of XRP to recover important resistance levels in the upcoming sessions will determine whether this turns into a long-term recovery or just a brief relief rally. However, buyers seem prepared to push back for the first time in weeks.
免责声明:本文章仅代表作者个人观点,不代表本平台的立场和观点。本文章仅供信息分享,不构成对任何人的任何投资建议。用户与作者之间的任何争议,与本平台无关。如网页中刊载的文章或图片涉及侵权,请提供相关的权利证明和身份证明发送邮件到support@aicoin.com,本平台相关工作人员将会进行核查。


