
Before the 2026 World Cup starts, two authoritative systems have given their own "championship probabilities"—and their number one differs.
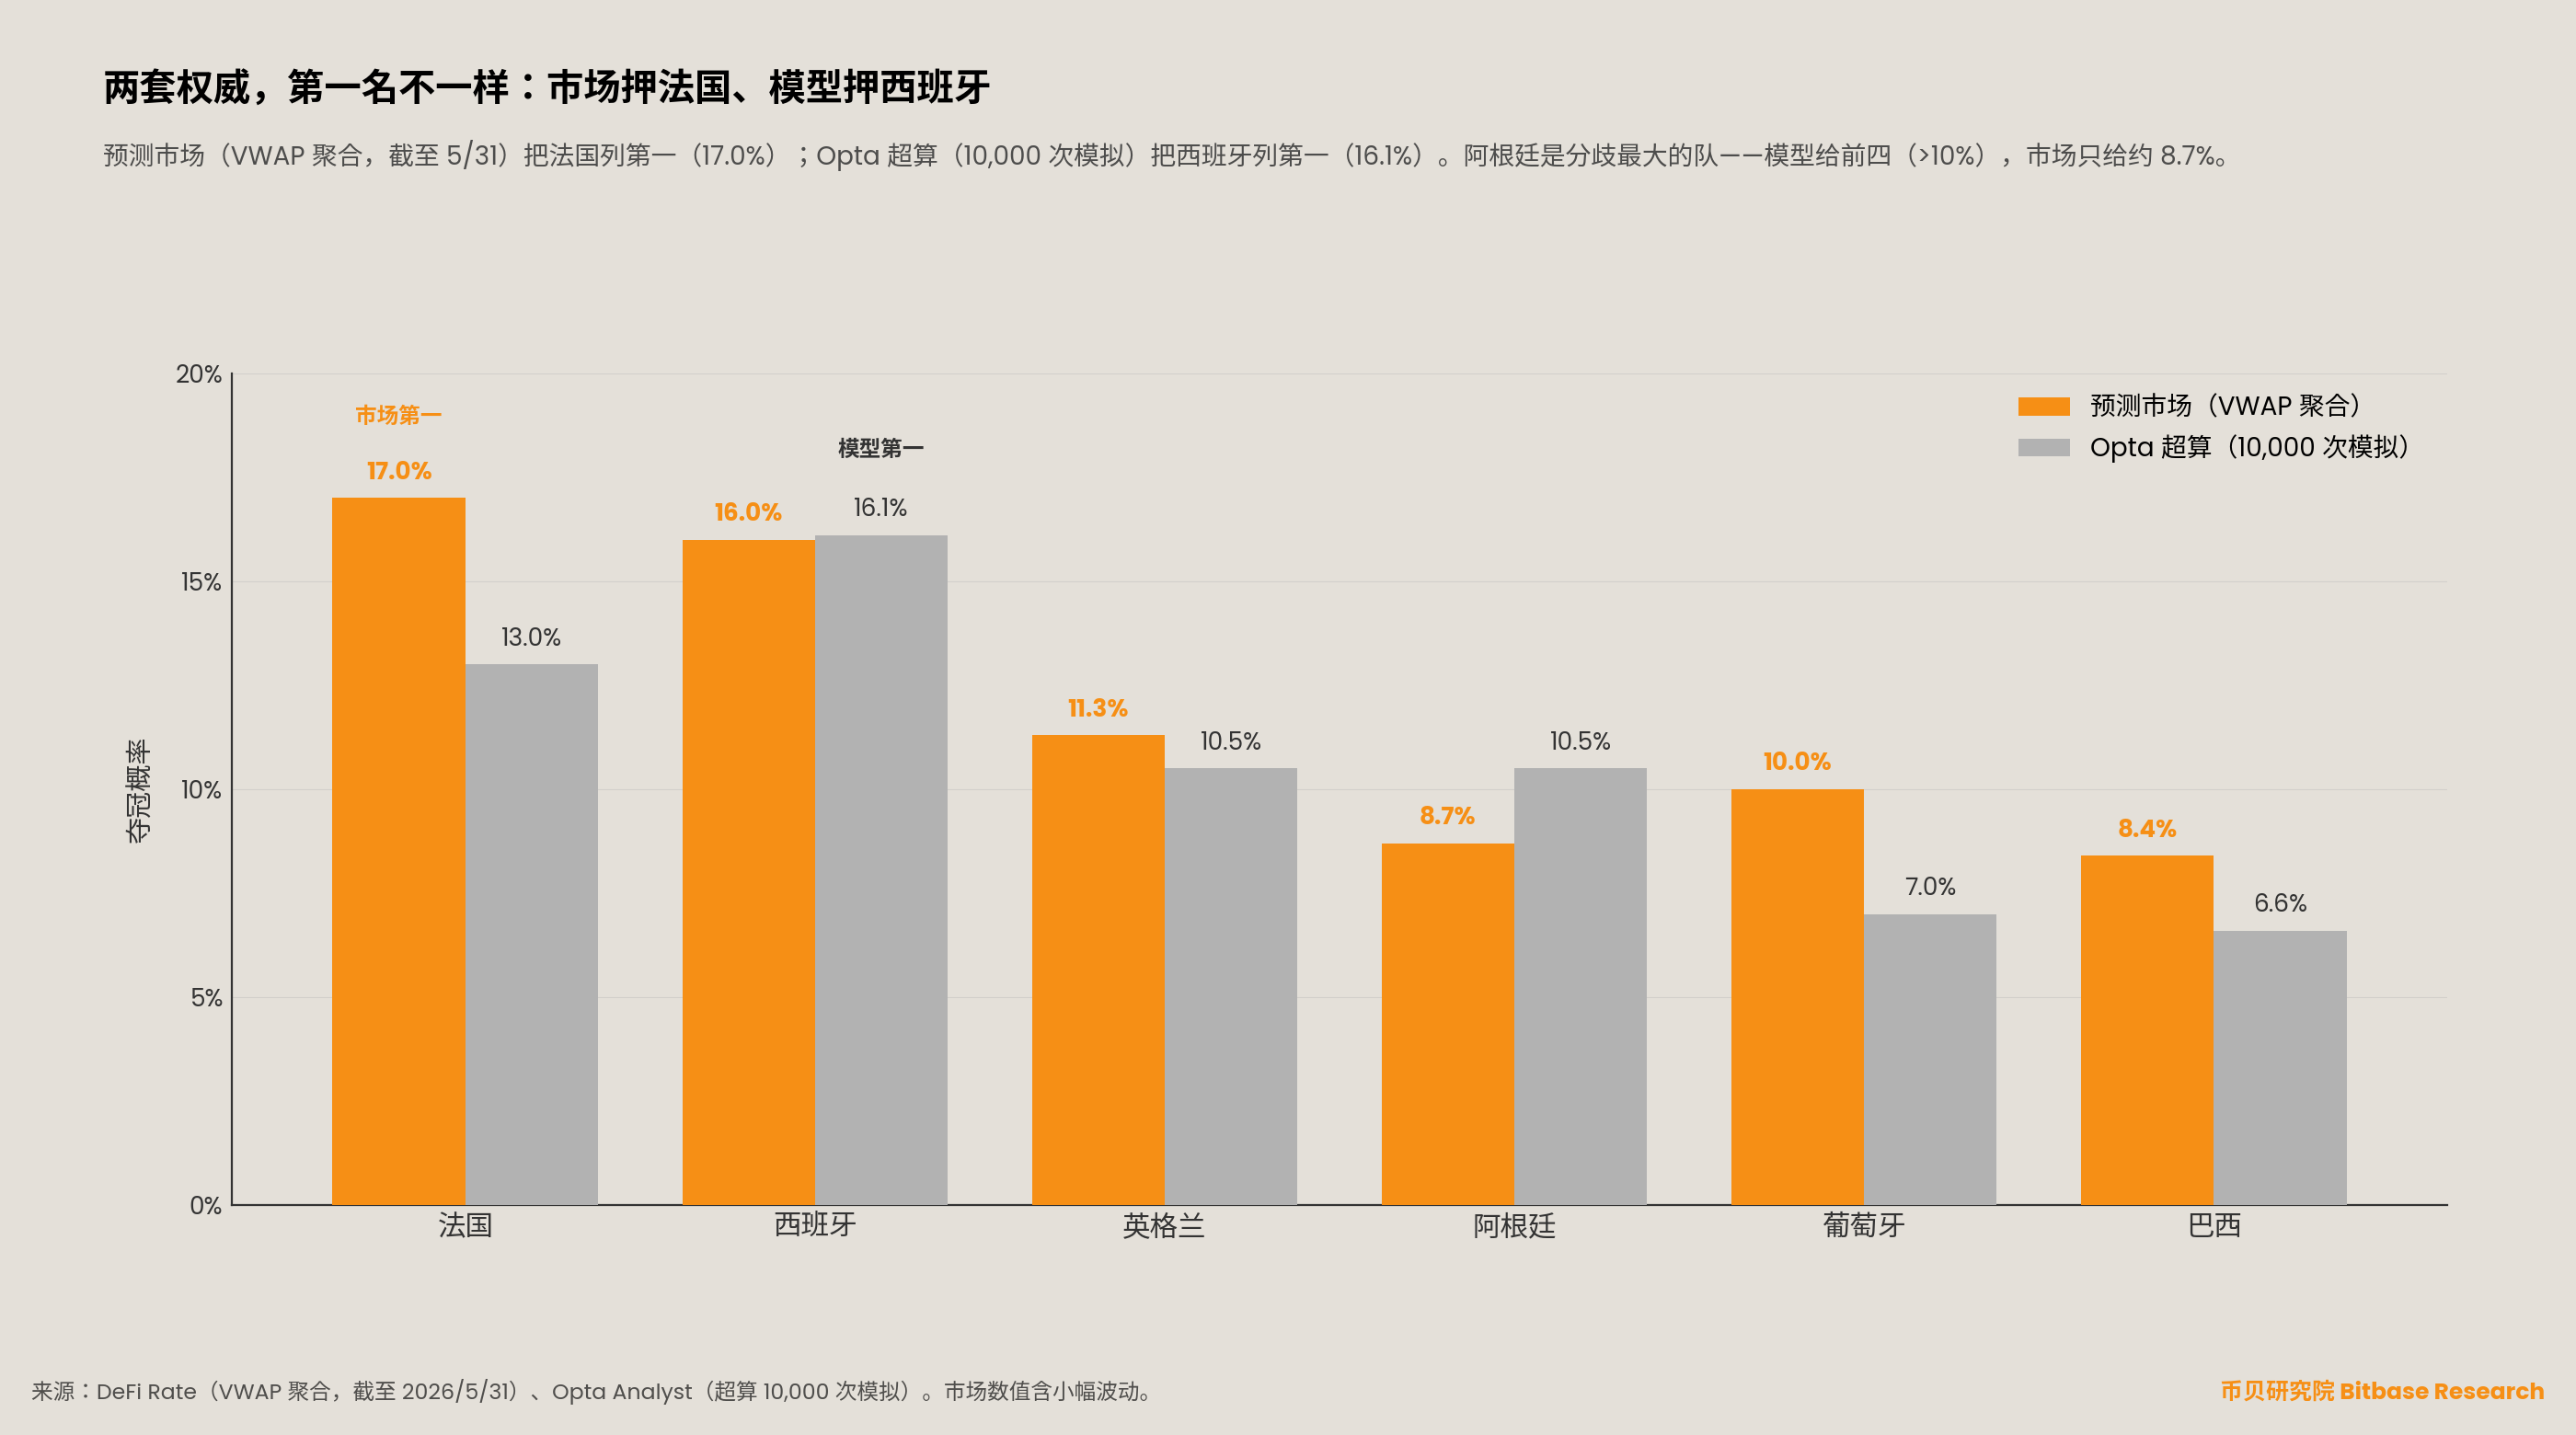
The prediction market (price aggregation from Polymarket and Kalshi) lists France as the top favorite at about 17%. The Opta supercomputer lists the European Championship winner Spain as the top favorite at 16.1%.
These two numbers appear to be "probabilities." However, their production methods are entirely different—one is a price cleared in the market with a trading volume of hundreds of millions of dollars, and the other is the frequency obtained by simulating the entire World Cup ten thousand times with a supercomputer.
This article does not predict who will win, nor does it evaluate which system is more accurate; it simply answers one question: when you see the number "France 17%", where does it come from, and how trustworthy is it?
This is the next layer of EP06—last time we discussed how the market structure of prediction markets differs from traditional betting, while this article explains how the probability in the price is calculated. The data is as of May 31, 2026.
Act One · Probability in Prices: How the Market Produces Probability
The mechanism of prediction markets is very clear: each result's contract price ranges from 0 to 100 cents, the price is directly interpreted as implied probability. France's contract quote is 17 cents, meaning the market believes France has about a 17% chance of winning—the winners receive $1 per contract, and the losers get $0.
But prices from a single platform can have noise. Aggregators (like DeFi Rate) use Volume Weighted Average Price (VWAP) to aggregate quotes from various places like Kalshi, Polymarket, Polymarket US, Gemini, etc., to get a cross-platform implied probability. As of May 30, 2026, approximately $523 million in World Cup championship contracts have been traded, with the settlement date set for July 20, 2026—one day after the final on July 19.
This price does not come from nowhere. It results from market makers continuously quoting bid and ask prices + traders constantly transacting. Notably, the liquidity provided to prediction markets is all from crypto-native institutional trading firms: Wintermute (annual trading volume over $3.5 trillion, covering more than 70 exchanges) began providing bilateral quotes for Polymarket and Kalshi in 2026; Jump Trading and Susquehanna are also actively providing market making.
Jake Ostrovskis, head of OTC trading at Wintermute, summed up the current state of this market in a single sentence:
"Prediction markets have the demand profile of a major asset class but the liquidity profile of an early-stage one."
Prediction markets have the demand scale of a major asset class but only the liquidity depth of an early-stage one. In other words— the credibility of the "probability" in the price depends on how much real liquidity is supporting it. We will return to this point in Act Three.
Act Two · Probability in Simulation: How Models Produce Probability
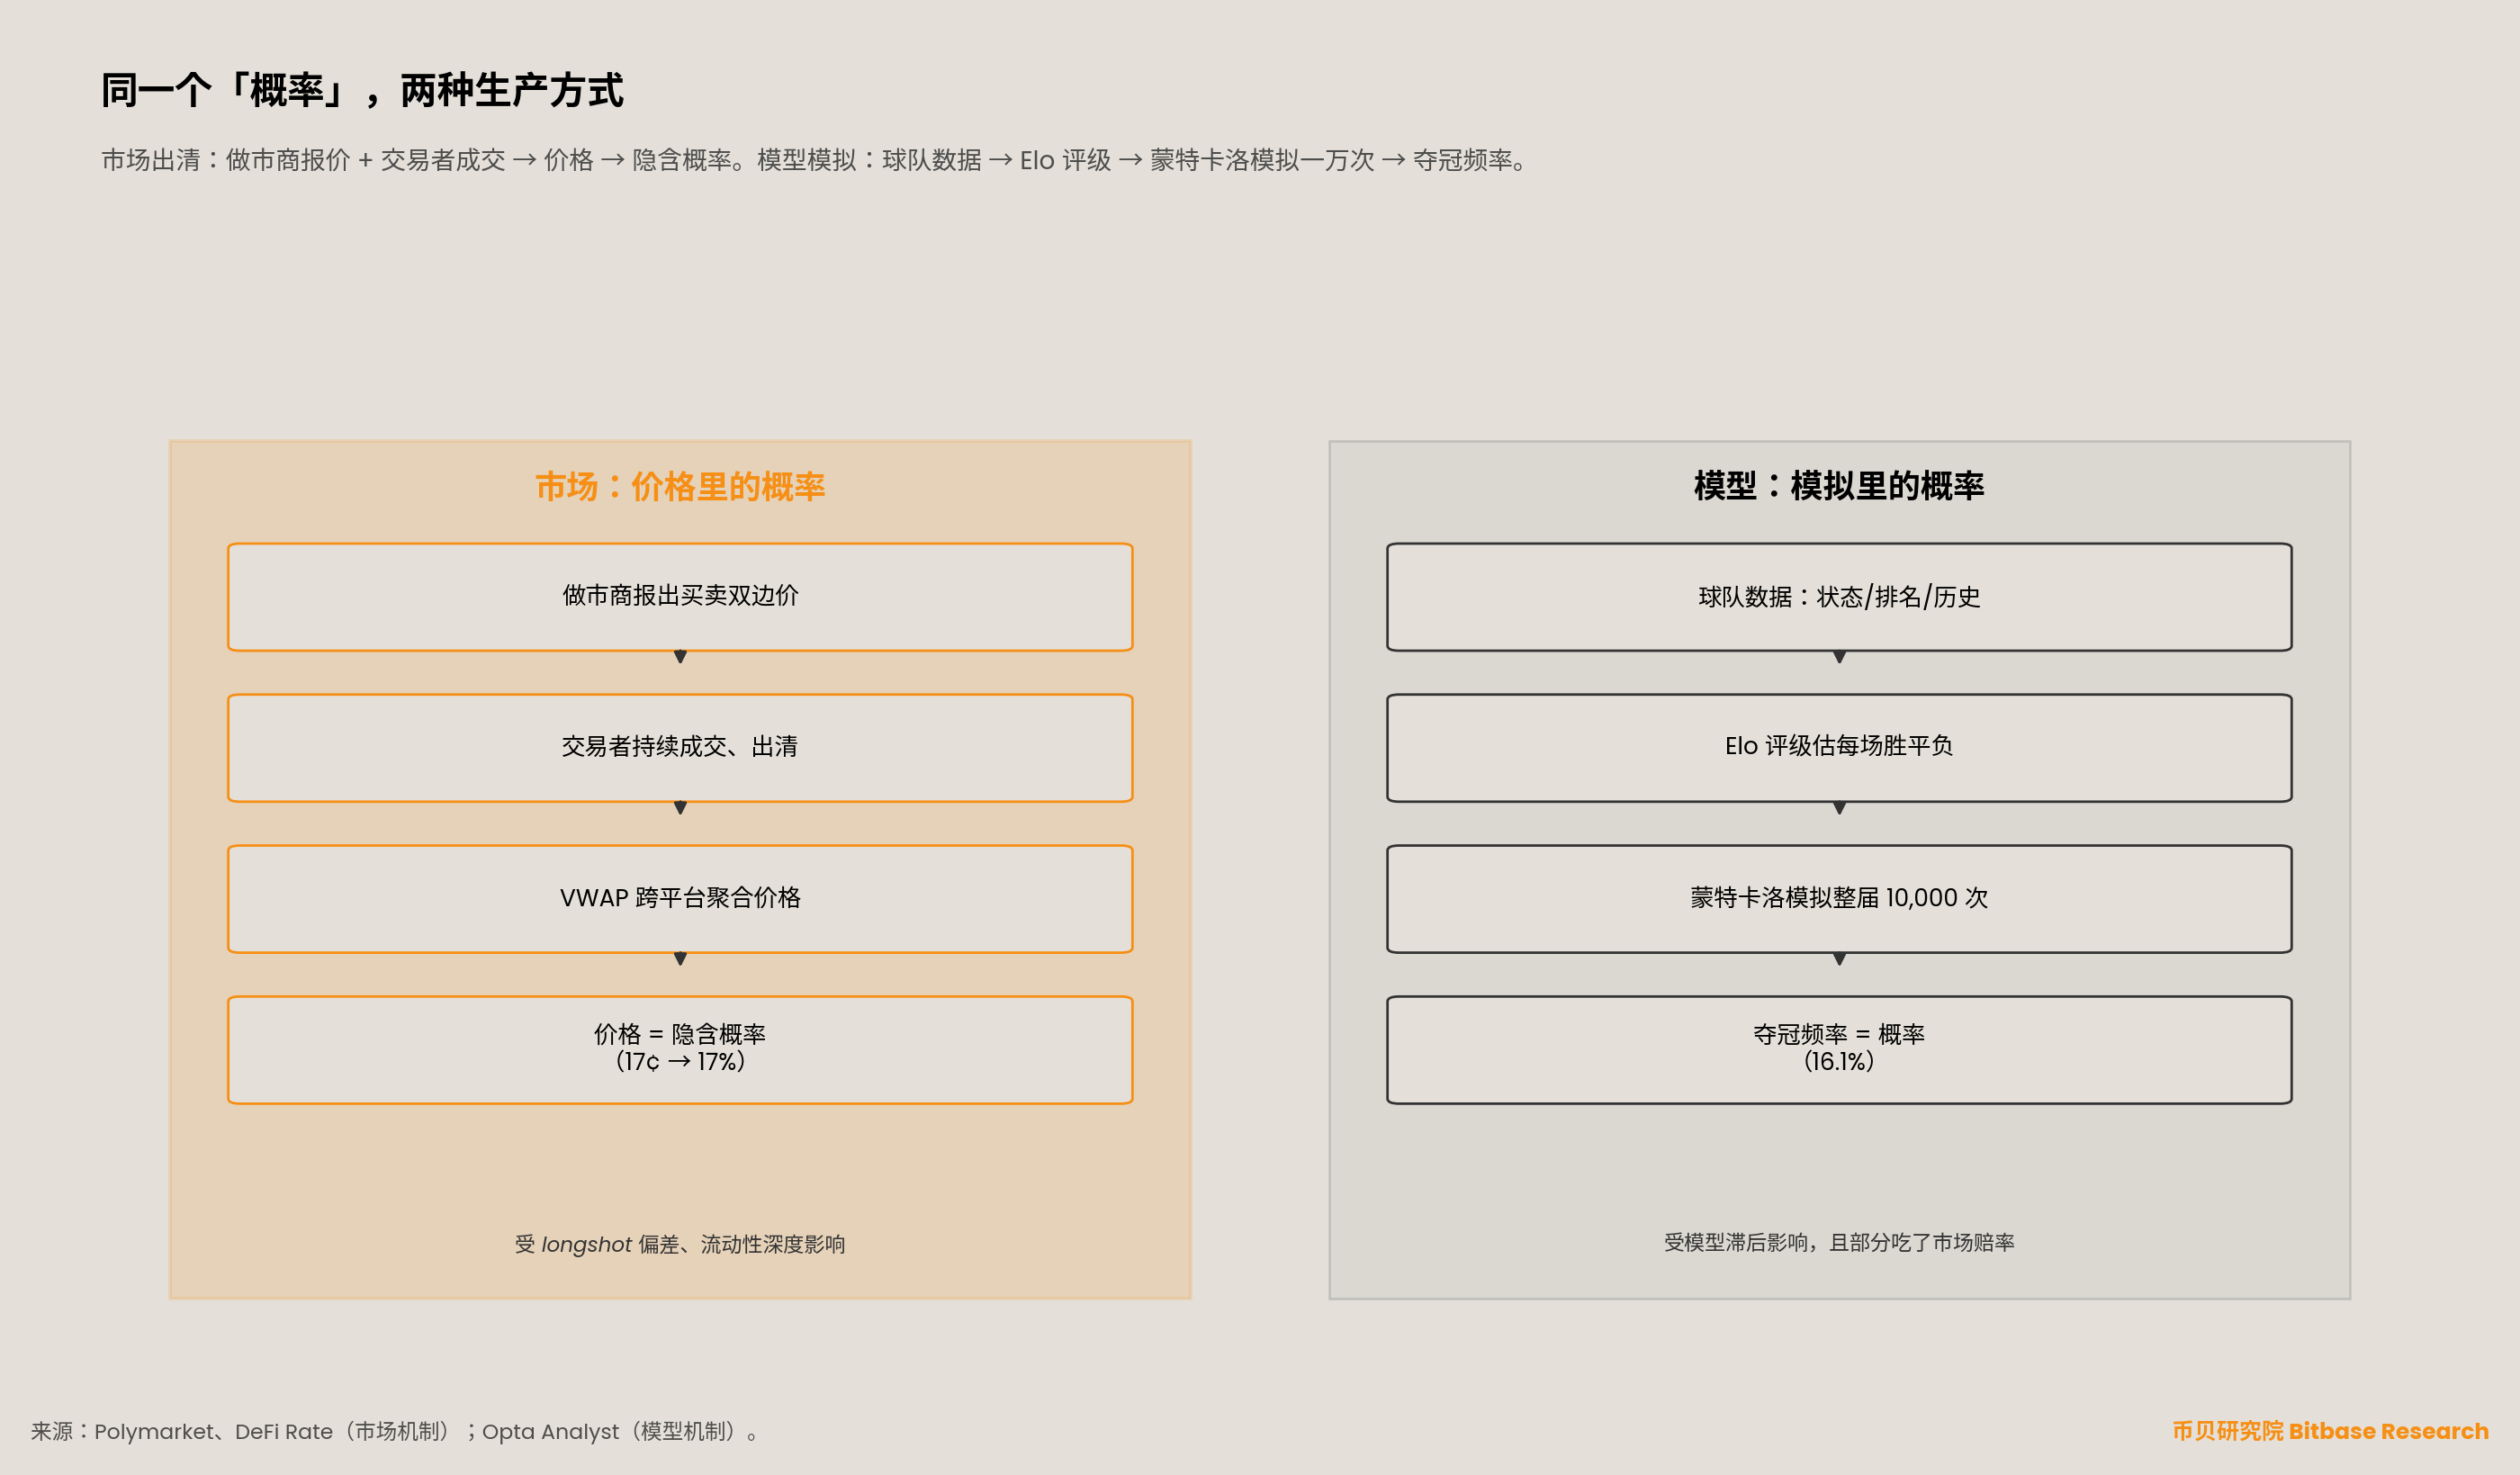
The Opta supercomputer takes a different path. It first estimates the probabilities of win, draw, and loss for each match using team data—performance, historical records, world rankings, and recent international performance—through Power Rankings (a rating algorithm derived from Elo), then simulates the entire World Cup 10,000 times, counting how many times each team wins in the simulations; that frequency is its "championship probability."
The results for 2026 (only factual statements, not predictions of match results): Spain 16.1% (also the only team with more than 50% probability of reaching the quarter-finals, 52.1%), France 13.0%, England over 10%, defending champion Argentina fourth also over 10%, Portugal 7.0%, Brazil 6.6%.
There is an anti-intuitive methodological detail worth noting: one of the inputs for the Opta model is the odds from the betting market. In other words, the comparison between "market vs. model" is not two completely independent systems— the model has partially "absorbed" information from the market. When you compare market prices with Opta probabilities, the differences you see are smaller than "discrepancies from two independent sources."
A note on timeliness: Many people remember the authoritative FiveThirtyEight soccer model (SPI), which has stopped updating since founder Nate Silver left in 2023; the original website closed in September 2023, and the entire 538 was shut down by ABC in March 2025. This article only considers it as historical methodology and comparative historical data from the 2018 and 2022 tournaments, rather than a current prediction source for 2026.
Act Three · Which is More Accurate? An Honest Blank
Which is more accurate, the market or the model?
The honest answer is: no rigorous cross-tournament academic research has directly compared the prediction markets and Opta/538's Brier scores (a standard measure of prediction accuracy) in the 2018 and 2022 World Cups. The "90% accuracy" numbers that the platforms themselves promote often come from the platforms themselves or non-peer-reviewed blogs and cannot be treated as independent conclusions. This article explicitly states this blank and does not fabricate an answer.
However, there is a commonly misquoted case that deserves correction. Many people say, "Argentina winning in 2022 was a big upset"— this is not accurate. Before the tournament, Argentina was the second or third favorite: Opta gave them 13.1% (second), and betting set +500 odds (around 16.7%, second). The real story is not "an upset victory" but rather—almost all mainstream models and markets bet on Brazil, yet the second favorite Argentina won; and the only outlier that placed Argentina at about 8% was precisely FiveThirtyEight. This is more precise than "an upset victory" and highlights an important problem: the so-called "authoritative probability" can differ by as much as double between different sources.
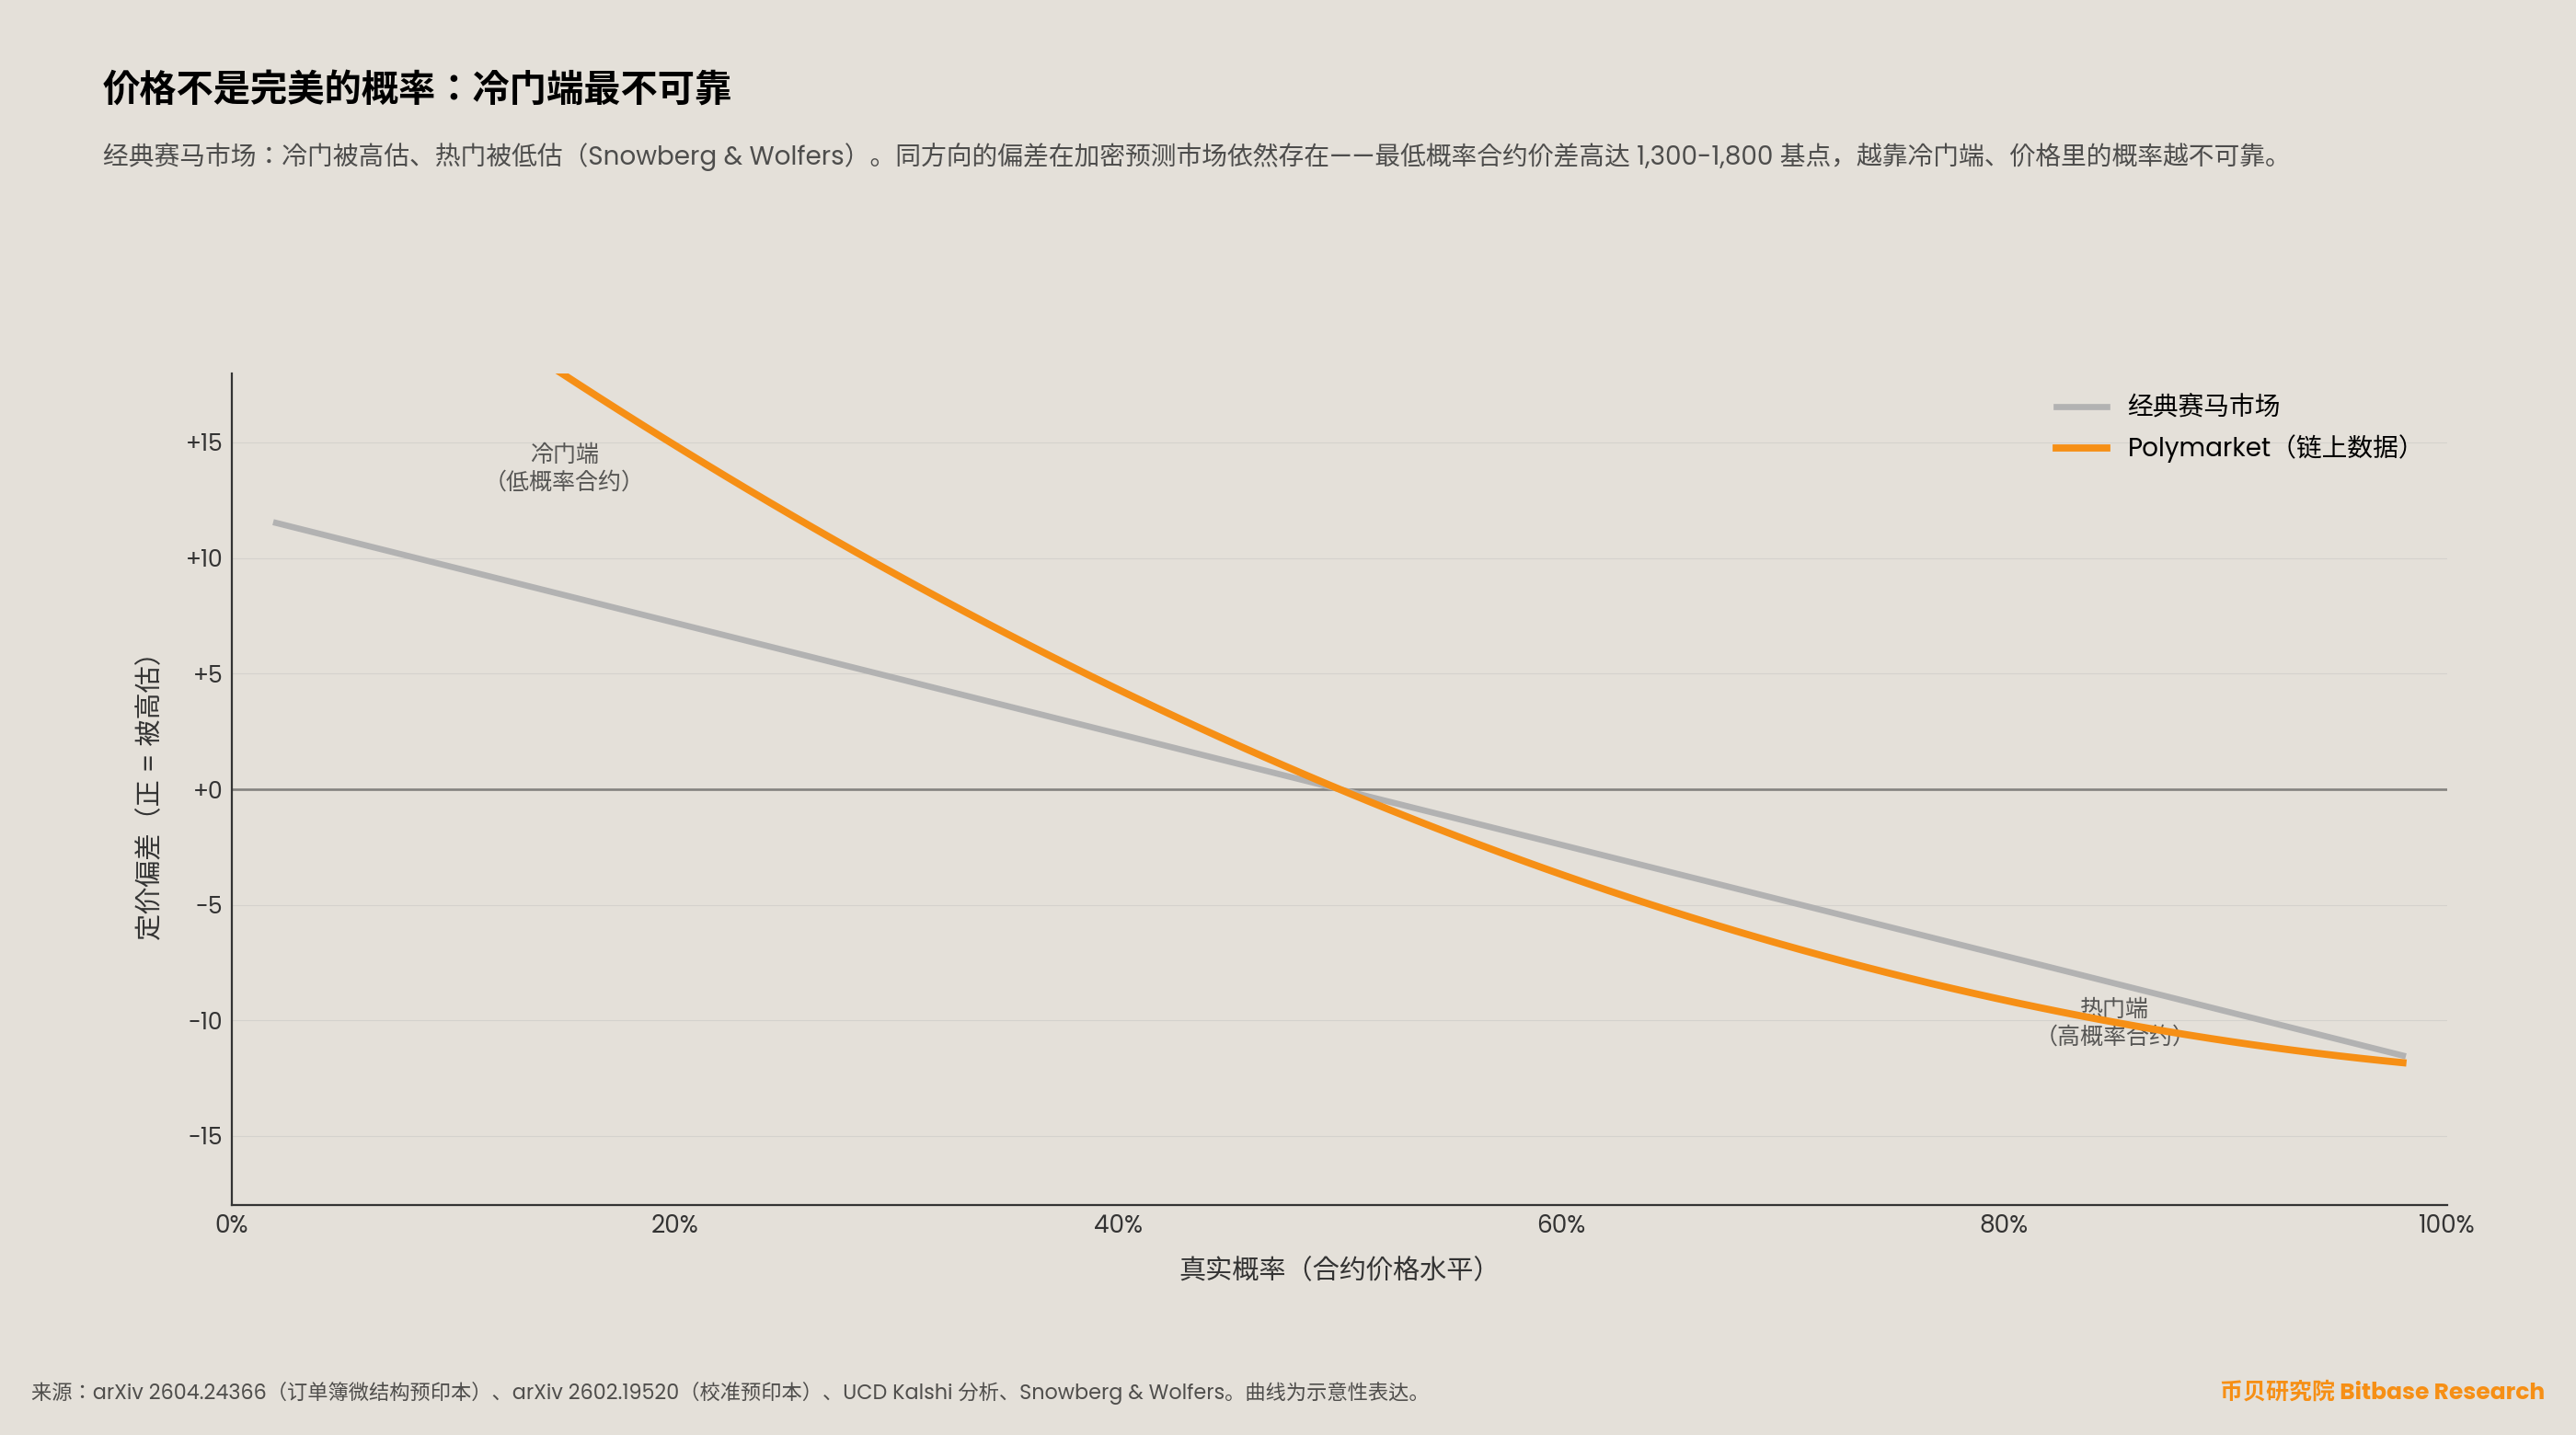
Price itself is also not a perfect probability. A phenomenon that has been repeatedly validated over nearly a hundred years is known as longshot bias: in classic horse racing markets, bettors systematically overestimate longshots and underestimate favorites—the true win rate of longshot horses is lower than what the odds indicate, leading to long-term losses when betting on longshots (as per Snowberg and Wolfers' research).
The truly counterintuitive part is: this bias has not disappeared in the so-called more rational, more efficient crypto prediction markets. Multiple studies based on the massive data from Polymarket and Kalshi have identified the same bias—University College Dublin analyzed over 300,000 Kalshi contracts, finding that the actual payoff rate for low-priced contracts is lower than their implied probabilities, while high-priced contracts have a higher payoff rate (i.e., longshots are still overestimated); a calibration study based on 292 million transactions (arXiv preprint 2602.19520) also found that the prices of long-duration contracts are systematically compressed toward 50%, undervaluing the true advantages of favorites. A microstructure preprint based on 30 billion order book events and data from 52 days (arXiv 2604.24366) quantified the costs at the longshot end: the bid-ask spreads for the lowest probability contracts can reach 1,300 to 1,800 basis points, an order of magnitude higher than traditional markets—rooted in market makers' pricing of inventory risk due to "bounded upside, asymmetric downside."
In other words: a bias recorded a century ago on racetracks still holds true today in on-chain markets with billions of dollars in volume— the "probability" in the price, the closer it gets to the longshot end, the less reliable it is.
The Ledger is Public
Here is something traditional betting cannot achieve: Polymarket is built on Ethereum smart contracts, every transaction is on-chain and auditable by anyone. The reason the two studies mentioned above can be conducted is that researchers can directly restore the direction of each transaction from on-chain transaction records—this is impossible in traditional betting with closed ledgers. Settlement is also on-chain: using USDC as collateral, smart contracts automatically settle, without needing to trust a centralized bookmaker to hold your funds.
But transparency does not equate to being unmanipulable. A shallow order book means that small markets can easily propel prices with a small amount of funds. During the tournament (from June 11 to July 19), contract prices for each match will drift in real-time with the score—this will be the most vivid live case of "how prices are formed."
Act Four · Variables Beyond Price: Regulation
Prices are also affected by a non-market variable: regulatory uncertainty.
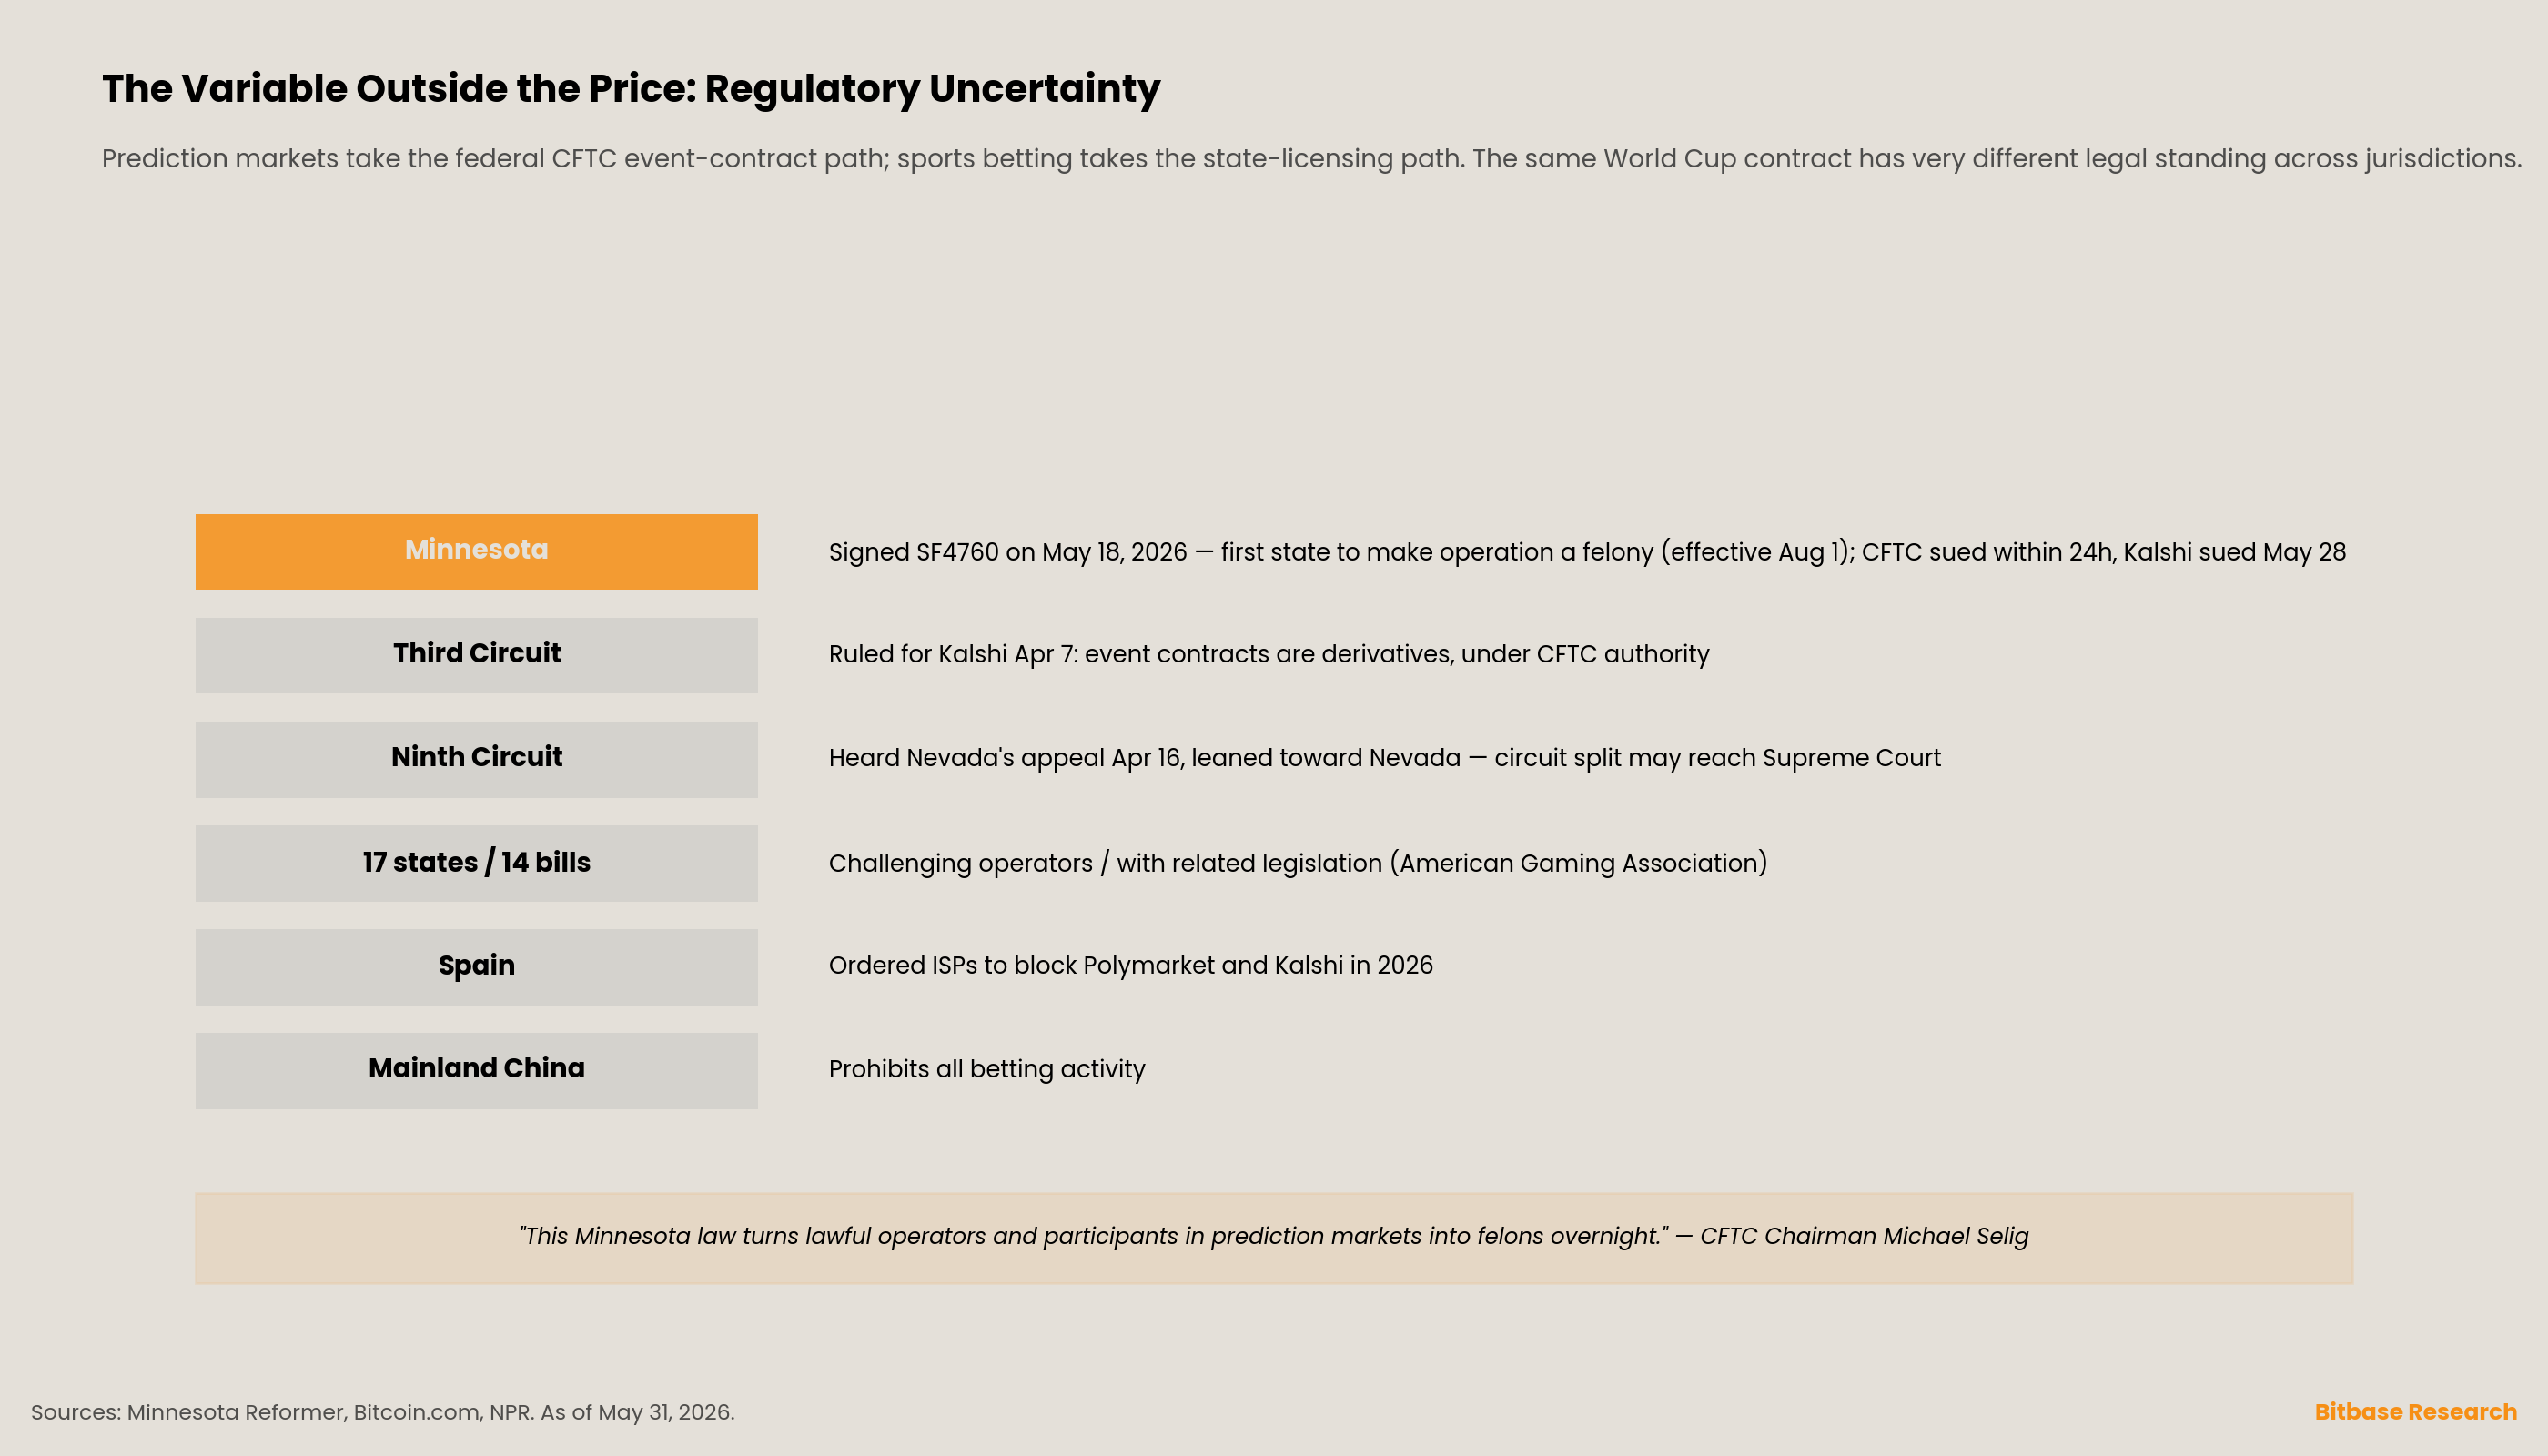
On May 18, 2026, the Governor of Minnesota signed SF4760 into law, becoming the first state in the U.S. to classify operating and advertising prediction markets as a felony (effective August 1, 2026). The CFTC (Commodity Futures Trading Commission) sued within 24 hours, and Kalshi was sued on May 28. CFTC Chairman Michael Selig stated:
"This Minnesota law turns lawful operators and participants in prediction markets into felons overnight."
This Minnesota law has turned lawful operators and participants in prediction markets into felons overnight.
This is part of an unresolved jurisdictional dispute: the Third Circuit Court of Appeals ruled in favor of Kalshi on April 7 (event contracts are derivatives, subject to CFTC regulation), while the Ninth Circuit Court of Appeals was hearing an appeal from Nevada on April 16, leaning towards Nevada—discrepancies between these two circuits may ultimately be sent to the Supreme Court. As of now, 17 states are challenging prediction market operators, and 14 states have relevant legislation; Spain ordered ISPs to ban Polymarket and Kalshi in 2026.
It is crucial to clearly differentiate between two matters: prediction markets follow the CFTC's federal regulatory pathway for event contracts, while sports betting follows state licensing pathways— the legality of the same World Cup contract is entirely different in various jurisdictions. The uncertainty in regulation itself is a variable behind the price.
Conclusion · Returning to Those Two Numbers
Returning to the beginning—"France 17%" and "Spain 16.1%."
Now you know where these two numbers come from: one is a price cleared in the market with a trading volume of hundreds of millions of dollars, influenced by longshot bias and liquidity depth; the other is a frequency derived from a supercomputer simulating the entire World Cup ten thousand times, affected by model lag and partially incorporating information from the market.
Which one is more accurate? No rigorous cross-tournament comparison can answer this question. CoinBee will conduct a post-mortem after the World Cup ends and the contract settles on July 20—looking at what the market and model each got right and wrong.
Until then, the next time you see any "championship probability," it's worth asking: how was this number produced?
免责声明:本文章仅代表作者个人观点,不代表本平台的立场和观点。本文章仅供信息分享,不构成对任何人的任何投资建议。用户与作者之间的任何争议,与本平台无关。如网页中刊载的文章或图片涉及侵权,请提供相关的权利证明和身份证明发送邮件到support@aicoin.com,本平台相关工作人员将会进行核查。


