Summary
From late May to early June 2026, the cryptocurrency market experienced the most intense sell-off of the year. Bitcoin fell more than 18% from a high of $78,000 to around $64,000; Ethereum dropped below the $2,000 mark to $1,700. The trigger for this downward movement was not a single event, but rather a confluence of multiple factors, including escalating geopolitics (the Iran Strait of Hormuz crisis raising crude oil prices by 6%), cracks in institutional confidence (Strategy sold Bitcoin for the first time in four years), record outflows from ETFs (a net outflow of $3.5 billion over 11 consecutive days), tightening macro liquidity (the new Fed Chair Warsh's hawkish stance dropping the probability of rate cuts for the year to 35%), and movements in the Mt. Gox cold wallet. The Fear and Greed Index plummeted to 11. This report analyzes five dimensions: geopolitics and macro liquidity, ETF fund flow signals, market structure contradictions, narrative fractures, and regulatory inflection points, providing a long-term perspective that penetrates short-term panic.
1. Geopolitics and Macro Liquidity: The First Major Market Test in the Warsh Era
On May 22, Kevin Warsh officially assumed office as the 11th Chair of the Federal Reserve with a vote of 54 to 45, succeeding the outgoing Powell. This former Fed governor during the 2008 financial crisis immediately signaled a clear hawkish stance, publicly criticizing the monetary policy from 2020 to 2022 as "one of the most severe policy misjudgments of the post-Volcker era," prioritizing an accelerated balance sheet reduction. The CME FedWatch indicated that on June 17, the probability of an FOMC rate cut had plummeted from 55% in April to 23%, while the probability of no rate cut for the year surged to 65%. The federal funds rate is anchored in the 3.50%-3.75% range, and the 10-year U.S. treasury yield continued to run in the 4.35%-4.55% range throughout May, exerting ongoing pressure on risk asset valuations.
More critical is that U.S. inflation is far stickier than expected. The headline CPI has rebounded year-on-year to 3.8%, while core inflation remains well above the 2% policy target. Warsh made it clear during his confirmation hearing that the focus of policy would be on inflation resilience rather than marginal softening of the labor market. Even with the unexpected weakness in May's non-farm payrolls this Friday, the Fed is unlikely to shift to easing. In this context, the external liquidity environment for the crypto market is upgrading from "mild headwinds" to "significant headwinds." Coupled with the threats of Iran closing the Strait of Hormuz spiking crude oil prices by nearly 6% in a single day—WTI crude reaching $92.54 and Brent crude rising to $94.98—higher energy costs further compress the space for rate cuts. In this first major market test of the Warsh era, crypto assets face quadruple headwinds: high interest rates, accelerated balance sheet reduction, stubborn inflation, and rising geopolitical risk premiums.
However, from a longer period perspective, the current macro predicament is not without solutions. The FOMC will release its latest dot plot, which includes interest rate paths until 2028, on June 16-17. If the median is adjusted from "one rate cut" to "no rate cuts for the year," the market may react violently in the short term, but once the expectation deviation is concentratedly released, macro uncertainty may actually decline temporarily. For the crypto market, transitioning from "high uncertainty" to "tightening certainty" may pressure short-term dynamics, but help funds reallocate under a clearer interest rate framework in the medium to long term. Historically, the last rate hike in the late stage of the 2018 rate hike cycle triggered a phase of rebound in risk assets, a lesson that is worth noting.
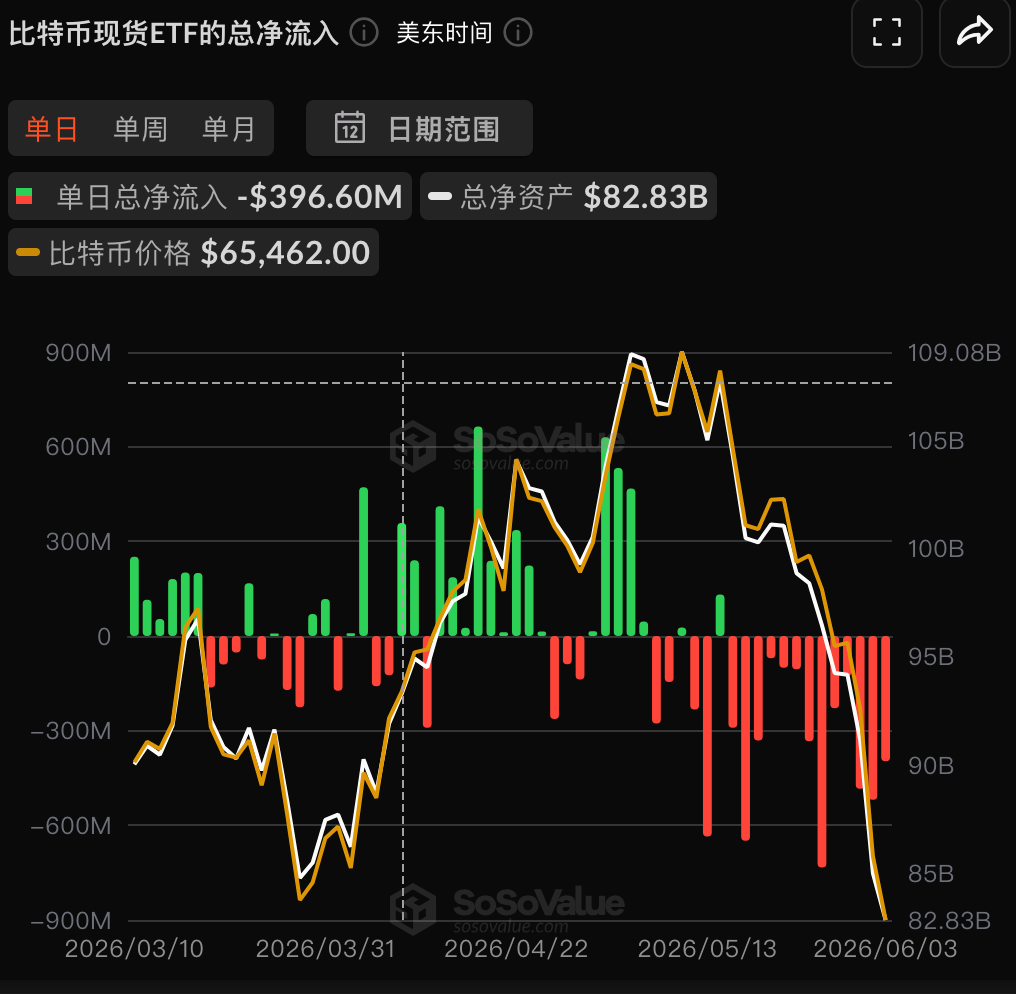
2. The Signal Significance of ETF Fund Flows: Is $3.5 Billion Outflow a Retreat or a Reallocation?
The most direct pressure on funds in this downward phase comes from spot ETFs. As of June 2, the U.S. spot BTC ETF has seen net outflows for 11 consecutive trading days, totaling about $3.5 billion, setting a new record for the longest continuous outflow since its launch in January 2024. Over the course of three weeks, the BTC ETF has seen cumulative outflows exceeding $4.21 billion, with assets under management (AUM) dropping from $104 billion to $94 billion. The ETH ETF has also seen net outflows of no less than $241 million during the same period, totaling over $712 million in three weeks. Notably, for the first time in 2026, the annual net inflow has turned negative—indicating that the ETF, the strongest buying engine since 2024, has officially stalled and reversed.
However, a deeper analysis of the structural characteristics of ETF outflows reveals that the reality is more nuanced than the surface numbers suggest. CoinShares and Galaxy attribute the current round of outflows to three factors: geopolitical tensions (U.S.-Iran conflict), funds rotating from crypto to AI and semiconductors (NVDA surged over 6% after the Computex release of RTX Spark, with Marvell jumping over 12% after receiving support from Jensen Huang), and Strategy's weakening of momentum for new purchases. It is noteworthy that the number of ETF shares has not decreased correspondingly—indicating that institutions are not "liquidating" but rather "tactically reducing positions." Although BlackRock's IBIT saw a single-day outflow of $528 million, its AUM remains at the top, and BlackRock's CEO recently stated that "Bitcoin could reach $700,000," demonstrating that institutional long-term strategic judgment remains intact.
From historical patterns, the short-term volatility of ETF fund flows is not unique to crypto. In April 2024, the BTC ETF also experienced net outflows of about $1.2 billion, but Bitcoin rebounded to new highs within three months. The current $3.5 billion outflow is notable, but relative to the total AUM of over $94 billion for the BTC ETF, it only represents about 3.7%. Standard Chartered's latest report maintains a long-term optimistic outlook for digital assets, predicting Ethereum will reach $40,000 by 2030. In summary, the current ETF outflow is more likely a "tactical reallocation" rather than a "strategic withdrawal"—after funds rotate into AI themes and once AI valuations fully reflect expectations and crypto has undergone sufficient adjustments, the momentum for capital inflow will still exist.
3. Internal Market Structural Contradictions: Fundamentals Rising, Prices Falling
If we look solely at on-chain data, the fundamentals of the crypto market have never seemed stronger. Bitcoin's total network hash rate reached a historic high in 2026, with next-gen ASIC miners bringing higher efficiency, and institutional mining continuing to expand. Meanwhile, the total market capitalization of stablecoins reached $325.4 billion (with USDT at $187.9 billion and USDC at $75.9 billion), growing by 37.9% since April 2025. The hash rate represents long-term confidence in the underlying infrastructure, while the stablecoin market cap indicates the level of on-chain liquidity. Both are at historic peaks, sharply diverging from Bitcoin's 34% price drop from its highs.
The reasons for the "decoupling of fundamentals and prices" are multifaceted. Firstly, Bitcoin's short-term pricing power has shifted from on-chain investors to macro traders. The 90-day rolling correlation of BTC with Nasdaq remains in the range of 0.6-0.7, with its "high beta tech stock" attributes far outweighing its "digital gold" narrative, indicating that when macro funds compress risk exposures due to rising interest rates, BTC is among the first assets to be reduced. Secondly, futures leverage has amplified the selling pressure—BTC triggered large-scale long liquidations after dropping below $70,000, with a 24-hour global liquidation of $1.624 billion, the highest since February, and open interest remains above $52 billion, indicating that deleveraging might not yet be completed. Lastly, Ethereum faces structural dilemmas: Solana continues to erode market share in DeFi and DEX trading volume, and L2 fragmentation obfuscates ETH's value capture, with inflows into the ETH ETF significantly lagging behind those of the BTC ETF.
However, from a cyclical perspective, this sudden decline occurred against the backdrop of continuously improving network fundamentals, a "divergence" that has repeatedly appeared throughout crypto history and often constitutes a mid-term layout window. During the 2017 bull market, BTC experienced five corrections of over 30%, three in 2021. The current 34% correction is not uncommon in historical cycles, with BTC still over 330% higher than its low in 2022. When the market is in extreme panic (with the Fear and Greed Index at just 11) and the on-chain fundamentals are continuously improving, historical data shows that substantial returns can follow in the next 12 months: +80% after extreme fear in September 2023, +120% after August 2024, and +190% after November 2022. While historical experience does not guarantee future returns, it reminds us that maintaining focus on long-term fundamentals amid panic is often an important way to identify structural buying points.
4. Strategy's First Sale of BTC: A Storm in a Teacup and Repairing Narrative Fractures
On June 1, a SEC filing caused a minor earthquake in the crypto market. Strategy sold 32 Bitcoins between May 26 and 31, at an average price of about $77,135, cashing out around $2.5 million to pay for STRC preferred stock dividends. This transaction accounted for only about 0.004% of Strategy's total holdings—an amount that is less than the daily trading volume of the company’s stock—yet it ignited market turmoil due to one critical fact: this marked the first net reduction in holdings by Strategy in 41 months since August 2022. In the cryptocurrency narrative framework, Saylor and his led Strategy have played the role of the "ultimate HODLer," and "we will never sell Bitcoin" has been an important cornerstone supporting market faith. When this cornerstone showed the first crack, MSTR stock plunged 11% in two days, and BTC sharply dropped to $64,000.
A calm examination of this event requires distinguishing between "narrative shock" and "fundamental change." The 32 BTC accounted for a minuscule drop in Strategy’s total holding of over 500,000 BTC. The purpose is clear—paying preferred stock dividends is a routine corporate financial operation unrelated to being bearish on Bitcoin. From a tax planning perspective, slightly reducing positions to lock in tax credits at the $77,135 price level also makes complete sense. However, during this downturn, the Fear and Greed Index dropped sharply from 30 to 11, signaling that investors' risk perception was in a state of extreme vulnerability. In this environment, the minor cracks in "faith symbols" were amplified infinitely by emotional amplifiers, overshadowing the actual significance of the event.
In the medium to long term, the repair of Strategy's narrative fracture depends on two variables. First, whether Saylor will publicly clarify that this sale was a routine operation for tax planning rather than a strategic shift. Second, whether Strategy will resume buying afterwards—if they reappear on the buy-side within the next few weeks, the current panic will prove to be a storm in a teacup. From the perspective of institutional behavioral finance, the entity that continuously bought for 41 months is being re-priced due to a mere 0.004% adjustment in position, which resembles a function of market sentiment more than fundamentals. Once the risks have been thoroughly released and rational investors reassess this event, panic pricing is often corrected.
5. The CLARITY Act and Regulatory Inflection Point: The Year's Biggest "Unpriced" Catalyst
Amid a confluence of multiple bearish pressures, a potential positive variable that may have been severely underestimated by the market is advancing in Washington. On May 15, the CLARITY Act passed the Senate Banking Committee vote with key votes and entered the full chamber voting process. This act is regarded as the "constitutional document" of the U.S. crypto industry regulatory framework—establishing clear regulatory boundaries for digital assets at the federal level for the first time, clarifying the jurisdictional divisions between the SEC and CFTC, and providing a systematic legal framework for stablecoin issuance, exchange registration, and market structure. It was previously passed by the House with an overwhelming advantage of 294 to 134, with bipartisan support exceeding expectations. The full Senate vote is highly likely to be completed in June.

The strategic significance of the CLARITY Act for the crypto market cannot be overemphasized. The greatest uncertainty facing the current crypto industry is not a matter of technology or demand, but rather the lack of a regulatory framework. As the largest capital market globally, regulatory ambiguity has long troubled institutional investors—pension funds, endowment funds, and insurance companies exercise caution primarily due to the absence of clear compliance pathways. Once the act is passed, this uncertainty will fundamentally be eliminated: the credibility of spot ETFs as compliant investment vehicles will be further enhanced, attracting conservative institutions that have previously hesitated at the door; the $325.4 billion stablecoin ecosystem will gain operational legitimacy; and the U.S. shifting from "ambiguous exclusion" to "clear acceptance" will produce global spillover effects.
It is noteworthy that during the current panic sell-off, the progress of the CLARITY Act seems to have gone entirely unpriced by the market. In the path of BTC dropping from $78,000 to $64,000, there is hardly any visible price correction reflecting the advancement of the legislation. This phenomenon of "policy good news being drowned out by emotion" is not uncommon during times of extreme market fear, but it also signifies that once emotion is restored and the bill is officially passed, this catalyst will release its entire incremental effect at a price level that has virtually no expectations. For medium to long-term investors, identifying structural positives "not yet priced in" during market panic is a historically validated allocation strategy. Of course, there are still uncertainties regarding the bill’s trajectory—opposition from banking lobbying groups to some provisions, the specific timetable for the full chamber vote, and the president's willingness to sign will need to be continuously monitored.
6. Conclusion: Identify the invariance of long-term narratives amid panic
Looking at the overall crypto market landscape in early June 2026, we see a complex picture of "short-term panic and long-term fundamental improvement" coexisting. Price dimension: BTC dropping from $78,000 to $64,000, ETH falling below $2,000, Fear and Greed Index at 11—all indicators point to extreme fear. Driving dimension: escalating geopolitics, macro tightening, record outflows from ETFs ($3.5 billion over 11 days), fractures in faith narratives (Strategy's first sale of BTC), and on-chain movements (Mt. Gox transferring $739 million) form a confluence of five bearish pressures, and their intensity is exceptionally rare. Structural dimension: $1.624 billion liquidated in 24 hours, open interest still above $52 billion, suggesting that deleveraging may not yet be completed.
However, the underlying narrative of the crypto market has not fundamentally changed. Decentralization, digital sovereignty, value storage—these core logics supporting the long-term value of crypto assets remain valid at $100,000 BTC as they do at $64,000. Price fluctuations alter short-term sentiment, not the security of underlying protocols. The historical peak of total network hash rate, $325.4 billion stablecoin market cap (+37.9% YoY), and steady progress of the CLARITY Act—these structural improvements are accumulating at a rate unnoticed by market panic. History repeatedly proves that extreme fear intervals (Fear and Greed Index at 25) often present a contrarian layout window for medium to long-term investors, even though historical experience is never a guarantee of future returns.
Looking ahead to the coming months, the trajectory of the crypto market will diverge on three critical variables. The baseline scenario (probability about 50%): BTC builds a bottom in the range of $60,000-$68,000 for 2-4 weeks, rising to $70,000-$75,000 after non-farm payrolls and the FOMC dot plot are released. The optimistic scenario (about 25%): the CLARITY Act is passed in June, alongside ETF fund inflows and geopolitical easing, BTC forms a V-shaped rebound and retests the previous high above $78,000. The pessimistic scenario (about 25%): non-farm payrolls beat expectations, pushing interest rate expectations higher, Iranian escalation drives crude oil above $100, and global risk assets are pressured uniformly, bringing BTC down to $52,000-$56,000. But even in the most pessimistic path, BTC is still over 260% higher than its low in 2022—the long-term upward trend is far from broken.
In summary, the current crypto market is undergoing a typical cyclical adjustment within a bull market. Panic is a normal component of market mechanisms—it compresses valuations, liquidates excessive leverage, and distinguishes between speculators and long-term holders. For students at the Huobi Growth Academy and for investors at large, what is most needed now is not to be swept away by emotion into irrational decisions, but to return to fundamentals—examining trends in hash rate, growth in stablecoins, the evolution of regulation, and the real-world applications of decentralization technology. A 34% price drop does not mean a 34% drop in value. If the underlying narrative of the crypto market has not changed, the most appropriate response strategy is not to panic-sell, but rather to maintain rationality amid fear and to uphold a long-term perspective amid volatility. As the old saying on Wall Street goes: "Bull markets are born in pessimism, grow on skepticism, mature in optimism, and die in euphoria." Today's extreme fear may serve as the starting point for a new round of long-term positioning.
免责声明:本文章仅代表作者个人观点,不代表本平台的立场和观点。本文章仅供信息分享,不构成对任何人的任何投资建议。用户与作者之间的任何争议,与本平台无关。如网页中刊载的文章或图片涉及侵权,请提供相关的权利证明和身份证明发送邮件到support@aicoin.com,本平台相关工作人员将会进行核查。


