Spot demand is weak, ETF inflows have slowed, and bullish momentum has clearly cooled.
Written by: Glassnode
Translated by: AididiaoJP, Foresight News
Bitcoin's structure remains resilient, but weakening spot demand, slowing ETF inflows, and increasingly crowded bullish positions indicate that upward momentum is gradually cooling beneath the surface.
Summary
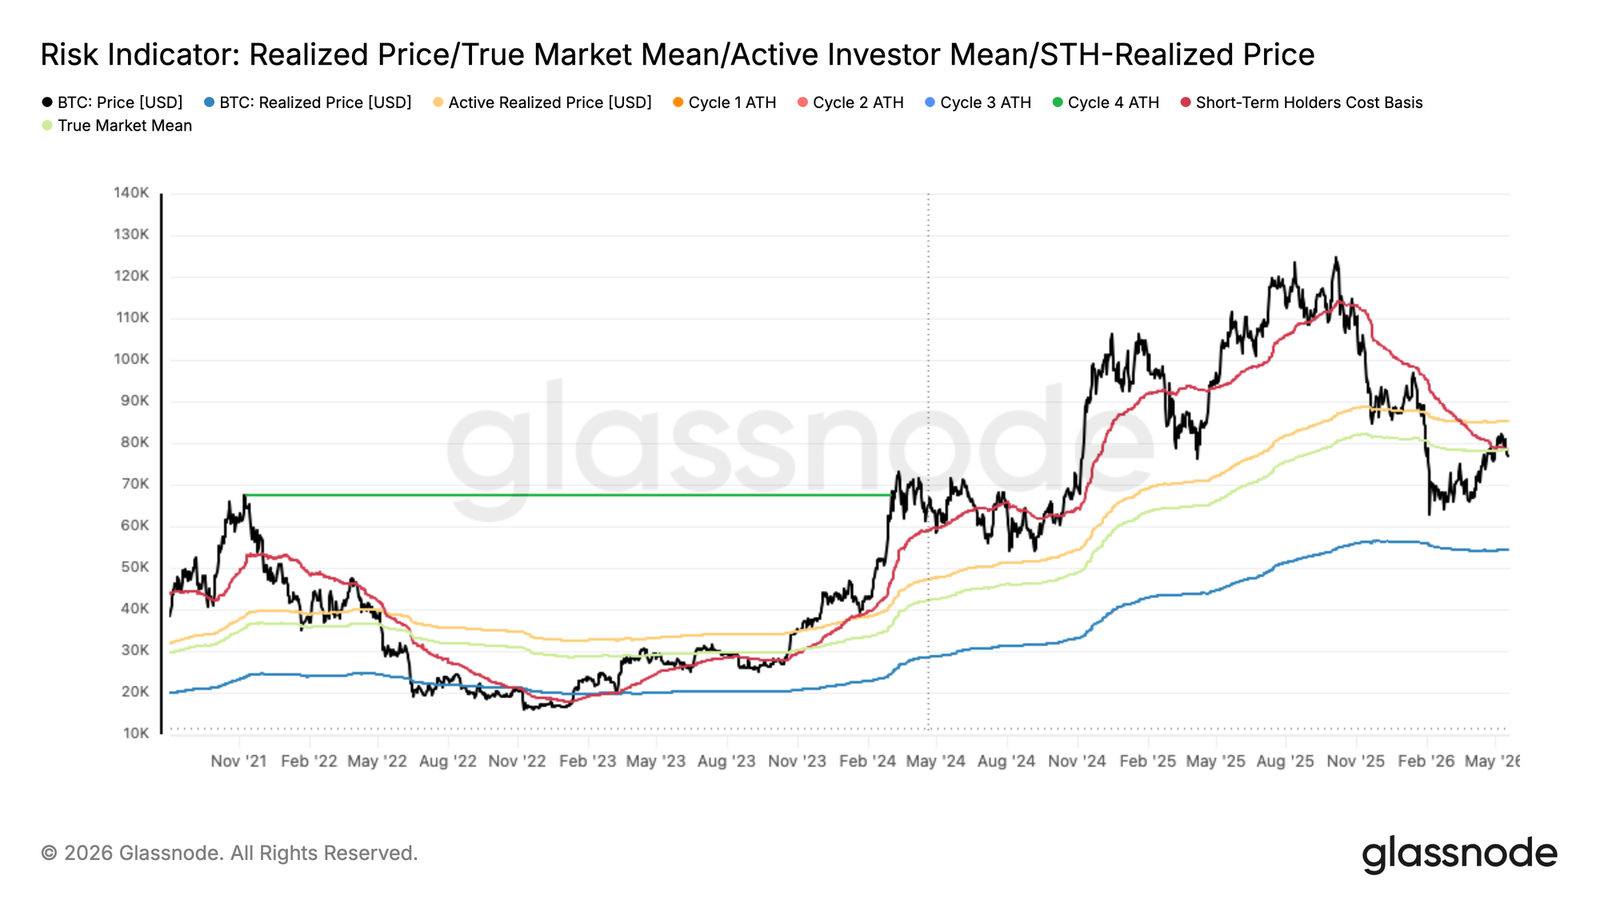
- Bitcoin has reclaimed the True Market Mean at $78,300, but has failed to hold above this level. Historically, consolidating around this level may take several weeks to months to confirm a reliable bull market transition.
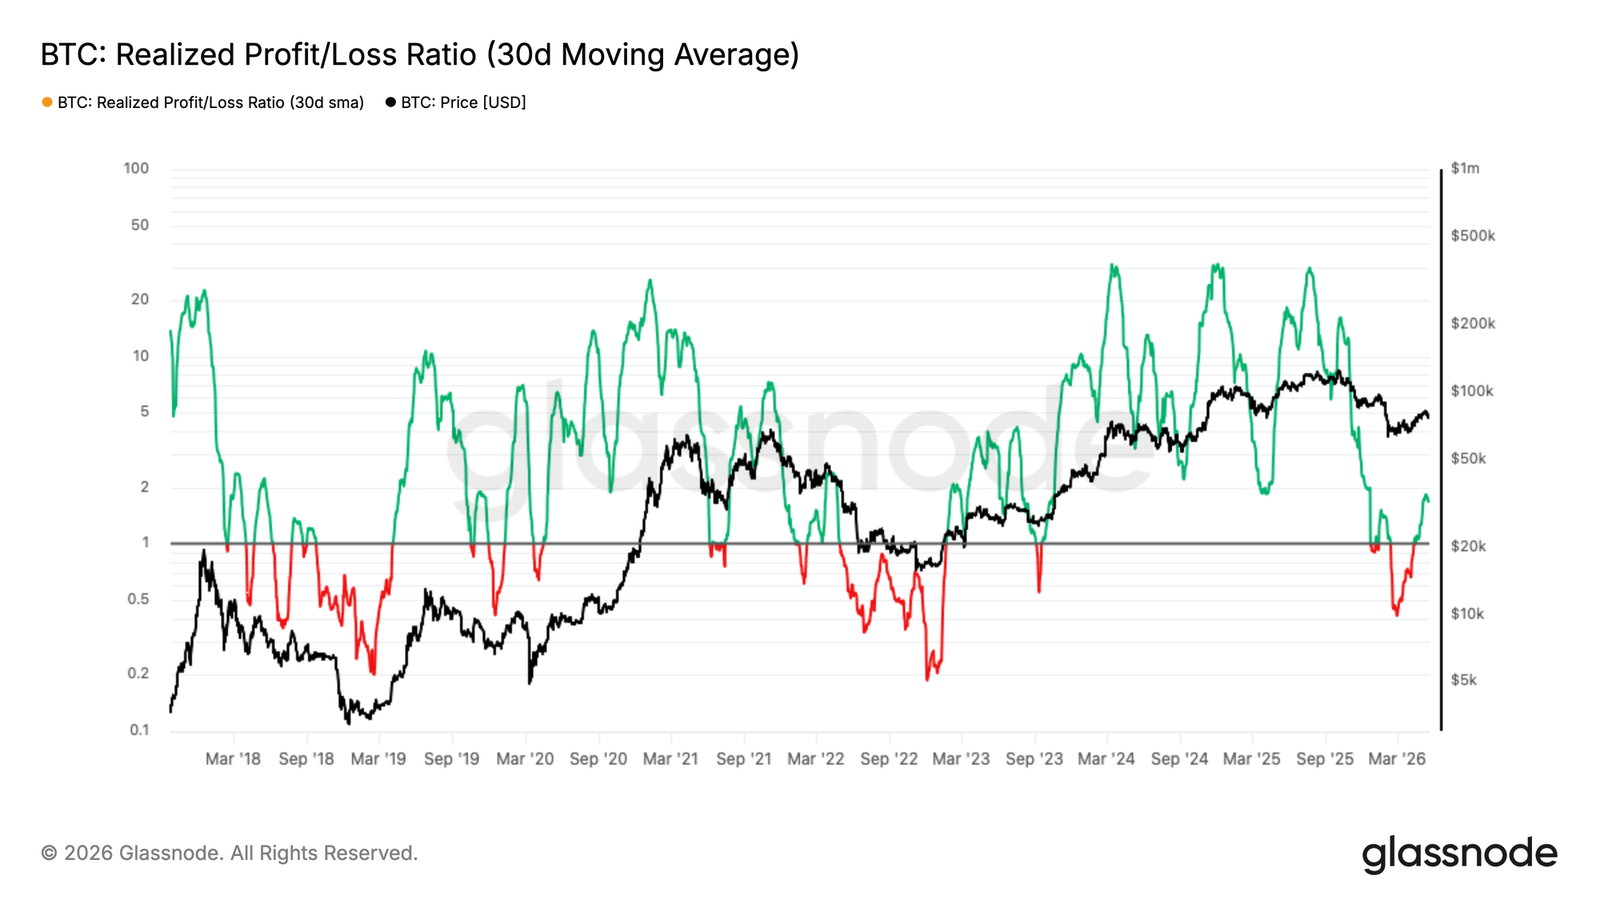
- The 30-day realized profit-loss ratio SMA has surged from 0.4 in February to 1.8 during the rebound period, indicating that demand is insufficient to absorb the wave of profit-taking. A sustained hold above 2 is needed to signal a genuine buyer recovery.
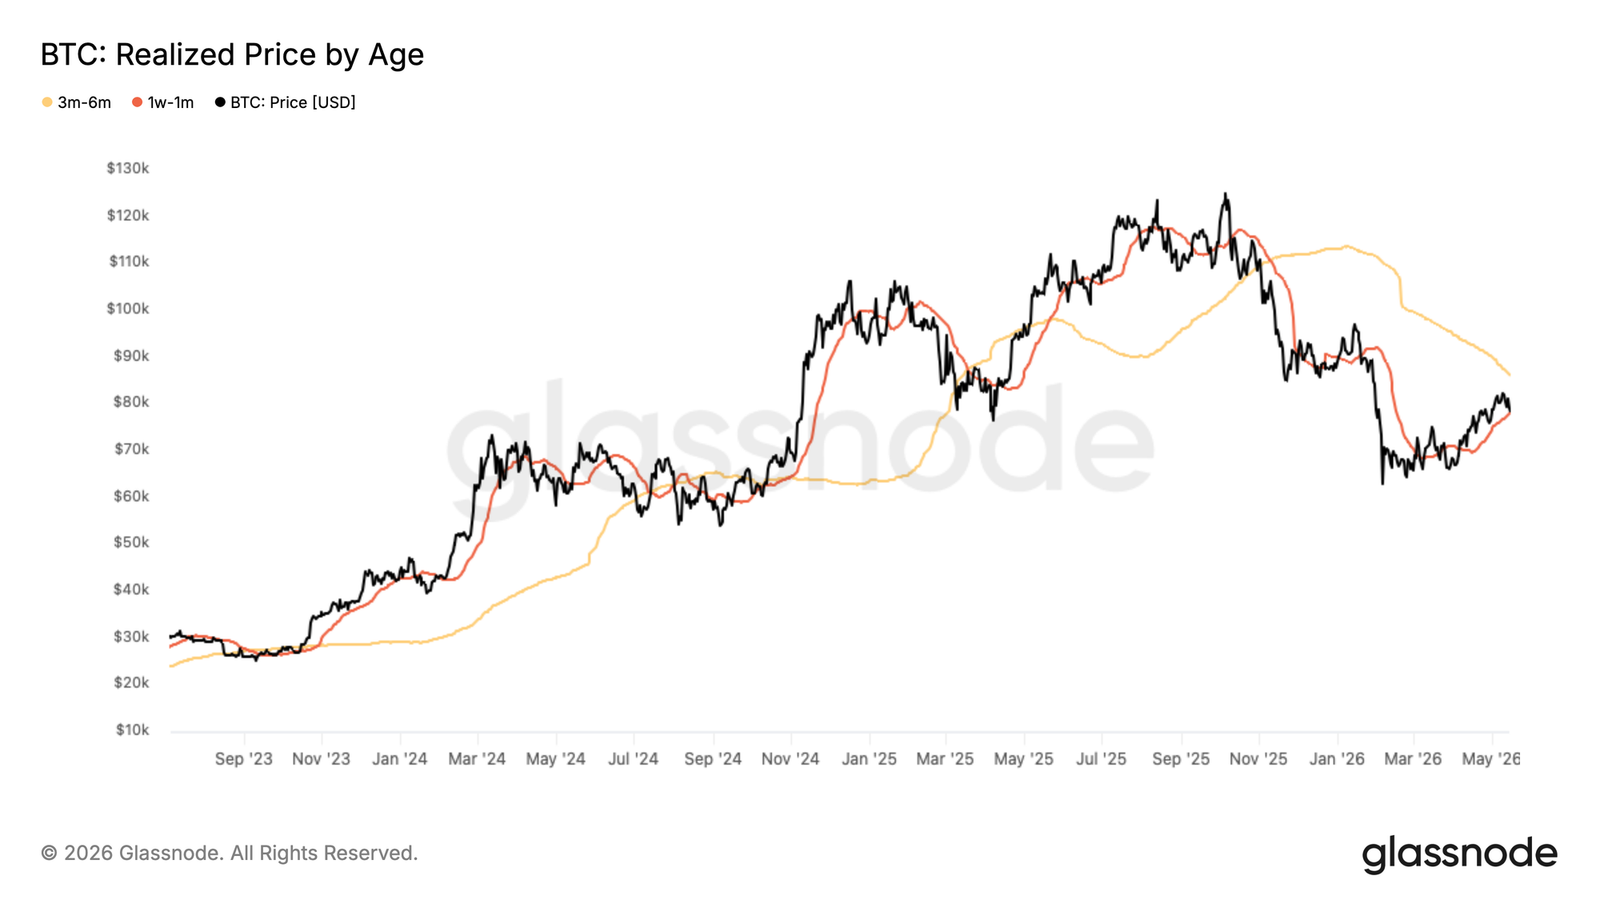
- The 30-day cost basis at $78,200 has shifted from support to overhead resistance, while the cost basis for the accumulation group from February to April at $71,400 has become the most immediate support for the current correction.
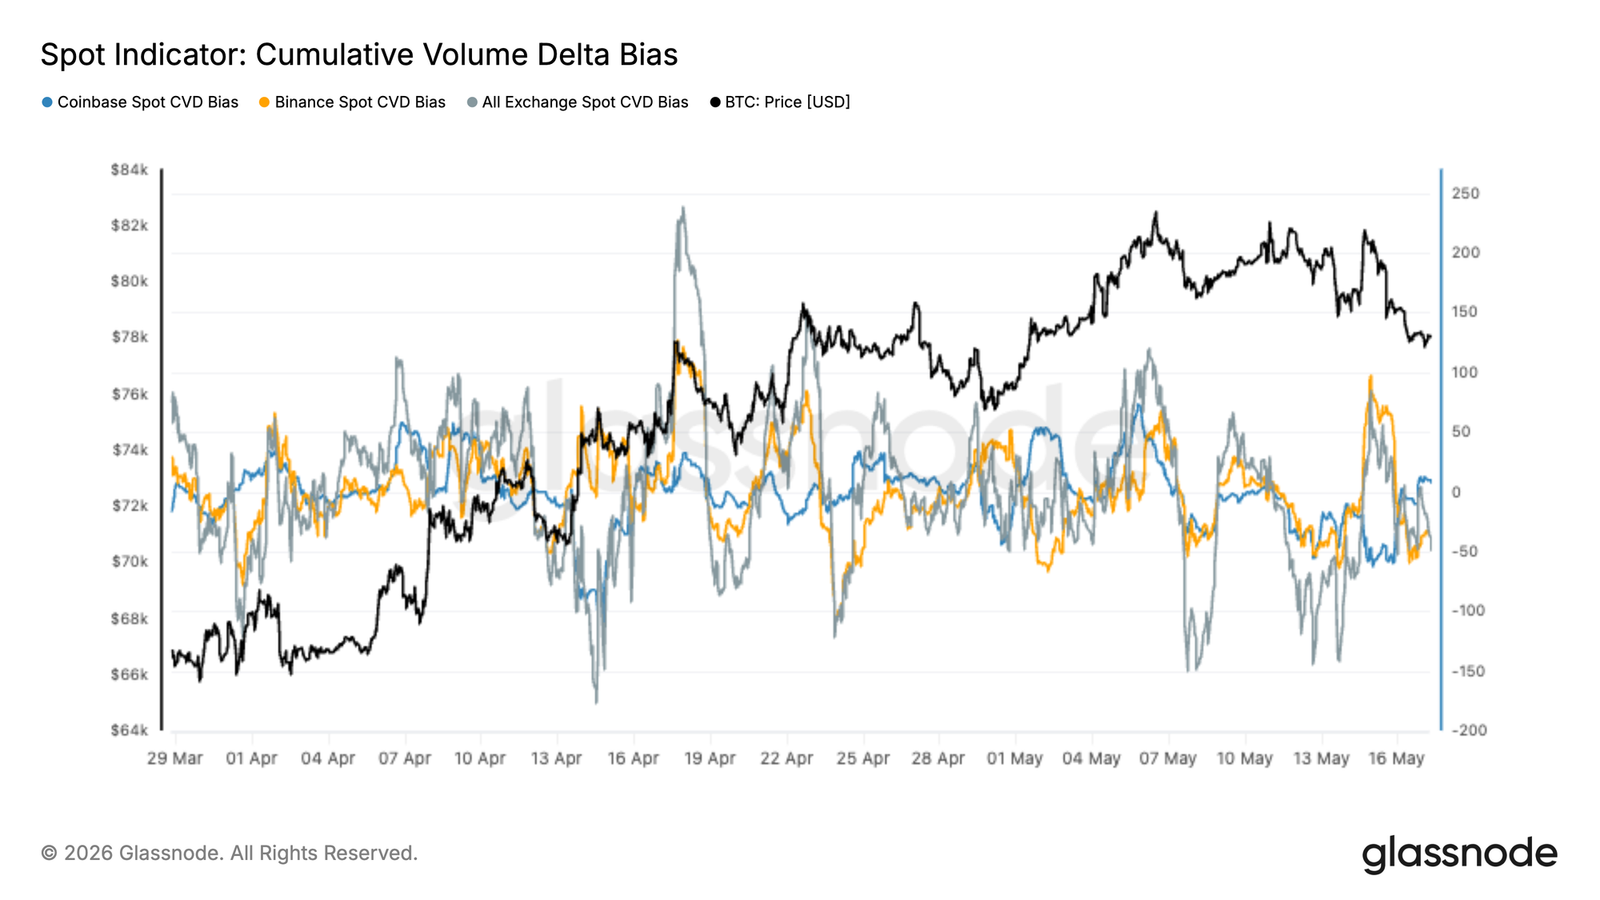
- Internal indicators of the spot market have weakened in recent weeks, with the total spot CVD remaining predominantly negative and Coinbase activity lagging. This suggests that despite occasional bursts of overseas speculative demand, American institutional spot participation remains weak.
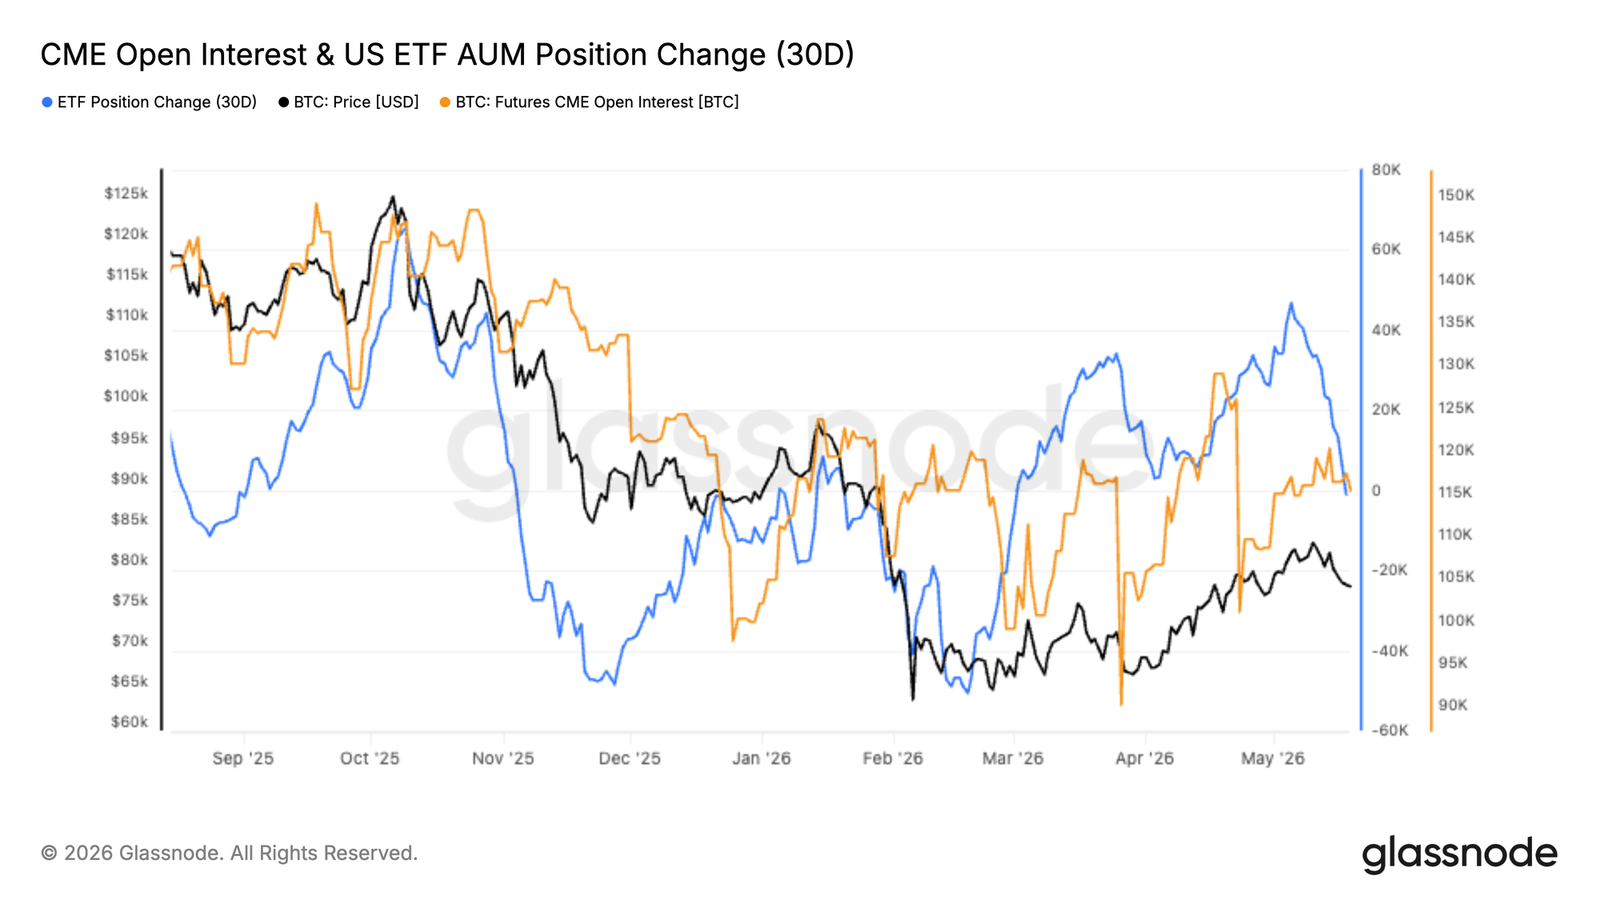
- CME futures open interest continues to rise along with prices, indicating that institutional participation in the derivatives market is improving, although spot demand remains insufficiently decisive near current high levels.
- The accumulation momentum of U.S. spot ETFs has recently begun to slow down. The 30-day change in ETF holdings has flattened significantly after strong buying in April and early May, indicating that U.S. institutional spot demand has become less aggressive near current price levels.
- Implied volatility has begun to rebuild from low levels, primarily concentrated at the front end, while longer-term expectations remain stable. Realized volatility continues to decline, expanding the volatility risk premium, making protective costs relatively cheap.
- Option positions remain defensive. The skew indicates a resurgence in demand for downside protection, while the short gamma zone around $75,000 makes the spot market susceptible to amplified hedging flows and more intense price fluctuations.
Macroeconomic Insights
The macro backdrop has clearly tightened, as the market faces a stronger dollar, higher yields, and renewed inflation pressures in the energy market. The DXY has risen to a six-week high, and U.S. 10-year yields have climbed above 4.6%, with 30-year yields also approaching multi-year highs, reflecting a sharp repricing of interest rate expectations. The market is now assigning a higher probability to the Fed raising rates before the end of the year, reversing previous expectations for easing policy.
Commodity markets are reinforcing tighter macro shocks. Oil remains high due to Middle Eastern supply risks, and inflation expectations remain active, limiting rate-cutting space. Gold struggles to continue rising due to increasing real yields and a stronger dollar, indicating that safe-haven funds are being challenged by tighter financial conditions.
For digital assets, the pattern remains constructive but increasingly fragile. Bitcoin's resilience in the face of higher yields and a stronger dollar suggests underlying demand is still present, but macro shocks are no longer clearly favorable. Achieving sustained upward movement may require oil stabilization, yields retreating, and the DXY losing momentum, which would loosen liquidity conditions and expand risk appetite once again.
On-Chain Insights
Testing the Bear-Bull Boundary
The recent rebound to $82,000 marks a significant recovery of the True Market Mean at $78,300. This price model tracks the average entry cost of actively traded Bitcoin supplies, historically serving as the boundary between bear and bull markets. Reclaiming this level is a necessary condition for structural transition, but not a sufficient one. Typically, the pre-phase of a bull market requires several weeks to months of sustained consolidation around this model to confirm a reliable trend shift. A decisive one-time breakthrough of the True Market Mean, while constructive, has not yet met this requirement.
Therefore, any deeper retracement from current levels would redefine the recent rebound as a local high in a continuing bear market. This structure has appeared multiple times in previous cycles before prices have shown sustained follow-through, remaining a high-probability outcome.
Profit-Taking Outpaces Demand
Further examining the internal mechanics of the recent rebound, the realized profit-loss ratio provides an accurate indicator of market health. This metric measures the ratio of on-chain realized profit dollar value relative to losses, with values above 1 indicating dominance of profit-taking and below 1 reflecting dominance of loss realization.
The 30-day SMA of this metric surged from a low of 0.4 in February to 1.8, reflecting a reasonable shift in spending after the price recovery. However, the market has failed to maintain momentum amid this rising wave of profit-taking, indicating that demand has not yet fully recovered enough to absorb selling pressure as sellers seize opportunities to exit during the rebound.
A 30-day (or 90-day) SMA of the realized profit-loss ratio decisively stabilizing above 2 for several weeks would constitute a more meaningful signal indicating the true revival of buyer confidence and that the market has the capacity to digest distribution pressure without retracing.
Cost Basis Levels Define New Ranges
As prices retract below the True Market Mean, the realized price metric delineated by holding periods provides a granular framework for mapping the most direct support and resistance levels. This model tracks the average purchase price of coins segmented by holding period, directly mapping the behavioral anchor points of different investor groups onto the price chart. The cost basis for the recent 30-day accumulation wave (driving the rebound momentum) is around $78,200. As prices now fall below this level, this group has shifted to unrealized losses, transforming the previously supportive floor into an overhead supply zone, increasing selling pressure in any attempted rebound.
Below spot, the cost basis of investors accumulated during the consolidation from February to April (now classified as 1-3 month holders) is around $71,400, and as this group’s profit margin continues to narrow, they face increasingly strong incentives to protect profits before conditions deteriorate further, representing the most likely near-term support level.
Off-Chain Insights
Return of Spot Selling Pressure
Latest spot flow data continues to show weak overall demand beneath the surface, with the total exchange spot CVD tending to remain negative during the recent correction to the $77,000 high. This indicates that selling pressure continues to exceed aggressive spot buying from major trading venues.
Recently, Binance’s spot flow has rebounded moderately from deeply negative values, while Coinbase activity remains relatively subdued. This divergence suggests stronger overseas speculative participation, while U.S. institutional spot demand remains lacking in conviction near current price levels.
Although Bitcoin's structure is relatively resilient, the latest spot positioning data shows that broad spot accumulation has yet to fully reemerge.
CME Warms Up While ETF Demand Slows
CME futures open interest has continued to rise steadily as Bitcoin reclaims the low of $80,000, indicating that institutional traders are rebuilding their exposure following the sell-off in February. The warming of CME activity suggests that even with restrictive macro conditions, institutional participation in the derivatives market is still growing.
Meanwhile, the momentum of U.S. spot ETF accumulation has begun to slow. The 30-day change in ETF holdings has flattened significantly after strong buying in April and early May, indicating that the U.S. institutional groups are becoming less aggressive in their spot demand near current price levels.
The result is that the market is increasingly driven by futures positions rather than strong spot accumulation. The recent upward movement continues to attract leveraged involvement, but as Bitcoin approaches the upper end of the current range, the pace of fresh spot buying has slowed.
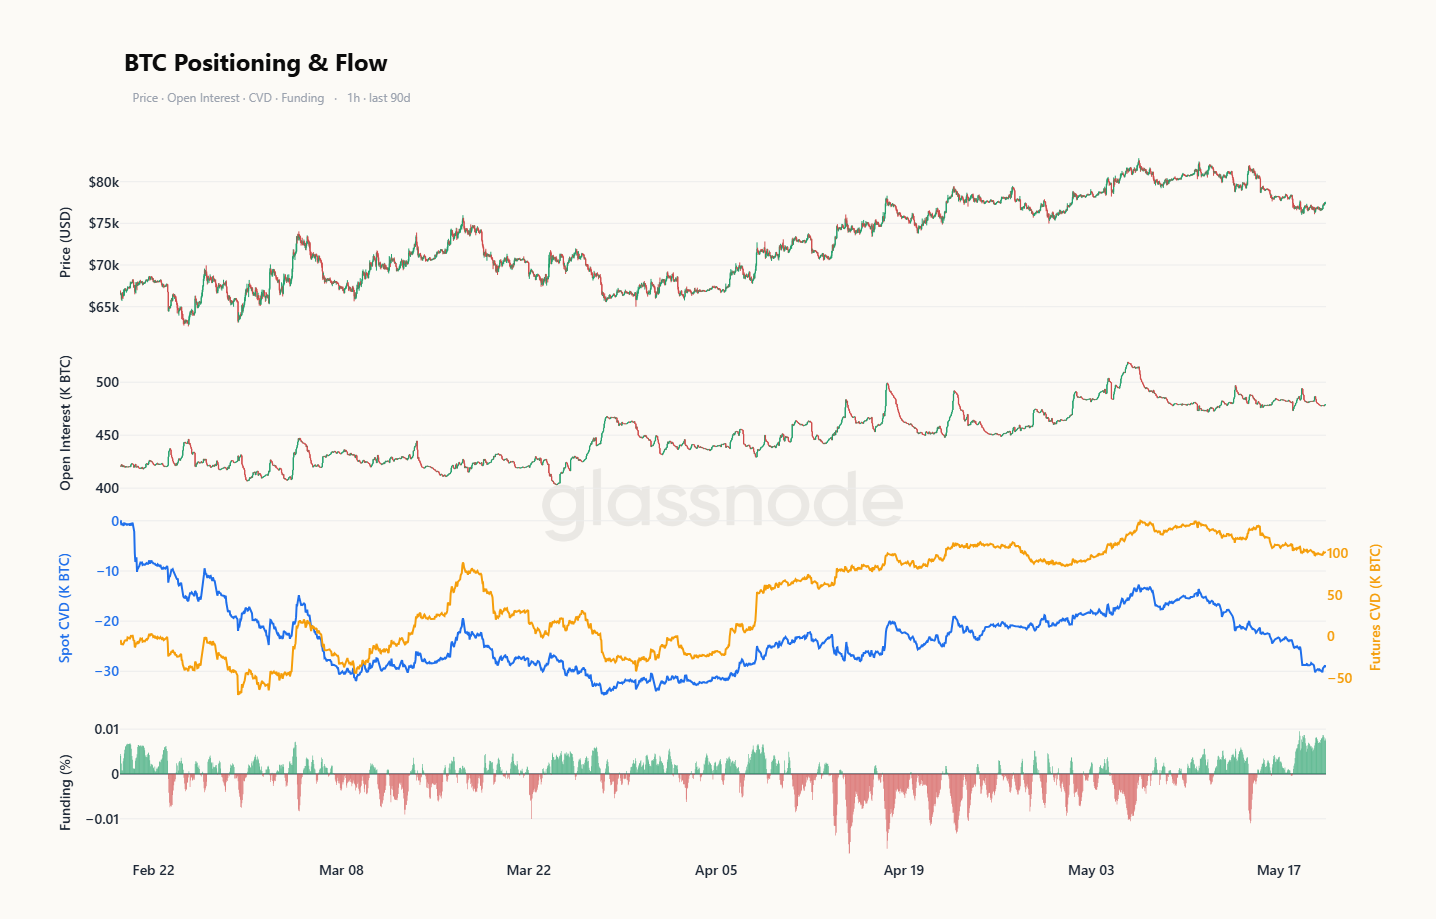
Weak Spot, Crowded Bulls
Latest order flow data shows that the recent pullback is predominantly driven by spot factors. Futures open interest has only moderately declined, remaining high relative to where Bitcoin traded last in this range, while the weakness of spot CVD significantly exceeds that of futures CVD. This indicates that the recent downward movement is driven more by continued spot selling rather than aggressive short positions.
The funding rates underscore this picture. Funding rates have not reset with the price decline; rather, they have remained positive and recently started to strengthen again, indicating that leveraged bulls continue to pay to maintain their positions in a weaker market.
In summary, even with soft spot demand, the market maintains high bullish positions, a pattern typically resolved through spot buying or broader derivatives resetting.
Implied Volatility Rebuilding from Low Levels
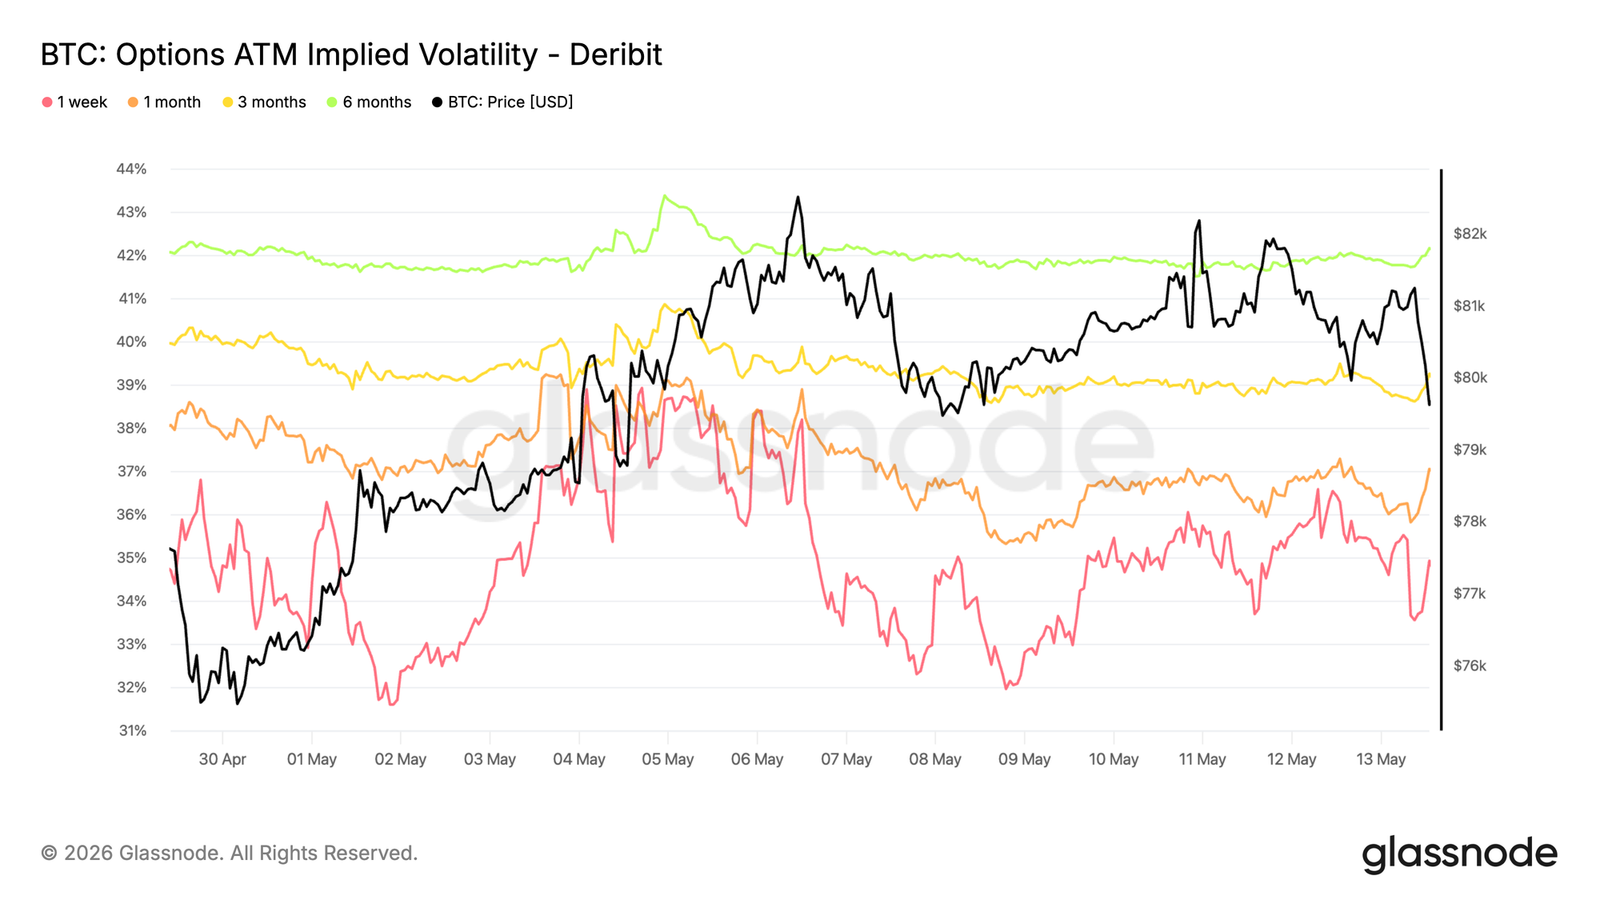
Starting with implied volatility, the market is re-pricing for volatility but remains at a lower base.
Bitcoin implied volatility across various terms has risen since last week, with the front end increasing from 32% to 36%. Six-month terms remain relatively stable around 42%, indicating that despite recent spot fluctuations, changes in longer-term expectations are minimal.
Charts show that the front end reacts distinctly as spot moves within a range, while the back end remains anchored. This indicates that traders are paying slightly higher costs for short-term options but have not yet attributed a broader shift to volatility.
With implied volatility still at relatively low levels, hedging costs remain cheap, especially for short-term event risks.
The current structure reflects a market where realized volatility is declining faster than implied volatility is being re-priced downward, effectively allowing the volatility risk premium to continue expanding.
Declining Realized Volatility, Expanding Volatility Risk Premium
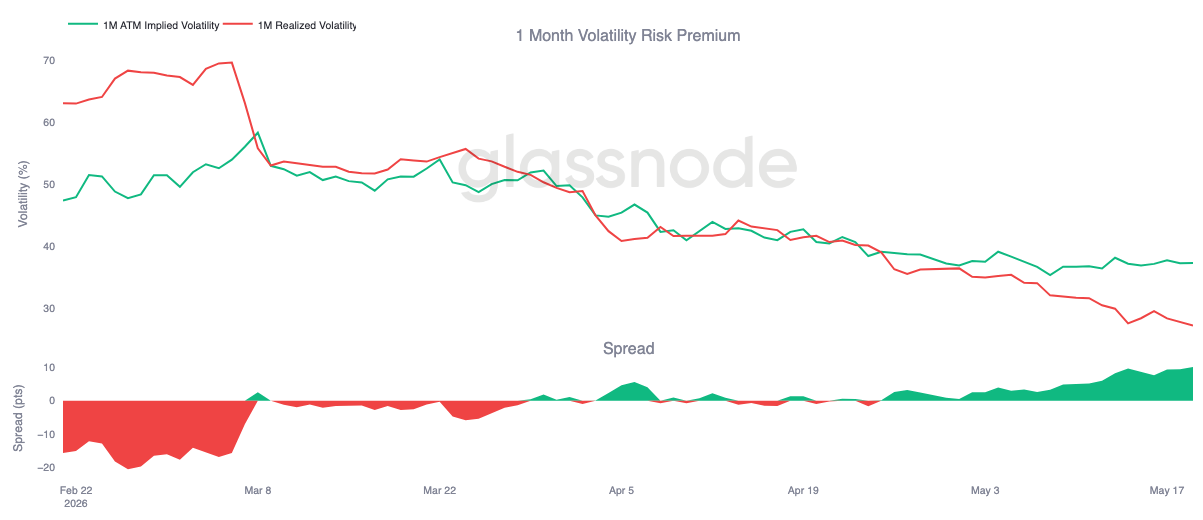
As implied volatility gently rebuilds, realized volatility continues its downward trend.
Bitcoin's 30-day realized volatility is currently at 27%, continuing its overall decline over recent weeks. Meanwhile, the 1-month implied volatility remains close to 37%, making implied volatility significantly higher than realized volatility.
This pushes the 1-month volatility risk premium back to around 10 volatility points, marking the highest levels in recent weeks. The right side of the chart shows a steady expansion, predominantly driven by the stabilization of realized volatility following spot movements rather than aggressive implied buying.
For hedgers, the key point is that despite the recent rebuilding of implied volatility, protective costs remain relatively low.
The current structure reflects a market where the pace of decline in realized volatility is outstripping the pace at which implied volatility is being re-priced downward, thus allowing the volatility risk premium to continue to expand.
25 Delta Skew Indicates Resurgence of Downside Demand
While implied volatility begins to gently rebuild, skew shows that traders are still mainly bidding for protection rather than upside exposure.
Bitcoin's 25 delta skew has become more bearish in the past week, with traders paying higher premiums for downside protection across various terms. This shift is most apparent at the front end, where the skew has increased from 2.7% to 6.2%, indicating a significant rise in demand for short-term put options.
Longer terms also show higher put premiums, although to a lesser extent, with the 6-month term still close to the 10% range. This indicates that the market is not only hedging short-term risks but also maintaining a broader preference for downside protection.
The current skew structure reflects a clear defensive tilt, indicating that despite relatively low implied volatility, short-term hedging demand is rebuilding.

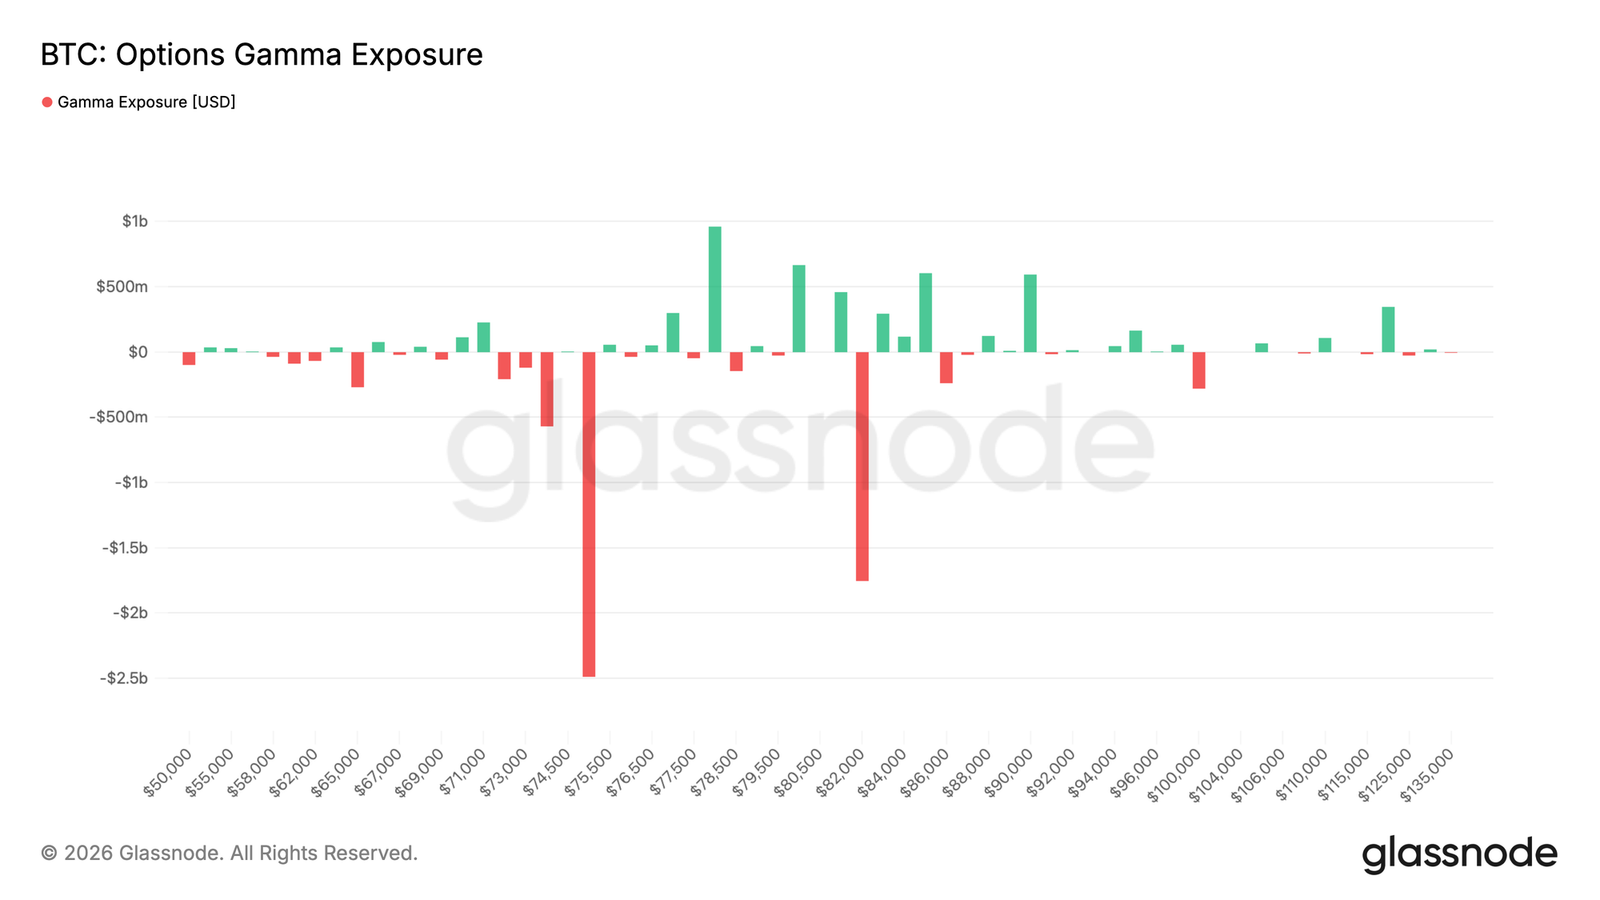
Gamma Exposure Shows Vulnerable Price Range
The largest short gamma cluster is near the $75,000 strike price, with approximately $2.5 billion in negative exposure positioned just below the current spot of $77,500. Another sizable short gamma cluster is still around $82,000, with exposure nearing $2 billion; however, there is approximately $2 billion in positive gamma dispersed across three strike prices above the spot, creating resistance before reaching the higher short gamma acceleration zone at $82,000.
This structure makes the spot market more sensitive to sharp downward moves near the major negative gamma strike at $75,000, and market makers' hedging flows could amplify weakness here. This accumulation is consistent with recent funding flow activity. Over the past 7 days, put option buying has accounted for 55.5% of taker premium flows, exceeding 90% in the last 24 hours, displaying a clear shift towards downside hedging.
The current gamma distribution reflects a more vulnerable structure, with concentrated demand for put options creating critical bands that could amplify volatility if the spot re-enters.
Conclusion
Bitcoin remains in a constructive structural position, but the latest positioning and flow data suggest that momentum is becoming increasingly selective beneath the surface. Institutional futures participation continues to warm up, and prices are holding resiliently above crucial support levels; however, broad spot demand has not yet fully accelerated again, especially in U.S. institutional venues.
Meanwhile, option positioning and volatility markets indicate that a more cautious environment is forming near current high levels. The combination of weaker total spot accumulation, softer ETF momentum, and renewed demand for downside hedging suggests the market is still searching for stronger catalysts that can sustain expansions above the $80,000 lows.
In summary, the broader trend remains constructive, but the latest data show that the market is increasingly driven by positions and derivatives activity rather than broad spot conviction. Bitcoin may continue to experience more volatile price movements within the current range until liquidity conditions improve further and stronger spot demand re-emerges.
免责声明:本文章仅代表作者个人观点,不代表本平台的立场和观点。本文章仅供信息分享,不构成对任何人的任何投资建议。用户与作者之间的任何争议,与本平台无关。如网页中刊载的文章或图片涉及侵权,请提供相关的权利证明和身份证明发送邮件到support@aicoin.com,本平台相关工作人员将会进行核查。


