Can this huge transaction volume turn into real income?
Written by: Changan, Amelia, Biteye content team
In the past, discussions about prediction markets focused more on their accuracy, trading volume, and whether they can become new information markets. However, when prediction markets take on a business form, the core question shifts: What does the profit model of prediction markets look like?
In the business world, high trading volumes do not equate to platform profitability. A market can have a large volume, and users can trade frequently, but if most transactions cannot be monetized or if activity is solely maintained by subsidies and points, then trading volume would only be aesthetic data rather than healthy revenue.
For prediction markets, the true test of their commercial capabilities is not "how many markets are opened," nor is it "how popular a particular event is," but whether the platform can seamlessly connect three aspects:
- The impulse to create real transactions;
- Maintaining sufficient depth in the order book’s liquidity;
- Converting the demand of active takers into fees.
This is also why the business model of prediction markets is by no means a simple "collecting taxes on openings." On the surface, it is just a YES / NO betting game, but what truly supports the platform's revenue base are the underlying transaction structures, liquidity mechanisms, fee biases, and user behaviors.
Especially as the leading platform Polymarket begins to systematically introduce taker fees, the narrative around prediction markets has shifted from "information tools" to "revenue validation."
This article will deeply dissect the underlying cards of prediction markets from a business perspective:
- How do prediction market platforms make money?
- Why does the maker/taker game structure determine the platform's survival?
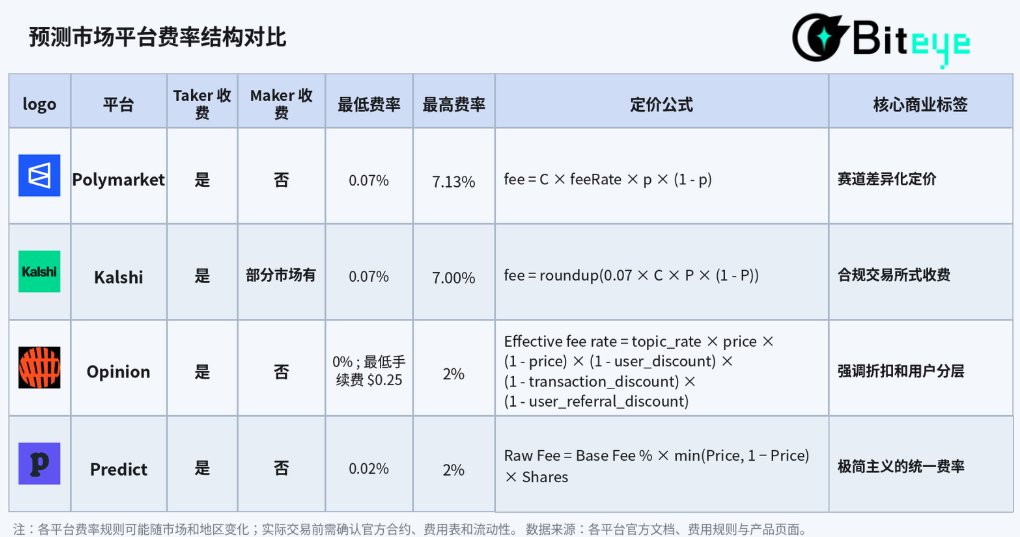
- What are the essential differences in fee structures among mainstream platforms like @Polymarket, Kalshi, @opinionlabsxyz, and @predictdotfun?
- Why is the highest trading volume market not necessarily the most profitable?
💡 Core conclusion: Prediction markets do not sell answers, they sell divergences.
The closer the price is to 50 / 50, the greater the market divergence and the stronger the impulse to trade, making it easier for the platform to convert active trades into fee income; the closer the price is to 0 or 100, the more certain the result, where information value remains but the corresponding fee weight significantly decreases.
Therefore, the true commercial barrier for prediction markets is not converting "events" into markets, but rather transforming "divergences" into trades and then robustly converting those trades into income.
1. How prediction markets make money: not by opening markets, but by turning divergences into fees
To dissect the cash flow of prediction markets, we must first clarify their four core revenue drivers. These intertwine to create a closed loop from traffic to monetization.
1️⃣ Trading fees - direct source of income
Most prediction markets charge the side that takes an active transaction, which is the taker. Because takers consume liquidity while makers provide it.
This means that not all transactions in prediction markets generate income. The transactions that truly contribute fees to the platform are often those where users are willing to transact actively and pay for speed and certainty.
2️⃣ Liquidity - foundation for ongoing trading
The most challenging aspect of prediction markets is not opening markets, but ensuring they have depth.
If no one is placing orders in a market, users won't be able to buy or sell, making it difficult to form effective prices even if the market has a topic.
Thus, many platforms will lower maker costs, even providing incentives for makers.
This is not a direct "source of income," but it determines whether trading fees can exist long-term.
No liquidity means no ongoing trading, and naturally, fee income cannot stabilize.
3️⃣ Information value - occupying the mind
What sets prediction markets apart from ordinary trading platforms is that they are not just trading tools; they also produce information.
When a market has sufficient trading volume and liquidity, its price becomes a probability signal. Media will quote it, KOLs will interpret it, traders will observe it, and regular users will use it to gauge market sentiment.
This aspect may not directly translate into fees, but it brings the platform attention, user perception, and external dissemination. In the long run, this informational value boosts trading demand.
4️⃣ User operations and discount systems - converting activity into income
Besides the basic trading fees, different platforms also implement discounts, invites, events, points, and rebates to increase trading frequency. These measures may not directly generate income but will affect the platform's long-term monetization ability. For example, Opinion offers user discounts, trading discounts, and invitation discounts; Predict.fun adopts a simpler basic fee and discount mechanism; Polymarket focuses on differentiated rates across various markets and maker rebates. The essence of discounts and incentives is not merely subsidies, but rather exchanging part of the profit for user retention, gradually converting activity into income.
2. Horizontal comparison of the fee structures of mainstream prediction market platforms
Looking across several mainstream prediction markets, the strategic direction of the industry is highly convergent: encouraging orders to provide liquidity and converting active transactions into revenue. However, due to different positioning, major platforms exhibit significant strategic differentiation in tactical execution.
1️⃣ Polymarket: refined pricing by market
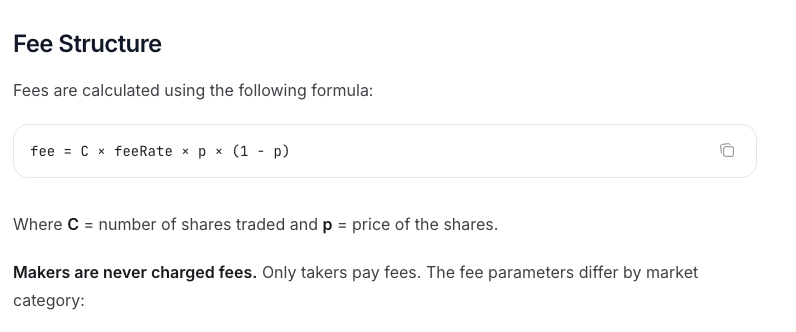
Polymarket’s taker fee logic combines “market differentiation” and “divergence pricing” to perfection. Its official core formula is:
fee = C × feeRate × p × (1 - p)
Where C is the number of shares traded, p is the transaction price, and feeRate is determined by the market category.
This mechanism includes two core variables:
- Market refinement: According to the current verified fee rate standards, the fee rate for the Crypto market is 0.07, Sports is 0.03, Politics/Finance/Tech is 0.04, and Culture/Weather is 0.05; some Geopolitics markets are at 0. In other words, Polymarket does not charge a uniform fee across all markets but uses differentiated rates based on transaction frequency, sensitivity, and users' willingness to pay in different categories.
- Divergence pricing: perfectly aligns with the mathematical curve of p × (1 - p). The closer the price is to 50/50 (the maximum market divergence), the higher the fee; the more certain the result (close to 0 or 100), the lower the fee.
https://docs.polymarket.com/trading/fees
2️⃣ Kalshi: closer to a compliant exchange model
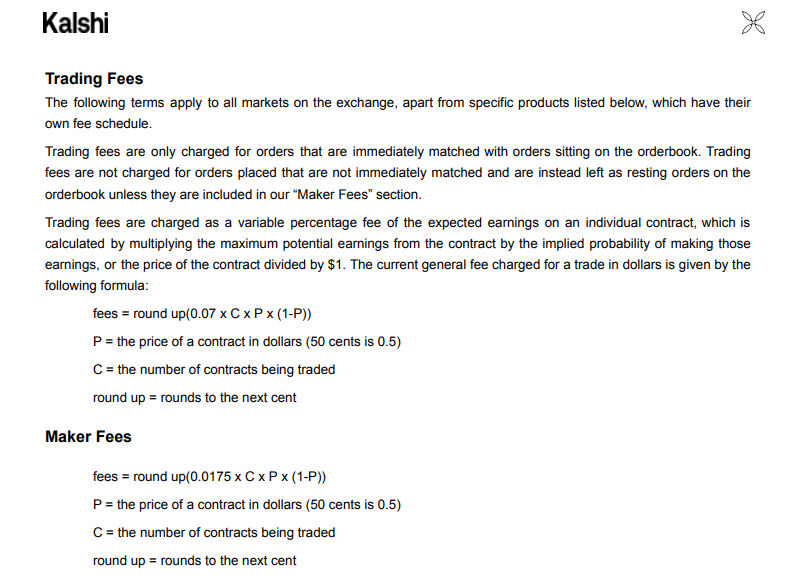
Kalshi’s fee design, within a compliant framework, resembles that of traditional financial derivatives exchanges; its regular taker fee formula is also linked to price divergence:
fee = round up(0.07 × C × P × (1 - P))
Where C is the number of contracts, P is the contract price, and fees are rounded up to the nearest cent. This structure is quite similar to Polymarket’s C × feeRate × p × (1-p).
Kalshi’s fee structure shares similarities with Polymarket: its trading fee is also related to contract prices; the closer they are to 50¢, the higher the fee; the closer to 1¢ / 99¢, the lower the fee. Kalshi’s fee schedule indicates that the taker fee for 100 contracts varies roughly between $0.07 and $1.75.
However, a significant difference between Kalshi and Polymarket is that some markets on Kalshi also have maker fees, charged only when these orders are filled; canceling orders incurs no fee. This indicates that Kalshi's fee structure is more akin to compliant exchanges: not simply giving makers eternal free access but setting more complex bilateral fee rules based on different markets.
https://kalshi.com/docs/kalshi-fee-schedule.pdf
3️⃣ Opinion: emphasizes discounts and user segmentation
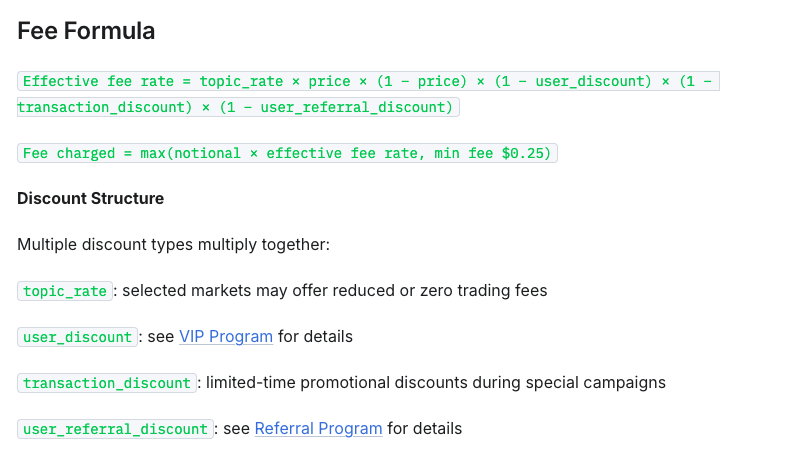
Opinion introduced a very complex "multi-dimensional discount system," with its effective fee rate formula as:
Effective fee rate = topic_rate × price × (1 − price)× (1 − user_discount)× (1 − transaction_discount)× (1 − user_referral_discount)
In other words, Opinion's fees depend not only on market price and topic_rate but are also affected by user discounts, trading discounts, referral discounts, and more.
Opinion also sets a minimum order of $5 and a minimum fee of $0.25 to prevent very low fees on small transactions.
This indicates that Opinion’s fee design leans more towards user operations:
- topic_rate is used to distinguish between different markets
- user_discount is used for user segmentation
Thus, compared to Polymarket’s "market differentiation pricing," Opinion treats fees more as an operational tool: guiding user trading, retention, and recruitment through discount systems, while simultaneously maintaining market liquidity by allowing makers free access to lower the order threshold.
https://docs.opinion.trade/trade-on-opinion.trade/fees
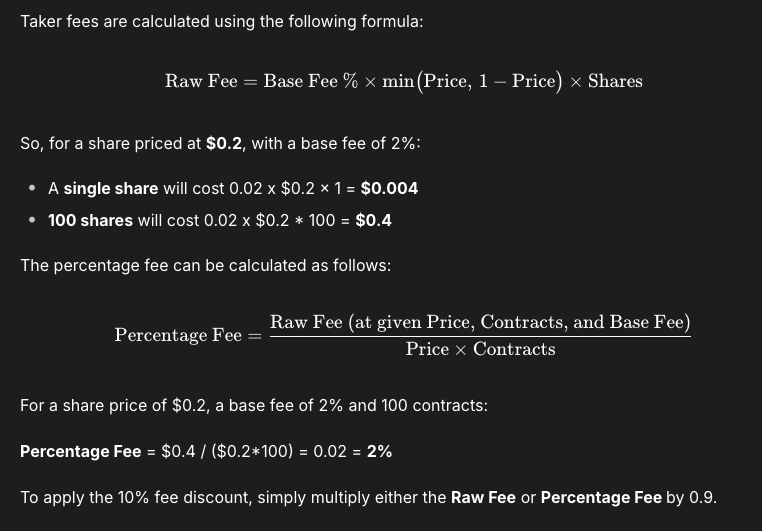
4️⃣ Predict.fun: minimalist unified rate
Predict.fun’s fee structure is relatively simpler, aimed at reducing user understanding costs.
According to its current public standards, its fee calculation formula is:
Raw Fee = Base Fee % × min(Price, 1 − Price) × Shares
Base Fee is currently set at 2%. The actual rate changes with the transaction price: below 50%, the rate is roughly fixed at 2%; above 50%, the closer the price is to 1, the lower the effective rate.
Additionally, Predict.fun supports fee discounts, which further lower transaction fees.
This design's characteristic is a more intuitive structure: users need not determine which side of the market they belong; they only need to focus on the transaction price to comprehend fee changes.
https://docs.predict.fun/the-basics/predict-fees-and-limits#limits
It is evident that the commonality among prediction market platforms is their endeavor to transform active trading behaviors into income.
This also indicates that the commercialization of prediction markets does not follow a single path. Ultimately, they all address the same question: Are users willing to pay for trading?
3. Deep Dissection of Polymarket: Trading volume does not equal real income
Although various platforms have diverse approaches, to validate the real monetization efficiency of prediction markets, Polymarket remains the most suitable observation platform sample.
There are two main reasons:
- It has the clearest fee path: from venturing into crypto, to expanding into sports, then almost comprehensive charging in more categories
- Its data is also more complete: official fee rates and 7D / 30D fees can be used to further dissect the revenue structure
Thus, let us use Polymarket as an example to answer a more specific question: Is the market with the highest trading volume also the most profitable?
3.1 From free to charged: Polymarket's commercialization timeline
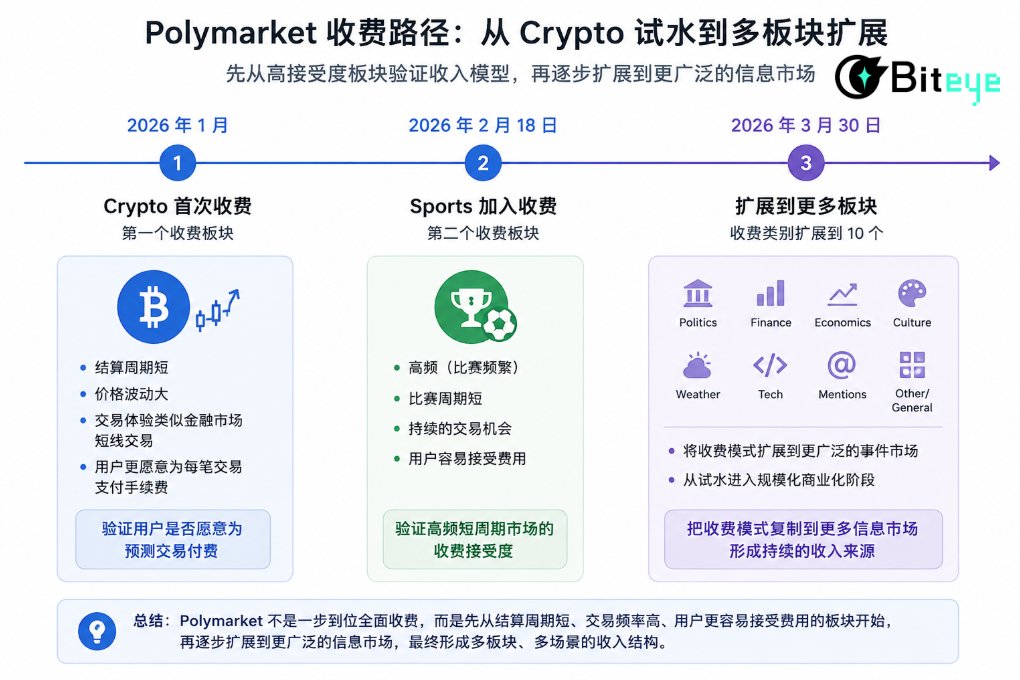
January 2026: Crypto becomes the first charging category
Polymarket re-enters the US market for users, introducing taker fees in the crypto sector. The settlement cycle for crypto markets is short, prices fluctuate greatly, and trading behaviors resemble secondary short-term trading; users' pursuit of liquidity speed far exceeds their sensitivity to friction costs, making it an ideal testing ground for fee implementation.
February 18, 2026: Sports becomes the second charged category
Following this, on February 18, 2026, the sports sector becomes the second charged category. Sports markets naturally possess high-frequency, short-cycle characteristics, providing continuous trading scenarios. Thus, charging for sports is a natural continuation.
Therefore, Polymarket first charges for crypto and sports to validate the revenue model in two categories with higher user acceptance.
March 30, 2026: Charges expand to more categories
On March 30, 2026, Polymarket expands taker fees to politics, finance, economics, culture, weather, tech, mentions, other/general, and more categories, bringing the total fee categories to ten.
After comprehensive charging, Polymarket does not simply charge the same fees across all sectors but adopts a more refined fee structure. This step can be seen as a key node in Polymarket's commercialization as it begins to extend the charging model to broader markets.
The effectiveness of comprehensive charging is striking. According to the latest data, Polymarket showcases a remarkable ability to attract funds: 7D fees have reached $9.27 million, and 30D fees amount to $36.3 million. Its seven-day revenue has entered the top six among all crypto projects, officially transitioning into a revenue-generating project tier.
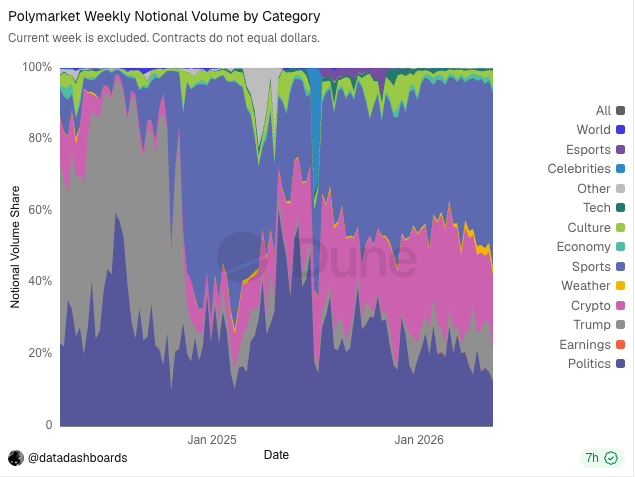
3.2 Core market type and price distribution dissection
To calculate Polymarket’s real income across various sectors as accurately as possible, we estimated the fees of five main sectors using Polymarket trading data from 2021 to February 2026.
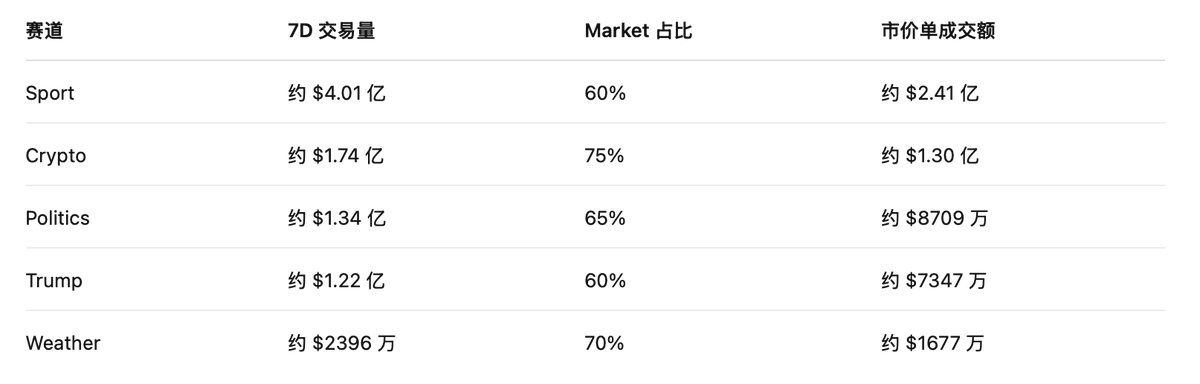
In terms of the proportion of market orders, the five sectors show significant differences:
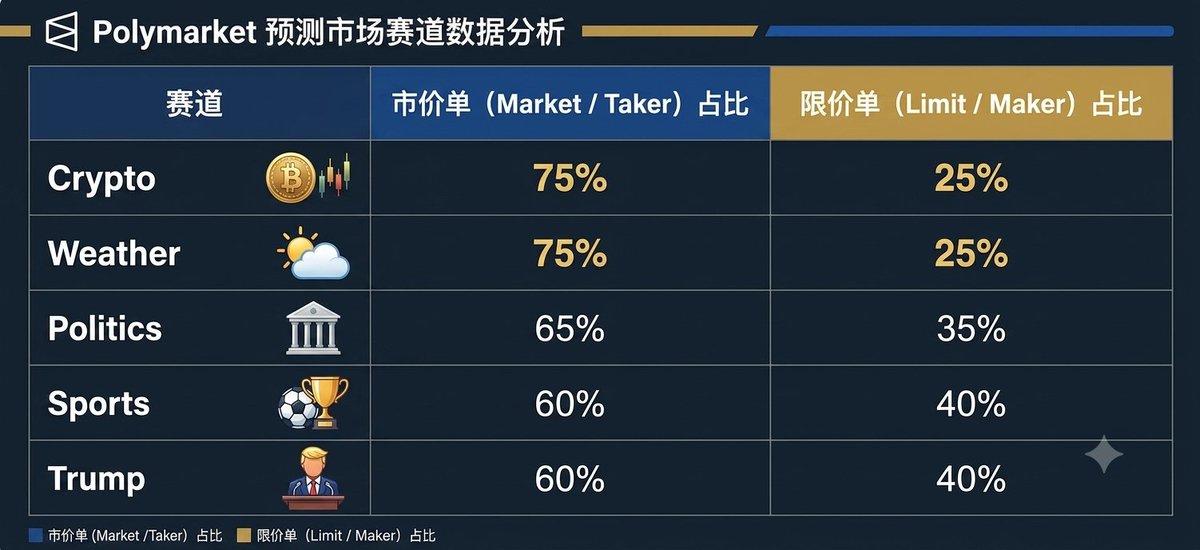
Crypto has the highest market order proportion, reaching 75%, which aligns with the characteristics of crypto assets being "rapidly changing;" users tend to secure profits directly with market orders; the weather market is similarly driven by real-time unexpected weather data, emphasizing the importance of swift reactions.
Furthermore, the amount of fees heavily depends on the price range of market transactions.
This is because transactions that fall within fee standards do not incur the same fees. Polymarket's fees are related to p × (1 - p); the closer the price is to 50/50, the greater the divergence in the market, leading to higher fee weights. Conversely, the closer the price is to 0% or 100%, the more certain the result becomes, resulting in lower fee weights.
From the data of the five main sectors, most transactions concentrate around 30~50, particularly in the 40~50 range:
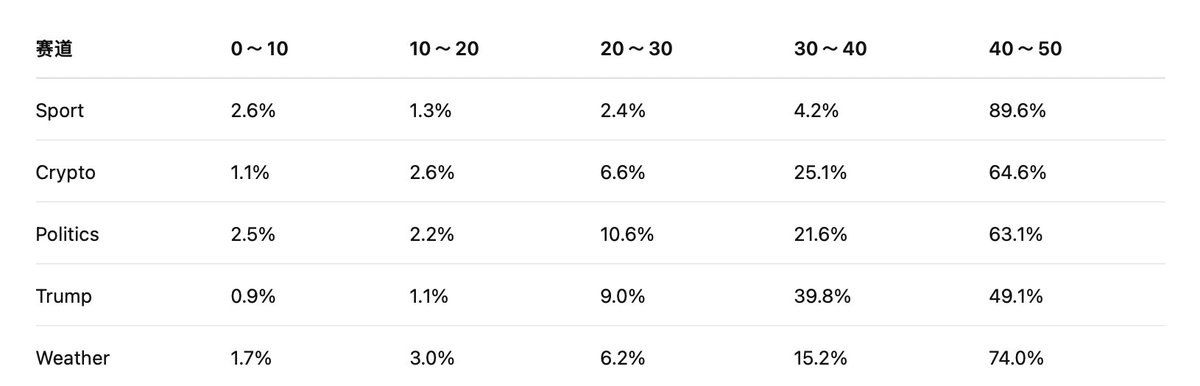
This data indicates that Polymarket’s major transactions do not occur when results are nearing certainty but are concentrated in markets where significant divergence still exists.
3.3 Income estimation: Who is the profit cow?
We roughly estimated Polymarket’s fee income in the five sectors by using the Market transaction volume and applying the corresponding fee rates alongside the price range weights for p × (1-p). We also considered that post-charging, some users sensitive to rates would shift from takers to limit orders. This especially applies to users engaged in end-of-day trading, low-odds arbitrage, or frequent short-term trades who would be more cautious in calculating returns.
Thus, we can make a more conservative assumption based on the initial estimation: assuming that after fees are introduced, market transaction volumes decrease by 20%.
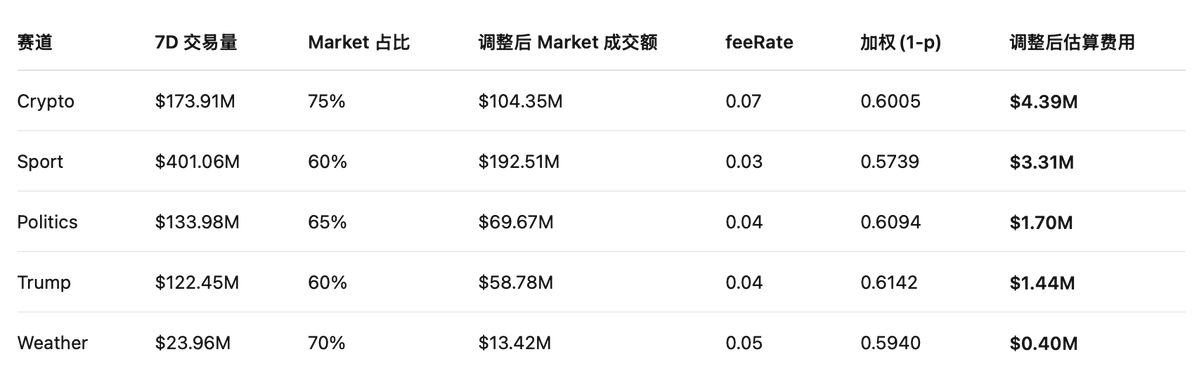
The adjusted formula becomes:
Estimated adjusted fees ≈ Market transaction volume × 80% × feeRate × (1 - p)
Based on the 7D total trading volume and the proportion of each sector's trading volume, we estimate the 7D market transaction volumes for the five main sectors.
Having calculated the market order volumes for each sector, we can now estimate the fees by combining each sector's fee rate and price range weights. To ensure more robust calculations, we use the median of ranges as the approximate price:
(Note: due to statistical standards, historical order type lag, and dynamic changes in markets, this calculation model aims to reflect the contribution ratio of each sector, and the total may exhibit reasonable errors compared to actual fees settled by the system)
What do the data indicate?
1️⃣ Crypto is currently the highest profit contributor sector, with 7D estimated fees around $4.39 million, making it the "profit cow."
This is somewhat counterintuitive, as by trading volume, Sports is the largest sector, with a 7D trading volume of approximately $401 million, higher than Crypto's $174 million. Yet, in terms of fees, Crypto ranks first; the main reasons are twofold:
Market order proportion is higher: Market orders constitute about 75%, which is significantly higher than Sport’s 60%. Polymarket mainly charges market orders, so Crypto has more trades entering the fee standards.
Fee rate is the highest: the fee rate is 0.07, while Sport only has 0.03. Even if the market order transaction volumes are the same, the fees generated per Crypto transaction will be significantly higher.
2️⃣ Sports provides the second largest source of fees, with 7D estimated fees around $3.31 million, serving as the "transaction volume base."
The advantage of Sports is that its trading volume is sufficiently large, with 7D trading volume around $401 million, ranking first among the five sectors. However, its weakness is evident: the fee rate is the lowest, at only 0.03.
3️⃣ Politics and Trump, if combined under political markets, have estimated 7D fees around $3.14 million, which is very close to the Sports sector, acting as a pulse-driven flow funnel.
Political markets exhibit strong event-driven traits. Unlike Sports with stable daily matches or Crypto with persistent price fluctuations, they can experience concentrated trading during elections, polls, policy changes, or candidate statements. Therefore, although the trading pace in political markets may not always be stable, they can contribute significantly during hot cycles.
4️⃣ Weather has 7D estimated fees around $400,000, the lowest among the five sectors.
Thus, Polymarket's income structure can be summarized simply: Crypto is responsible for platform revenue, Sports for transaction volume, while Politics/Trump drives spikes in interest, capturing customers for the platform.
4. From Polymarket to four concluding judgments on prediction market sectors
Polymarket's successful closed loop offers restructuring insights for the entire prediction market sector:
1️⃣ A comprehensive overhaul of assessment indicators
In the past, prediction markets focused on trading volume and trending topics. Entering the era of commercialization, the metrics for measuring success will completely shift to: real fees, taker proportions, order book depth, and bid-ask spreads. Relying solely on volume generated through internal trading will be hard to sustain under a charging mechanism.
2️⃣ Different event types correspond to different income roles
Future prediction market platforms will not rely on one type of market to dominate but will head towards refined specialization.
Markets like Crypto are closer to financial trading, with rapid price changes and short feedback cycles, making users more sensitive to transaction speed, resulting in higher revenue efficiency.
Sports resemble stable revenue streams, with frequent matches, clear results, and continuous trading scenarios, thus suitable for contributing daily trading volumes.
Markets like Politics/Trump are more prone to explosive events, lacking stability, but when key junctures like elections, polls, and policy changes arise, they can witness concentrated volumes.
Markets like Weather demonstrate that as long as events are standardized enough and outcomes sufficiently clear, they can form their own trading scenarios even if their scale is temporarily small.
3️⃣ Charging mechanisms will reverse pressure the quality of markets
During the free phase, platforms might launch numerous markets; after charging, users and market makers will begin to calculate costs carefully, and the fee mechanisms will invert to filter out market quality.
A good prediction market not only needs engaging topics but also must satisfy several conditions:
- Clear outcomes for easy settlement
- Frequent information updates to incite price changes
- Significant market divergence to motivate user trading
- Sufficient liquidity for users to be willing to transact actively
- Outcomes that are hard to manipulate
4️⃣ The barrier of prediction markets lies in "sustained pricing power."
Opening a YES / NO market is easy; the harder part is maintaining a continuously active market where orders are frequently placed, prices are updated, and risks are willingly undertaken. Only when a market has sufficient depth and transaction frequency can its prices hold referential value, allowing the platform to gain revenue.
Thus, the real barrier for prediction markets is not “who can discover trends faster,” but rather: turning trends into tradeable markets 👉 ensuring the market has long-term liquidity 👉 allowing prices to become signals that the external world is willing to reference.
5. In conclusion
Numerous projects can tell grand narratives, but those that can turn narratives into tangible income are few and far between.
Polymarket was once the most illustrious representative of traffic in the entire sector, and as it completes its transition from "traffic narratives" to "systematic income generation," it aims to prove something to the entire industry:
The ultimate value of prediction markets is not limited to "how accurately they predict the future," but rather in their successful transformation of real-world uncertainties into a super market that can be standardized, traded frequently, and sustain profits.
In the past, prediction markets demonstrated their ability to garner enormous traffic; now, they are proving themselves to be an unrivaled great business.
1 Calculation method: Separate the market order and limit order proportions for each sector, then estimate the impact of p × (1 - p) on fees based on different price ranges, and finally calculate how much each sector roughly contributes in fees based on their corresponding rates.
免责声明:本文章仅代表作者个人观点,不代表本平台的立场和观点。本文章仅供信息分享,不构成对任何人的任何投资建议。用户与作者之间的任何争议,与本平台无关。如网页中刊载的文章或图片涉及侵权,请提供相关的权利证明和身份证明发送邮件到support@aicoin.com,本平台相关工作人员将会进行核查。


