Author:Jeff, IOSG
Abstract
The core data of bot panic in prediction markets is quite intuitive: wallets that seem to be bots on Polymarket account for 5% of the accounts but contribute 75% of the trading volume. 823 wallets have each netted over $100,000 since January 2025, withdrawing a total profit of $131 million from Polymarket. Among the top 20 wallets by profit, 14 are classified as bots (Stacy Muur leaderboard inspection). A study from the University of Toronto (covering 2.4 million users, with a trading volume of $67 billion since 2022) found that 68.8% of users are in a state of loss, and the top 1% of users have accounted for 76.5% of all profits.
The narrative derived from this is: prediction markets are a wealth redistribution machine, and bots are its operators. The data is accurate, but the framework has some bias.
Key Points
1. The core flaw of the bot narrative is equating "concentration of trading volume" with "capital plunder." The contribution of 5% of wallets on Polymarket to 75% of the trading volume only indicates the distribution of account activity and does not directly imply that retail investors' funds are being extracted by bots.
2. Data at the group level is more persuasive. AI agent wallets have an average return of about 37%, while human wallets receive only 7%-13%. The 3-4 times gap at the group level is genuine evidence of structural advantage; additionally, of the top 20 wallets by profit, 14 are bots (Stacy Muur leaderboard inspection), which represents the right tail projection of this distribution and is not independent evidence.
3. The advantage of bots lies in structural dimensions rather than judgment dimensions. The three types of markets dominated by bots—price delay arbitrage, real-time sports game state automation, and cross-platform combination arbitrage—share the characteristic of not requiring judgment on the real-world events themselves. Once market outcomes depend on the comprehensive processing of multi-source information, the advantage of bots is systematically weakened.
4. The category structure of Polymarket has shifted from "politics 42%" to "sports 50%" over the past 12 months, with the category showing the fastest growth being long-cycle event markets where the bot structure is not dominant, indicating a clear trend towards overall retail participation on the platform.
5. Forward-looking judgment: The proportion of bots will continue to increase as deployment costs decrease, but the scale of capital extraction from humans by bots will peak before the proportion of bots peaks—due to the speed of mutual erosion among bots being faster than their erosion of human accounts.
6. Investment strategy: Ownership opportunities at the platform level (Kalshi + Polymarket combined share of over 97%) are essentially closed; value opportunities are shifting towards the L2 agent infrastructure layer (Olas / Valory model) and the venue-agnostic intermediate layer, while C-end bot products and L3 data/pricing layers lack venture-fit.
1. Market Size Exceeds Bot Panic
Three quantitative anchors define the scope of this report's discussion.
First, Bernstein revised its prediction for the 2026E market size of prediction markets to $240 billion on April 14, 2026, with the path to $1 trillion by 2030 becoming a consensus on the sell-side.
Second, the combined YTD trading volume of Kalshi and Polymarket surpassed $60 billion in mid-April 2026, exceeding the annual total of $51 billion for the entire year of 2025.
Third, Robinhood launched over 1,000 Kalshi contracts, with the platform's 1 million+ customers cumulatively trading 9 billion contracts. Robinhood's prediction market business has an ARR of about $350 million, $150 million for the entire year of 2025, and an estimated $586 million for 2026, making it the company’s fastest-growing product line.
The above data points to one conclusion: prediction markets are no longer a purely crypto-native track, but rather resemble a TradFi distribution issue. The "retail investors being plundered" group assumed in the bot narrative is not composed of crypto users but rather retail investors entering through traditional brokerage channels.
Thus, we can deduce the contextual bias of bot panic: the market is not automated to extract value but rather has mainstream finance injecting flow at a pace far exceeding any automated extraction speed.
2. The Truly Important Data: 37% vs. 10%
The most cited data point within the bot narrative suffers from sample selection bias.
The data set indicating "14 bots among the top 20 by profit" is based on a small sample sorted by profit. This sample can only reflect the occupation situation of bots on the right tail of the distribution and cannot be used to infer the superiority or inferiority at the group level.
Group-level data (source: Polystrat / Valory disclosure, cross-verified with multiple on-chain analysis data from Polymarket):
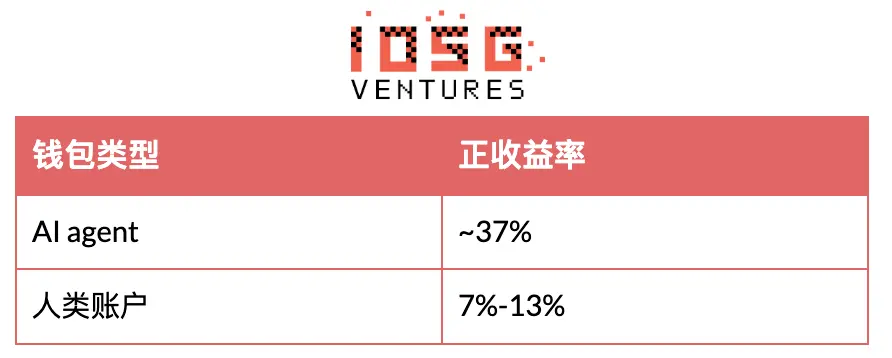
The 3-4 times difference in win rates at the group level is the genuine manifestation of bots' structural advantage. The statistic of 14/20 in the profit ranking should be understood as downstream performance of that win rate distribution rather than independent causal evidence.
3. Where Bots Excel in the Market
The extraction scale of bots is highly concentrated in the following three types of markets. The commonality among them is that they do not require subjective judgment on real-world outcomes, relying instead on delays or pricing advantages related to the platform matching engine.
Price feeding delay arbitrage
Representative case: Wallet 0x8dxd made $313 to $437,600 in January 2026 by trading 15-minute BTC rise and fall contracts, with a win rate of 98%.
Strategy principle: Monitor the spot prices on Binance and Coinbase, and enter positions when Polymarket's quotes lag behind CEX. Polymarket introduced a taker fee for 15-minute crypto contracts on January 7, 2026 (with a peak near 3% probability at about 50%), specifically neutralizing this strategy. The wallet's cumulative win rate has since dropped to 54.7%.
Conclusion: The advantage of bots in price-feeding markets is real but is confined to extremely narrow time windows and is significantly compressed by the introduction of friction costs by the platform.
Real-time sports game state automation
Data source: Polymarket wallet classification by the cancun2026 team (Dune query 6648075, https://dune.com/queries/6648075, past 7 days, as of 2026-05-11).
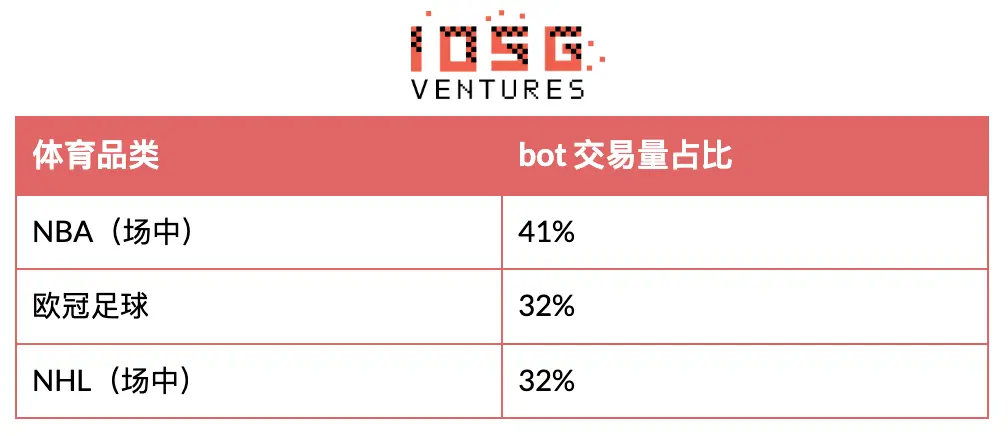
Source of advantage: Bots react to events in sporting venues significantly faster than retail investors using live streams (30-second delay). Furthermore, trading terminals like Kreo and PolyCop, through copy-trade and automatic order-following features, allow non-programmer users to benefit from this advantage, hence the measured bot share includes human funds routed through bots.
Cross-platform combination arbitrage
Data source: IMDEA Networks paper "Unravelling the Probabilistic Forest: Arbitrage in Prediction Markets" (AFT 2025, dspace.networks.imdea.org/handle/20.500.12761/1941).
The research covers approximately $40 million in arbitrage extraction on Polymarket from April 2024 to April 2025, primarily consisting of two patterns: one is the rebalancing of YES/NO shares within the same market; the other is cross-platform combinations (entering when buying YES on Polymarket and NO on Kalshi, with the implied probability summing to less than $1). This model has rigid requirements for multi-platform infrastructure and compresses as each platform’s matching engine converges.
4. Areas of Human Account Success and Their Limitations
Categories with the lowest proportion of bots do not imply "retail picking more accurately" but rather indicate "the profitability of these markets depends on the ability to synthesize multi-source real-world information," which is an area where automation continuously places humans at a structural disadvantage.
Two independent studies corroborate this judgment.
Joshua Della Vedova's on-chain behavior study (University of San Diego, jdellavedova.com) indicates: the frequency of retail picking correct results is higher than that of bots; the advantage of bots lies in execution—when retail buys YES at $0.72, the bot has already entered at $0.55, profiting $0.17 per share.
A working paper from the University of Toronto / HEC Montréal / ESSEC (Akey et al., SSRN 6443103, March 18, 2026) points out: 56% of losing users' order prices fall into extreme ranges (10¢ or > 90¢), while only 28% of the top 0.1% profitable users place orders in extreme ranges. Typical behavior of losing users is "chasing a small probability at 5 cents for a 20 times payoff" or "chasing certainty at 95 cents". Profitable users typically build positions in the middle of the probability curve.
Together, the two studies suggest: Retail judgment capabilities are generally underestimated, but timing and order structuring are systematically weaker.
5. Forward Path: Four Forces Determine the Direction of Bot/Human Landscape
The key variable in the next 12-24 months is not the current proportion of bots/humans but their direction of evolution. This report identifies four forces, which do not act consistently.
Bots' deployment costs further collapse
Coding agents like Claude Code and Codex, open-source frameworks like Hermes, and Polymarket’s own open-source framework (Polymarket Agents under MIT License) together reduce the engineering threshold for strategies like 0x8dxd from "serious projects" to "weekend prototypes." Copy-trade services further connect human capital to bot infrastructure, mechanically amplifying measured bot share.
Bot individual profitability is eroded by competitors
The 823 profitable bot wallets are part of a larger group of losing bots on the right tail. The increase in the number of wallets using similar strategies means that each bot's profitable window narrows. The 98% win rate of 0x8dxd is structurally non-reproducible—not due to inefficient vanishing but rather due to competition and platform fee adjustments. The capital extraction scale of bots from humans is likely to peak before the proportion of bots peaks.
Platform category structure shifts towards retail investors
Polymarket's category structure in April 2026: Sports 50%, Crypto 24%, Politics 16%, Others 10%. In the same period of 2025: Sports 29%, Crypto 12%, Politics 42%.
The absolute trading volume in sports increased by 11 times year-on-year. The added volume mainly lies in long-cycle event markets, where retail has an absolute advantage. Bernstein projects that the proportion of sports in market trading volume will drop from the current 62% to 31% by 2030, being filled by economic, political, and corporate event contracts—this structural shift will further expand the exposure of categories where bots are not dominant.
Different platforms disperse naturally by category
Hyperliquid’s HIP-4 launched on May 2, 2026, offering daily BTC binary contracts, zero opening fees, USDH collateral, and a unified mechanism for perpetual/spot markets (1 million HYPE per slot, worth approximately $42.76 million at current prices).
This is a typical example of a market type with a bot advantage being separately launched. Day-1 trading volume mainly comes from arbitrage capital, aligning with the historical distribution of BTC binary contracts. If HIP-4 subsequently expands to sports and political markets and integrates trustworthy oracles, its bot share may converge to Polymarket levels; at the current stage, its role is to isolate bot-friendly flow onto an independent platform, leading Polymarket’s category structure further toward retail.
6. Platform Landscape and Valuation Snapshot (Mid-2026)
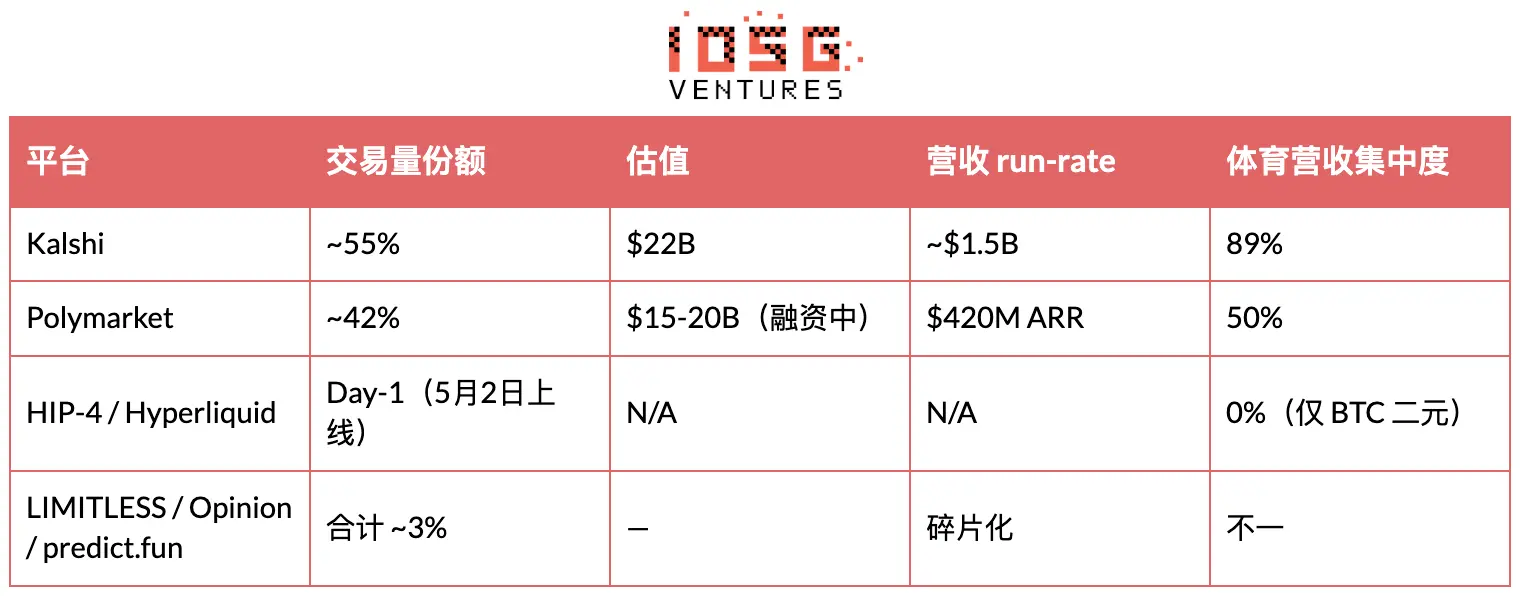
▲ Source: Bernstein note (April 14, 2026), Polymarket / Kalshi public disclosures, HIP-4 launch announcement
Conclusion: Kalshi + Polymarket combined share exceeds 97%, and the equity opportunities at the platform level are essentially closed for venture-check size. Investable value is shifting towards the upper (trading terminals, quantitative strategy services, agent infrastructure) and lower (capital efficiency, arbitration, oracle) sides of the platform layer.
7. Risk Warning
Risk 1: Regulatory tail risks. Three bills submitted by Schiff (DEATH BETS Act, Public Integrity Act, Prediction Markets Are Gambling Act), the TRO against Kalshi from Nevada, and criminal charges in Arizona in March 2026 constitute a tug-of-war between federal and state levels. The 89% concentration of sports revenue at Kalshi exposes it to the greatest risk, as sports or war/death contracts face realistic probabilities of an overall category ban.
Risk 2: Oracle and arbitration failure risk. Polymarket has integrated Chainlink to handle price-type markets since 2025, but subjective-type markets still rely on UMA. UMA's current token economy generates only about $600,000 in annual economic flow, corresponding to an FDV of $37 million; after MOOV2, proposer rewards have been narrowed to about 37 whitelisted addresses, most of which are affiliates of Polymarket. Any high-profile, controversial ruling may trigger a reevaluation of trust in the entire sector.
Risk 3: Sports proportion reversal risk. There is seasonality in the growth of Polymarket's sports business for 2026 (driven by NBA, NFL Super Bowl). If sports share retracts, the overall dynamic of "increased bot share + retail expansion" could reverse.
8. Implications for Builders and Investors
The bot competition is essentially a question: in Bernstein’s projected $240 billion prediction market in 2026, which layer captures value? There are four layers, each with differing value densities.
L1 — Agent trading products. Strategy advantages are diminishing, and C-end automated trading bears compliance risks. This layer is not recommended for standalone bets.
L2 — Agent infrastructure (Olas / Valory model). A toll-based economic model where any winning agent can collect fees. This layer is the cleanest investable option.
L3 — AI-native data, pricing, market creation. Mostly absorbed by platform internal teams or taken by existing Web2 incumbents (Kensho, Bloomberg, Dataminr). The remaining investable window is narrow.
L4 — Arbitration and resolution. Current economic flow is real but small in scale. To be a Tier 1 venture target, a token model redesign is needed, which is currently not in the public roadmap.
The edge layer worth tracking includes:
- PM-DeFi composability (Morpho collateralizing PM positions, currently 2x leverage, roadmap for 4-5x, affecting capital efficiency)
- Trading terminals and copy-trade services (Kreo, etc.)
- PM-native quantitative institutions
- New market primitives (impact markets, futarchy, conditional markets)
Conclusion: Bots Win Categories, Humans Win Markets, Platforms Win Structures
Bots have not taken over prediction markets. Bots are saturated in specific market types, and any platform's bot-to-human trading volume ratio is essentially a downstream result of that platform's market type composition. The headline data of "5% wallets / 75% trading volume" confuses trading volume concentration with capital plunder. The main driver of Polymarket's growth in 2026 comes from the sports market, where bots are structurally non-dominant, and the $131 million extraction by bots primarily occurs in short-window crypto markets, where retail participation is low.
Future winning platforms will need three capabilities: to host multiple types of markets under trustworthy arbitration conditions, to accommodate both bot and human traffic in appropriate proportions, and to retain cross-category users. Polymarket currently occupies this position: Bitget's Q1 2026 research shows that multi-category users are exhibiting an organic growth trend, with the average number of categories per user increasing from 1.45 to 2.34, and active days from 2.5 to 9.9.
Bots remain within their structural advantage range; the human capital operating bots will continue to migrate to the next event; ultimately, the platforms that can accommodate both types of traffic across the most market types at appropriate ratios will prevail.
免责声明:本文章仅代表作者个人观点,不代表本平台的立场和观点。本文章仅供信息分享,不构成对任何人的任何投资建议。用户与作者之间的任何争议,与本平台无关。如网页中刊载的文章或图片涉及侵权,请提供相关的权利证明和身份证明发送邮件到support@aicoin.com,本平台相关工作人员将会进行核查。


