
Author: Rhythm
On Wall Street, the "TACO trade" is outdated, and now everyone is discussing a new trading model -- "NACHO".
Since the US-Israel airstrike on Iran on February 28, the Strait of Hormuz has not reopened. Now, oil prices have risen over 50% compared to pre-war levels, and the Federal Reserve's expectation for interest rate cuts in 2026 has been reduced from two before the war to currently zero times. At the same time, the S&P 500 has reached a historical high, rising for six consecutive weeks, the longest winning streak since 2024.
Wall Street has named this seemingly contradictory market state NACHO, which stands for "Not A Chance Hormuz Opens," indicating that there is no possibility of reopening the Strait of Hormuz. It is the antonym of TACO (Trump Always Chickens Out), which bets on "people will hesitate", expecting Trump to back down at crucial moments. NACHO bets that "things will stagnate", believing that Hormuz cannot be reopened with just a Truth Social post.
eToro market analyst Zavier Wong described this shift: "During most of the crisis, every ceasefire headline would trigger a sharp fall in oil prices, with traders constantly betting on a solution that never arrives. NACHO means that the market acknowledges that high oil prices are not a one-time shock, but a reality of the current market environment."
Two Lines in Early April
March 23 was the critical point when the TACO model became ineffective. On that day, Trump proclaimed on Truth Social that he had had "very good constructive dialogue" with Iran and ordered the Pentagon to pause strikes on Iranian energy facilities for five days. The S&P 500 futures rebounded nearly 4% from the lows in just a few minutes, instantly adding $1.7 trillion in market value. Brent crude oil fell from $109 to $92 during trading.
Then, Iran officially denied the existence of dialogue. According to Iranian state media, a "senior security official" claimed this was a manipulation tactic and that no dialogue had ever occurred. The gains were halved within two hours, with the S&P closing at only +1.15%, and Brent rebounding to $99.94.
This was the first time in the past 14 months that Trump's "backing down" was no longer effective on the market. The reason is not complicated; in the TACO model, backing down is one-sided and can be fulfilled with a single post. The backing down on March 23 needed Iran's cooperation. When the opponent does not cooperate, backing down becomes a lie.
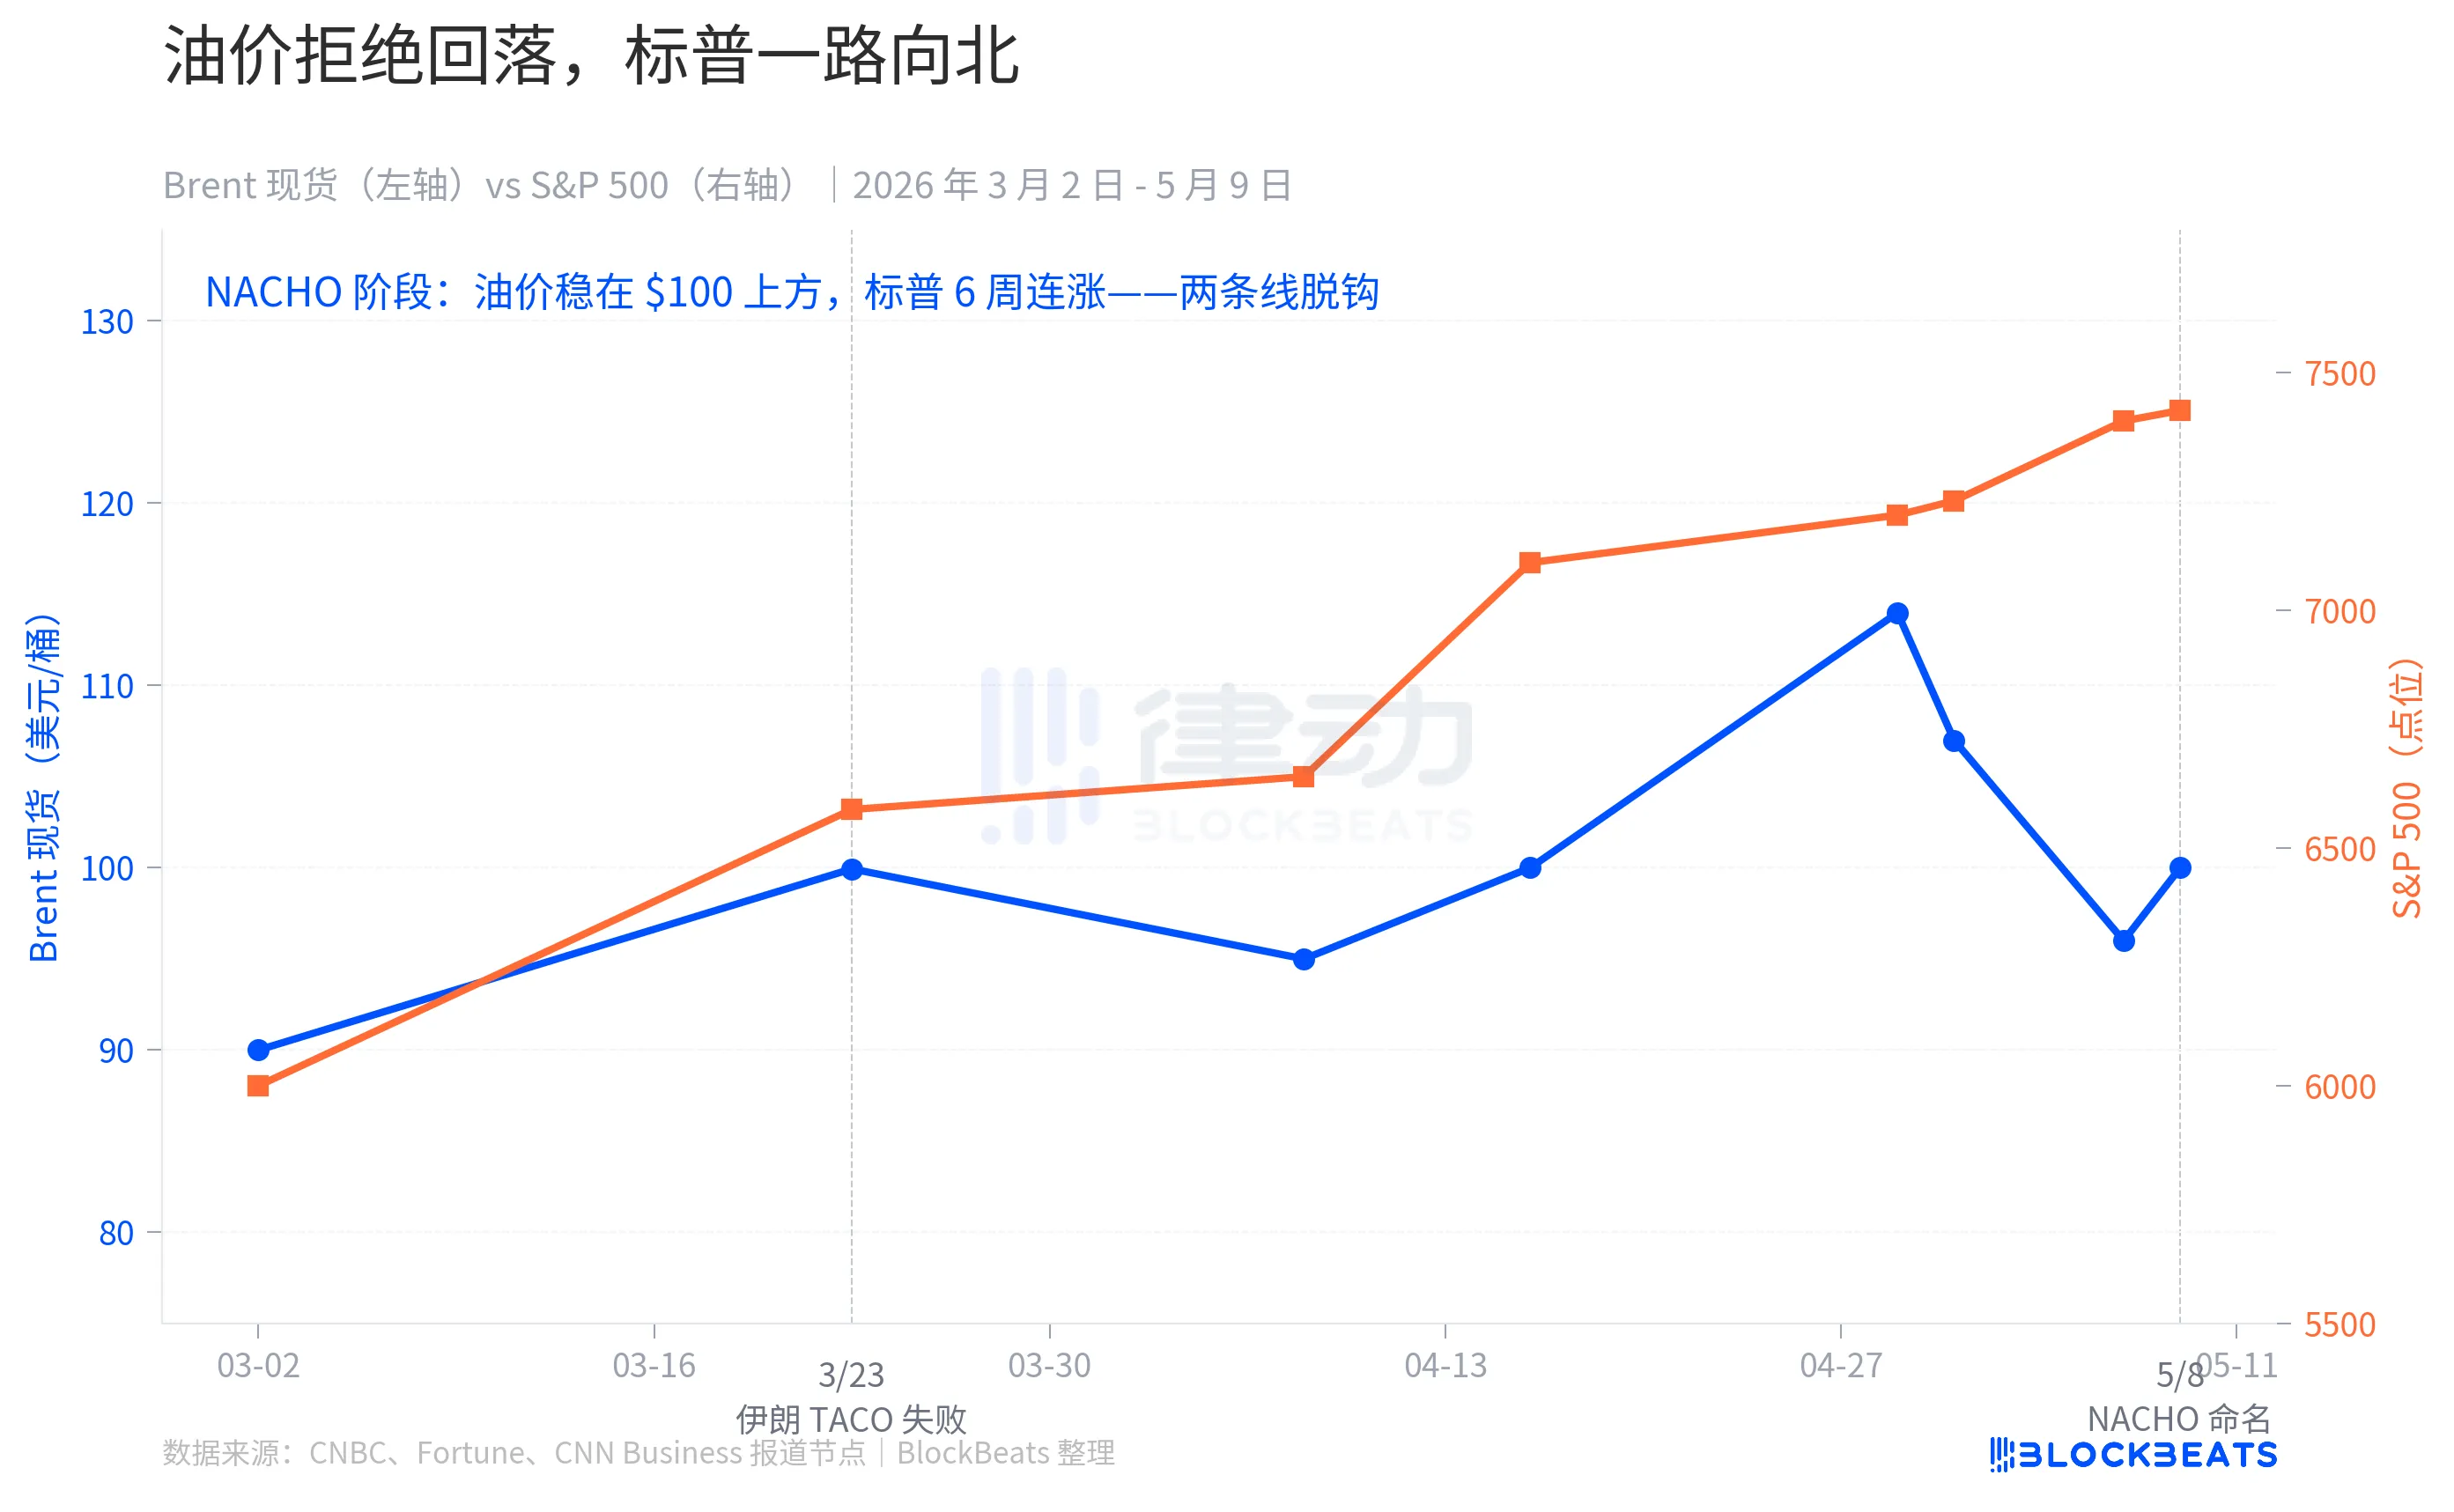
From that day on, market behavior underwent a fundamental change. Brent crude oil never returned to the pre-war level of $67 in the following six weeks, and the average price in May remained at $109.57. During this time, there were ceasefire agreements between the US and Iran on April 7 and 8, oil prices returned to "early war levels" on April 17, and news of a near agreement between the US and Iran emerged on May 7, but each "ceasefire headline" failed to bring oil prices back to baseline levels.
But the S&P kept climbing. It rose 10% in April, the strongest month since November 2020, setting seven intraday historical highs during this period. On May 1, it surpassed 7,230 points during trading, closing at 7,398 points on May 7.
The two lines completely decoupled in early April. During the TACO era, they moved in the same direction, with threats leading to declines in oil prices and the S&P, and backing down resulting in rebounds for both. In the NACHO era, they express two different narratives, with oil prices saying "the Strait of Hormuz is completely closed," while the S&P says "not my concern."
Three Markets, Three Reactions
NACHO is not just talk; it is the same bet being placed with real money across three independent derivatives markets.
The first layer is insurance. According to historical data from the Strauss Center, the war insurance rate for the Strait of Hormuz peaked at 3.5% of the hull value during the US invasion of Iraq in 2003, and during the peak of the "Tanker War" in the Iran-Iraq War of 1984, attacks on the Yanbu Pride tanker reached 7.5%. The baseline for this round of crisis was between 0.125% and 0.25%. By early May, this rate had risen to the 1% range, with some types of coverage soaring to 3% to 8%.
Converted into the insurance cost for a single ultra-large crude carrier (VLCC) making a single passage, the fees have jumped from about $250,000 pre-war to between $800,000 and $8 million currently. The role of insurance companies is to price the risks, and the real significance of this layer is that if insurance companies refuse to underwrite, ship owners will not take on the risk of navigating without coverage; the "physical reopening" and "actual navigation" of the Strait are two different matters.
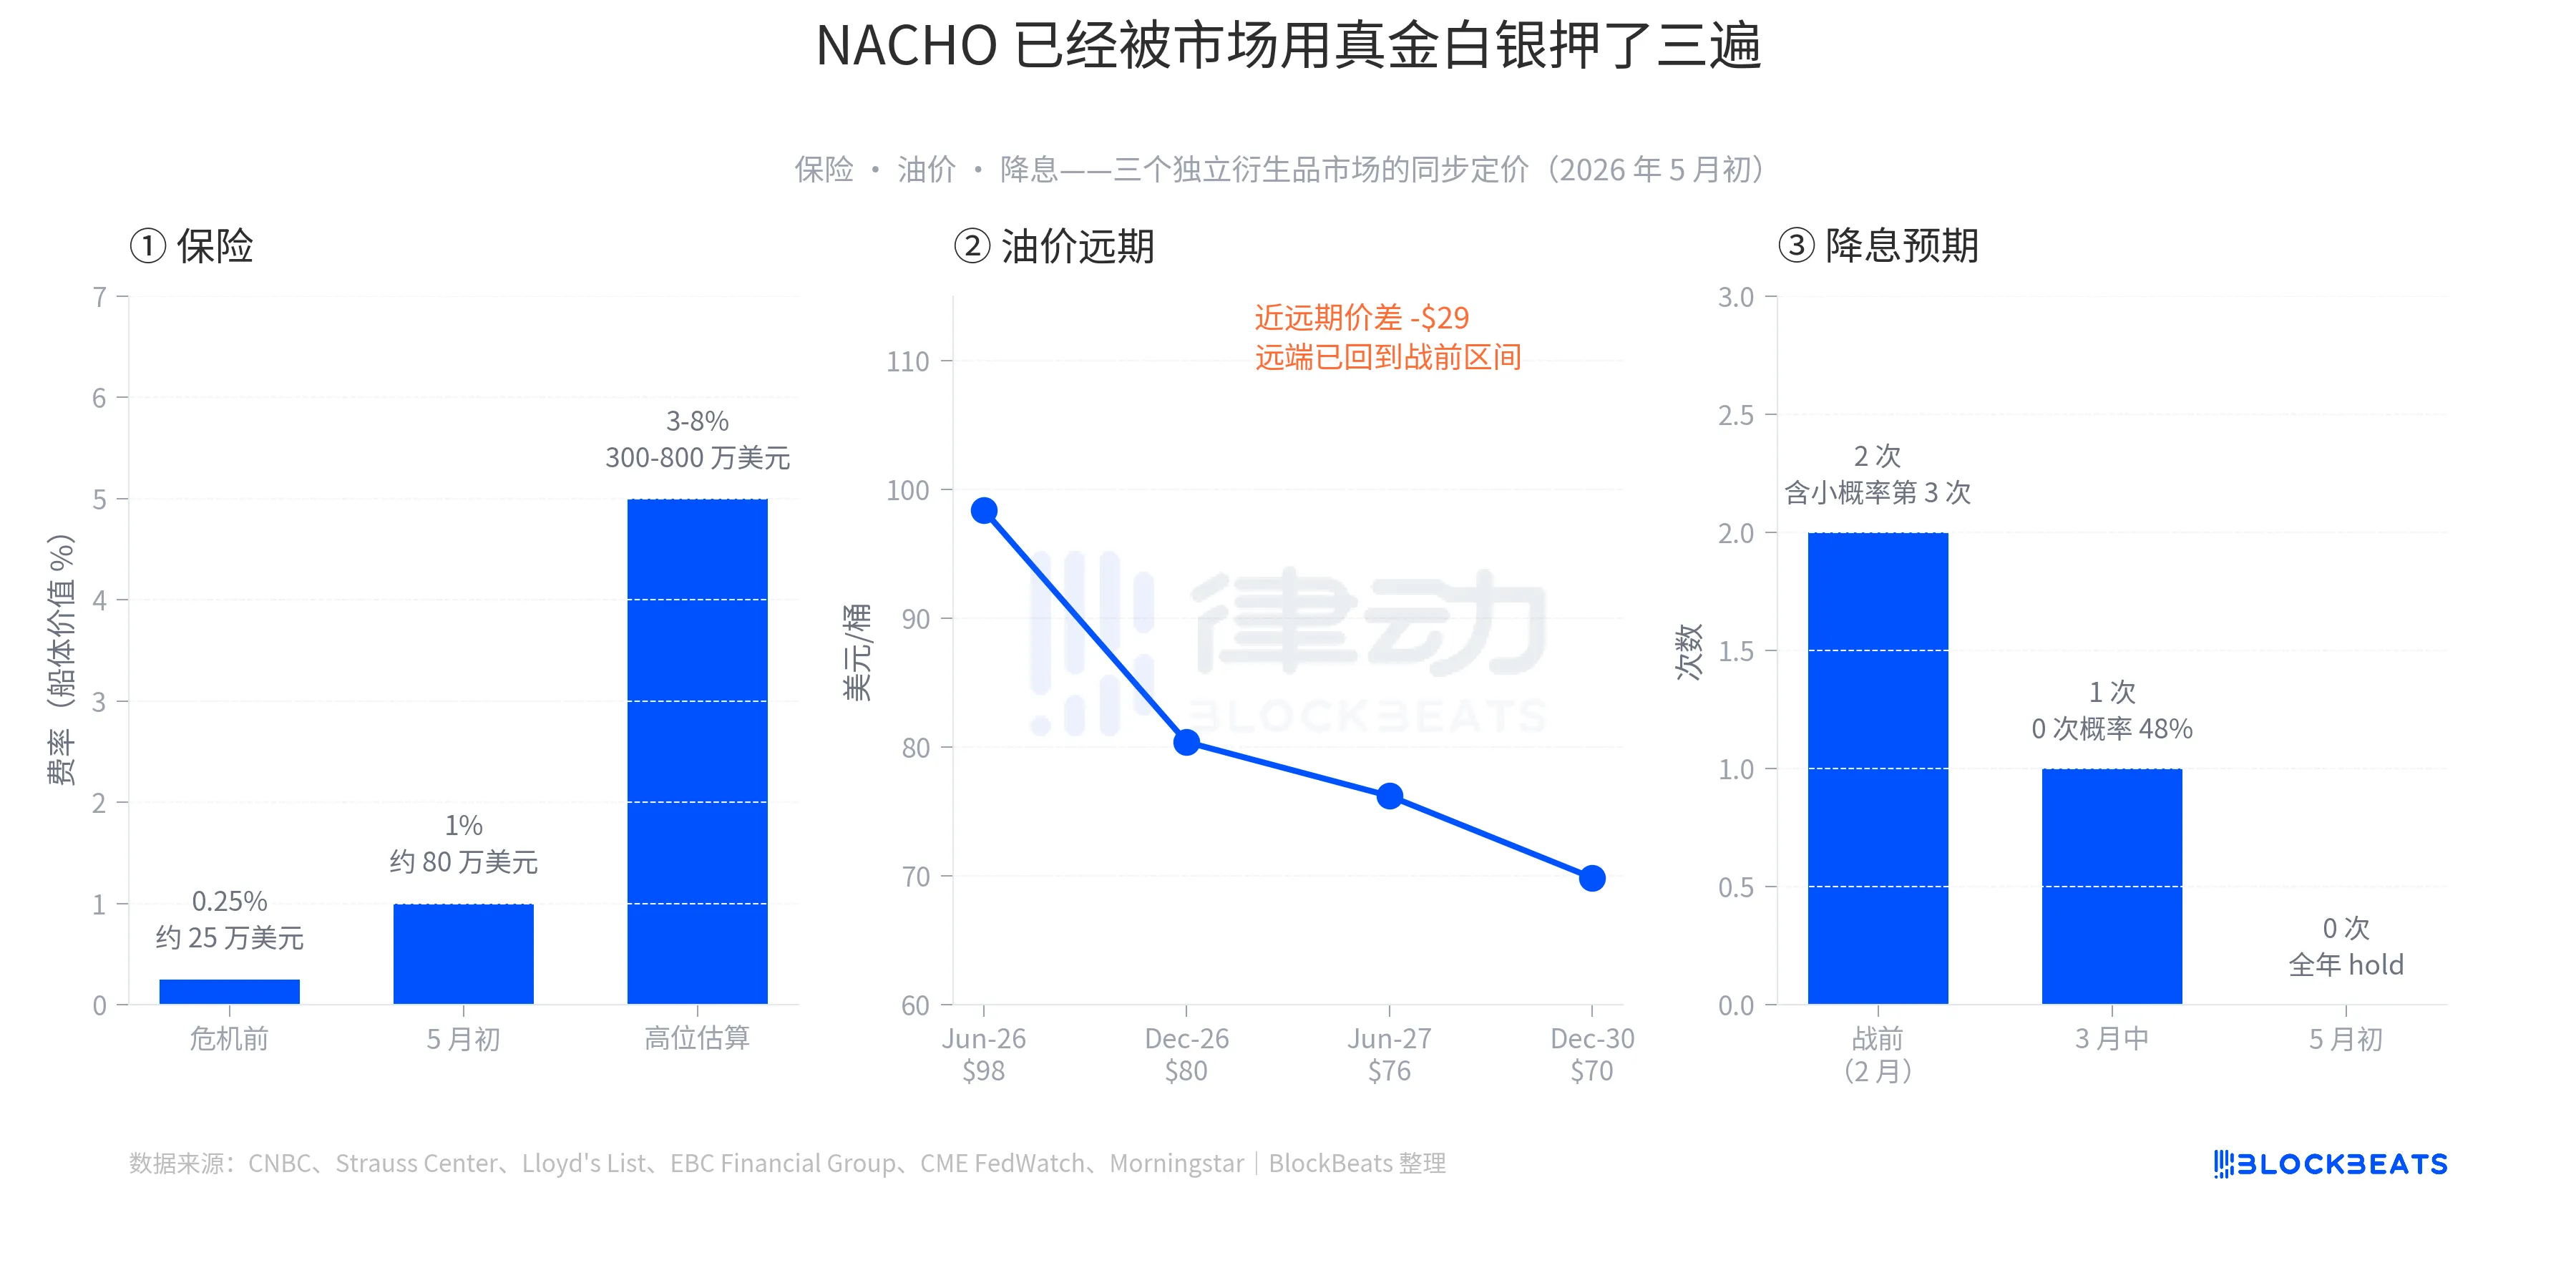
The second layer is oil prices. Early May data showed that the Brent Jun-26 contract was priced at $98.41, Dec-26 at $80.39, Jun-27 at $76.20, and Dec-30 at $69.85. The price difference between the near-dated contracts and Dec-30 is about $28.5, one of the steepest backwardation (near high, far low) structures in the past five years. This curve tells a very specific story: the market believes that the spot tightness will eventually ease, bringing distant prices back into the pre-war range of $60 to $70. In other words, high oil prices are not the end game; they represent a bounded window of time. But this window is long enough for traders not to bet on its sudden end.
The third layer is interest rate cuts. In early February 2026, the market expected the Federal Reserve to lower rates twice during the year, with a slight chance of a third cut. After oil prices surged in mid-March, the likelihood fell to one cut, and the probability of no cuts rose to 48%. On April 29, the Fed maintained its rate at 3.50% to 3.75%, and on May 6, CME FedWatch indicated a 70% probability of holding rates steady in June, with the market pricing in zero rate cuts for 2026. Hedge fund legend Paul Tudor Jones even stated in an interview with CNBC on May 7 that "Wash has no chance of getting the Fed to cut rates."
All three layers have left their imprint in the derivatives market, not as narratives, but as real money.
Divided Market
The second less visible detail of NACHO is that internally, it has created differentiated pricing within the broader market.
As of the close on May 7, the energy sector ETF (XLE, State Street's Energy Select Sector Fund) had risen 31.63% year-to-date, making it the only major sector to rise for the entirety of 2026. During the same period, the S&P 500 increased approximately 24%. The transportation sector ETF (IYT, iShares U.S. Transportation Fund) only gained 8.79%, underperforming the market by over 15 percentage points.
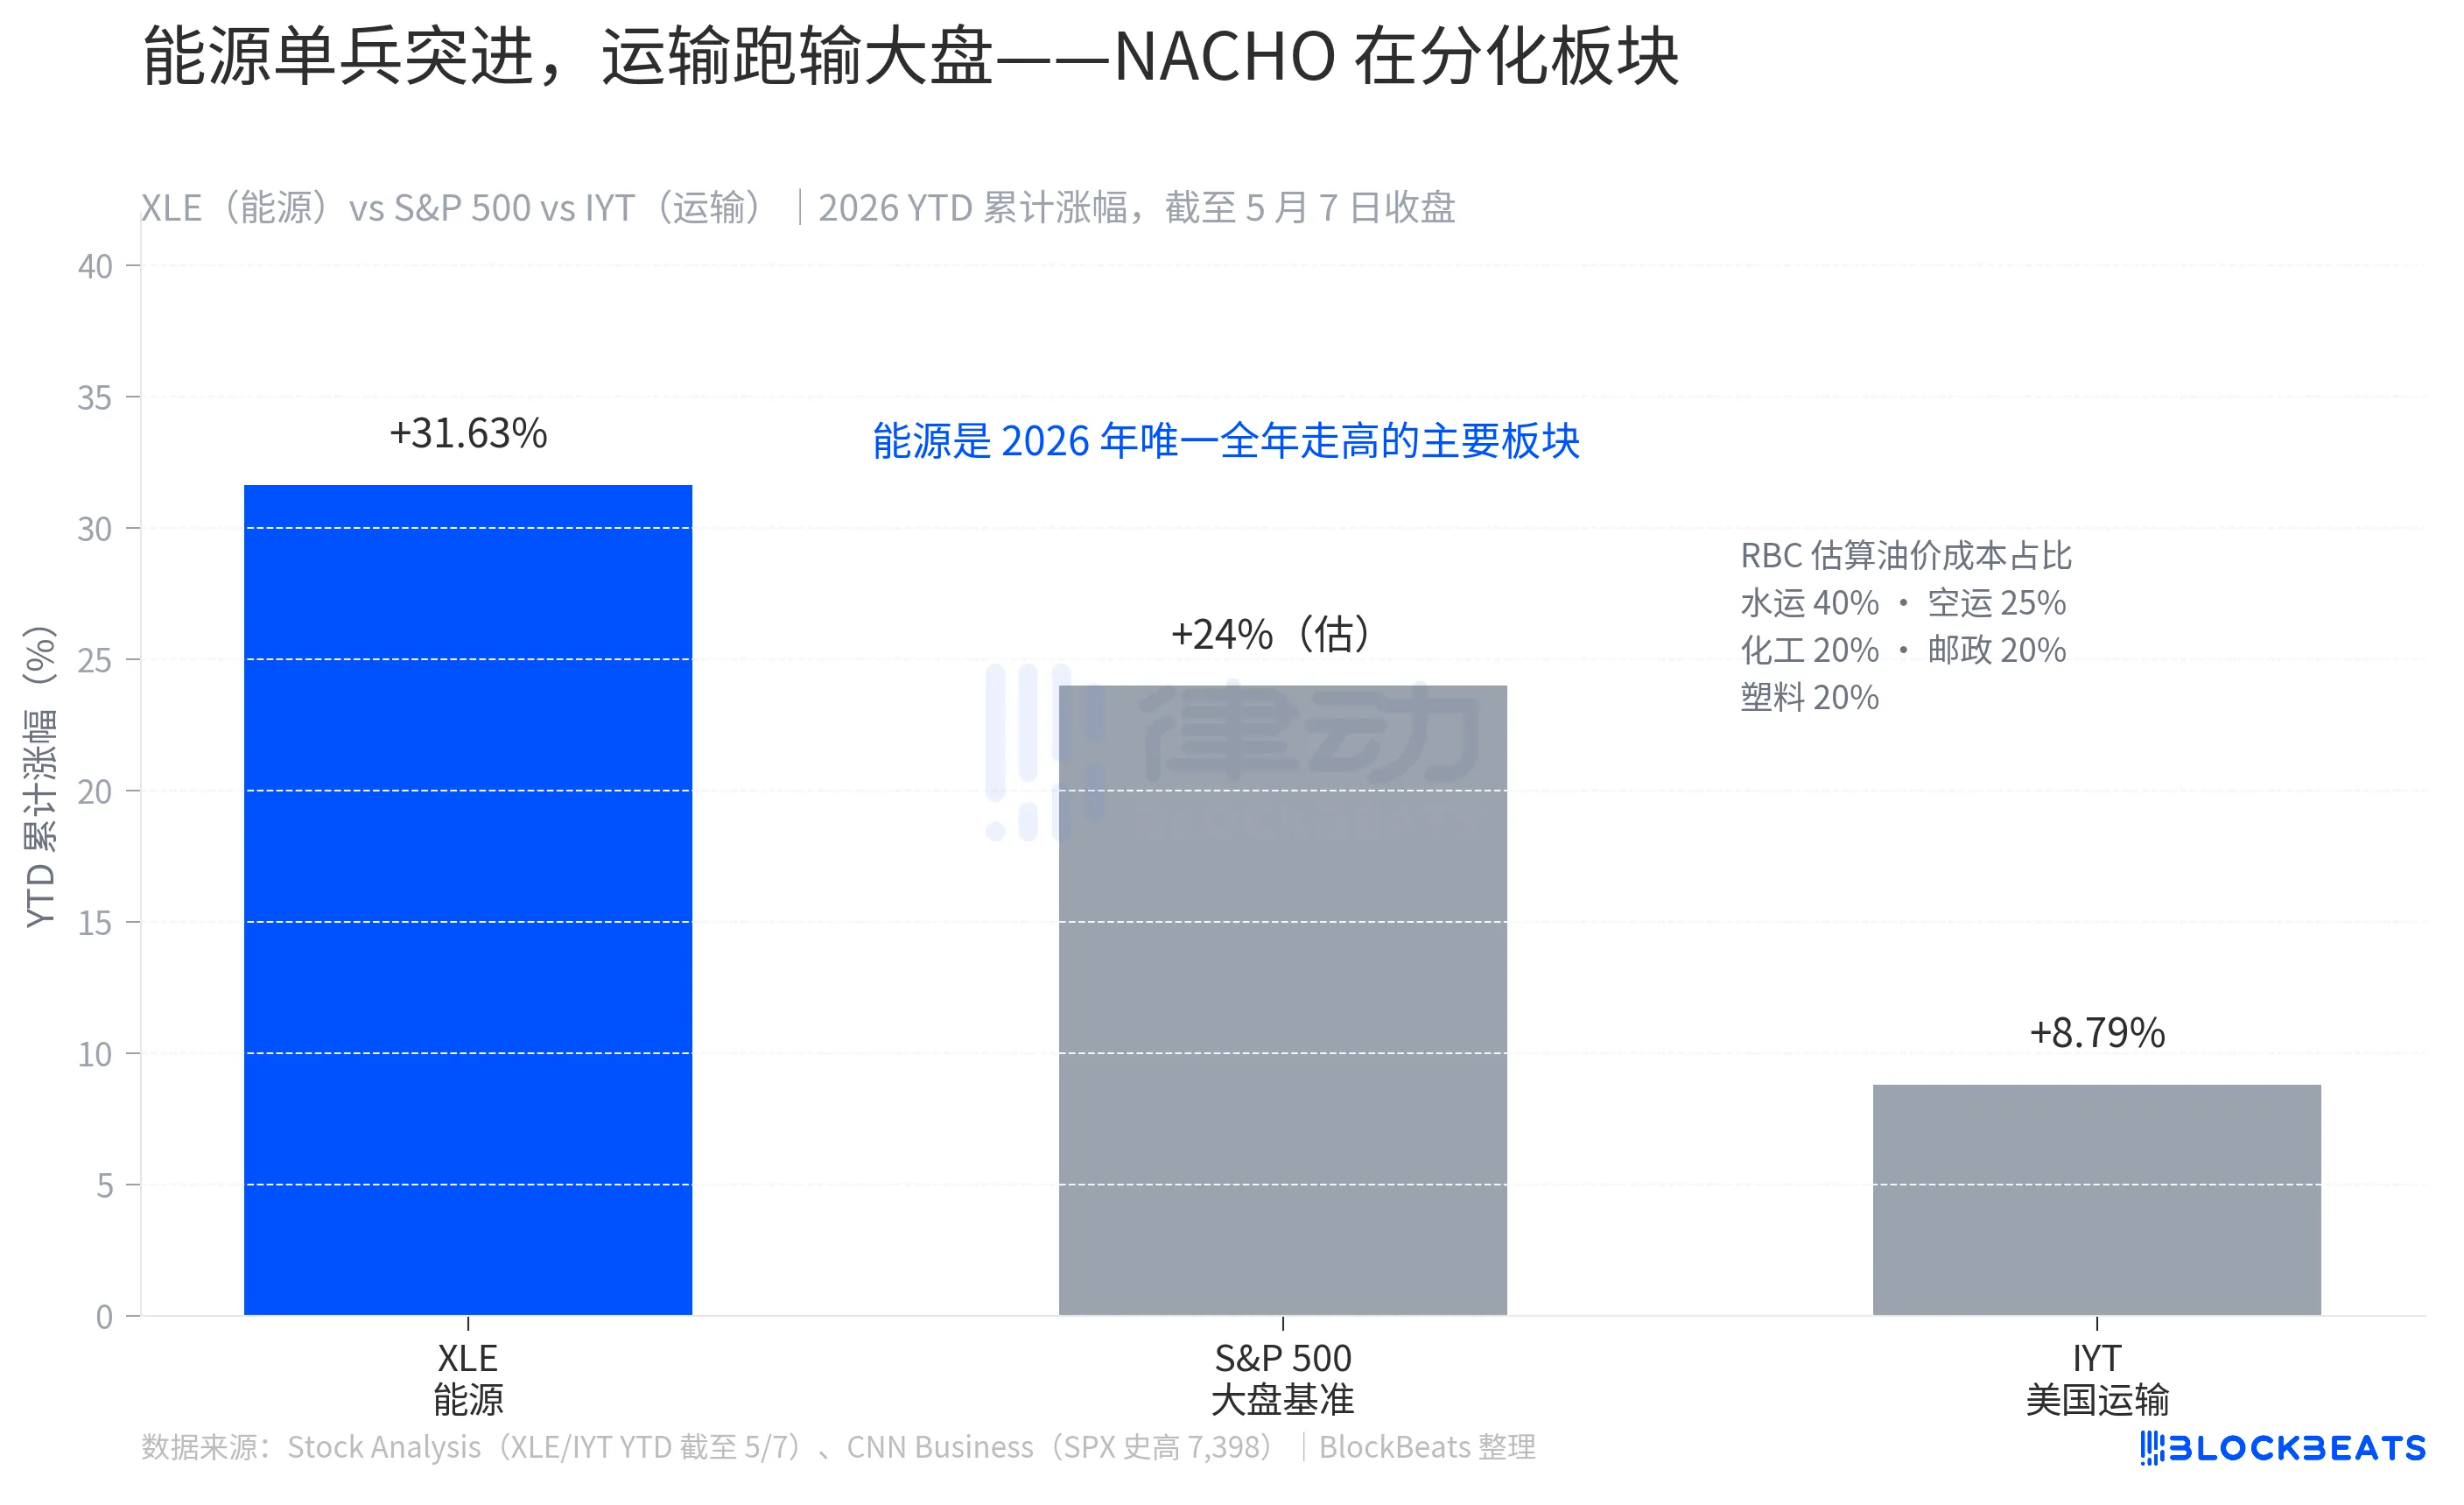
This gap is not random. According to the Royal Bank of Canada Capital Markets, 40% of the operating costs in the shipping industry are fuel costs, 25% in air transport, and 20% each in chemicals, postal express, and rubber plastics. If oil represents a major cost in your business, NACHO hits you directly in the face.
The 31.63% increase in XLE is not a short-term rebound but the result of an 8-week continuous outperformance. The 8.79% increase in IYT is not weakness, but rather a result of following the broader market while being squeezed by oil prices on profits. The market has clearly told readers how to calculate the odds for NACHO; just a glance at how much the transportation ETF has underperformed the broader market is enough.
However, NACHO is not an indefinite bet; it has a very specific deadline—June 1.
According to estimates from JPMorgan's commodities research team, global commercial oil inventory was approximately 8.4 billion barrels at the beginning of 2026, but only about 800 million barrels are "actually usable", with the remainder being pipeline fills, tank bottoms, and minimum terminal storage necessary to maintain systemic operations. Since this round of crisis, 280 million barrels have already been used, leaving about 520 million barrels of usable inventory. JPMorgan's exact wording is, "Commercial inventories are expected to approach operational pressure levels in early June."
"Operational pressure levels" is a specific physical concept. JPMorgan explained, "The system does not collapse due to oil disappearing but collapses when the distribution network no longer has enough workload." Once this line is crossed, the choices for enterprises and governments are limited to two: either squeeze the minimum inventory that must be maintained (which would damage the infrastructure itself) or wait for new supplies. If Hormuz does not reopen by September, OECD commercial stocks could drop to the so-called "operational floor". According to Fortune, European jet fuel stocks are expected to fall below a 23-day supply threshold in June, which is a critical warning line for the industry.
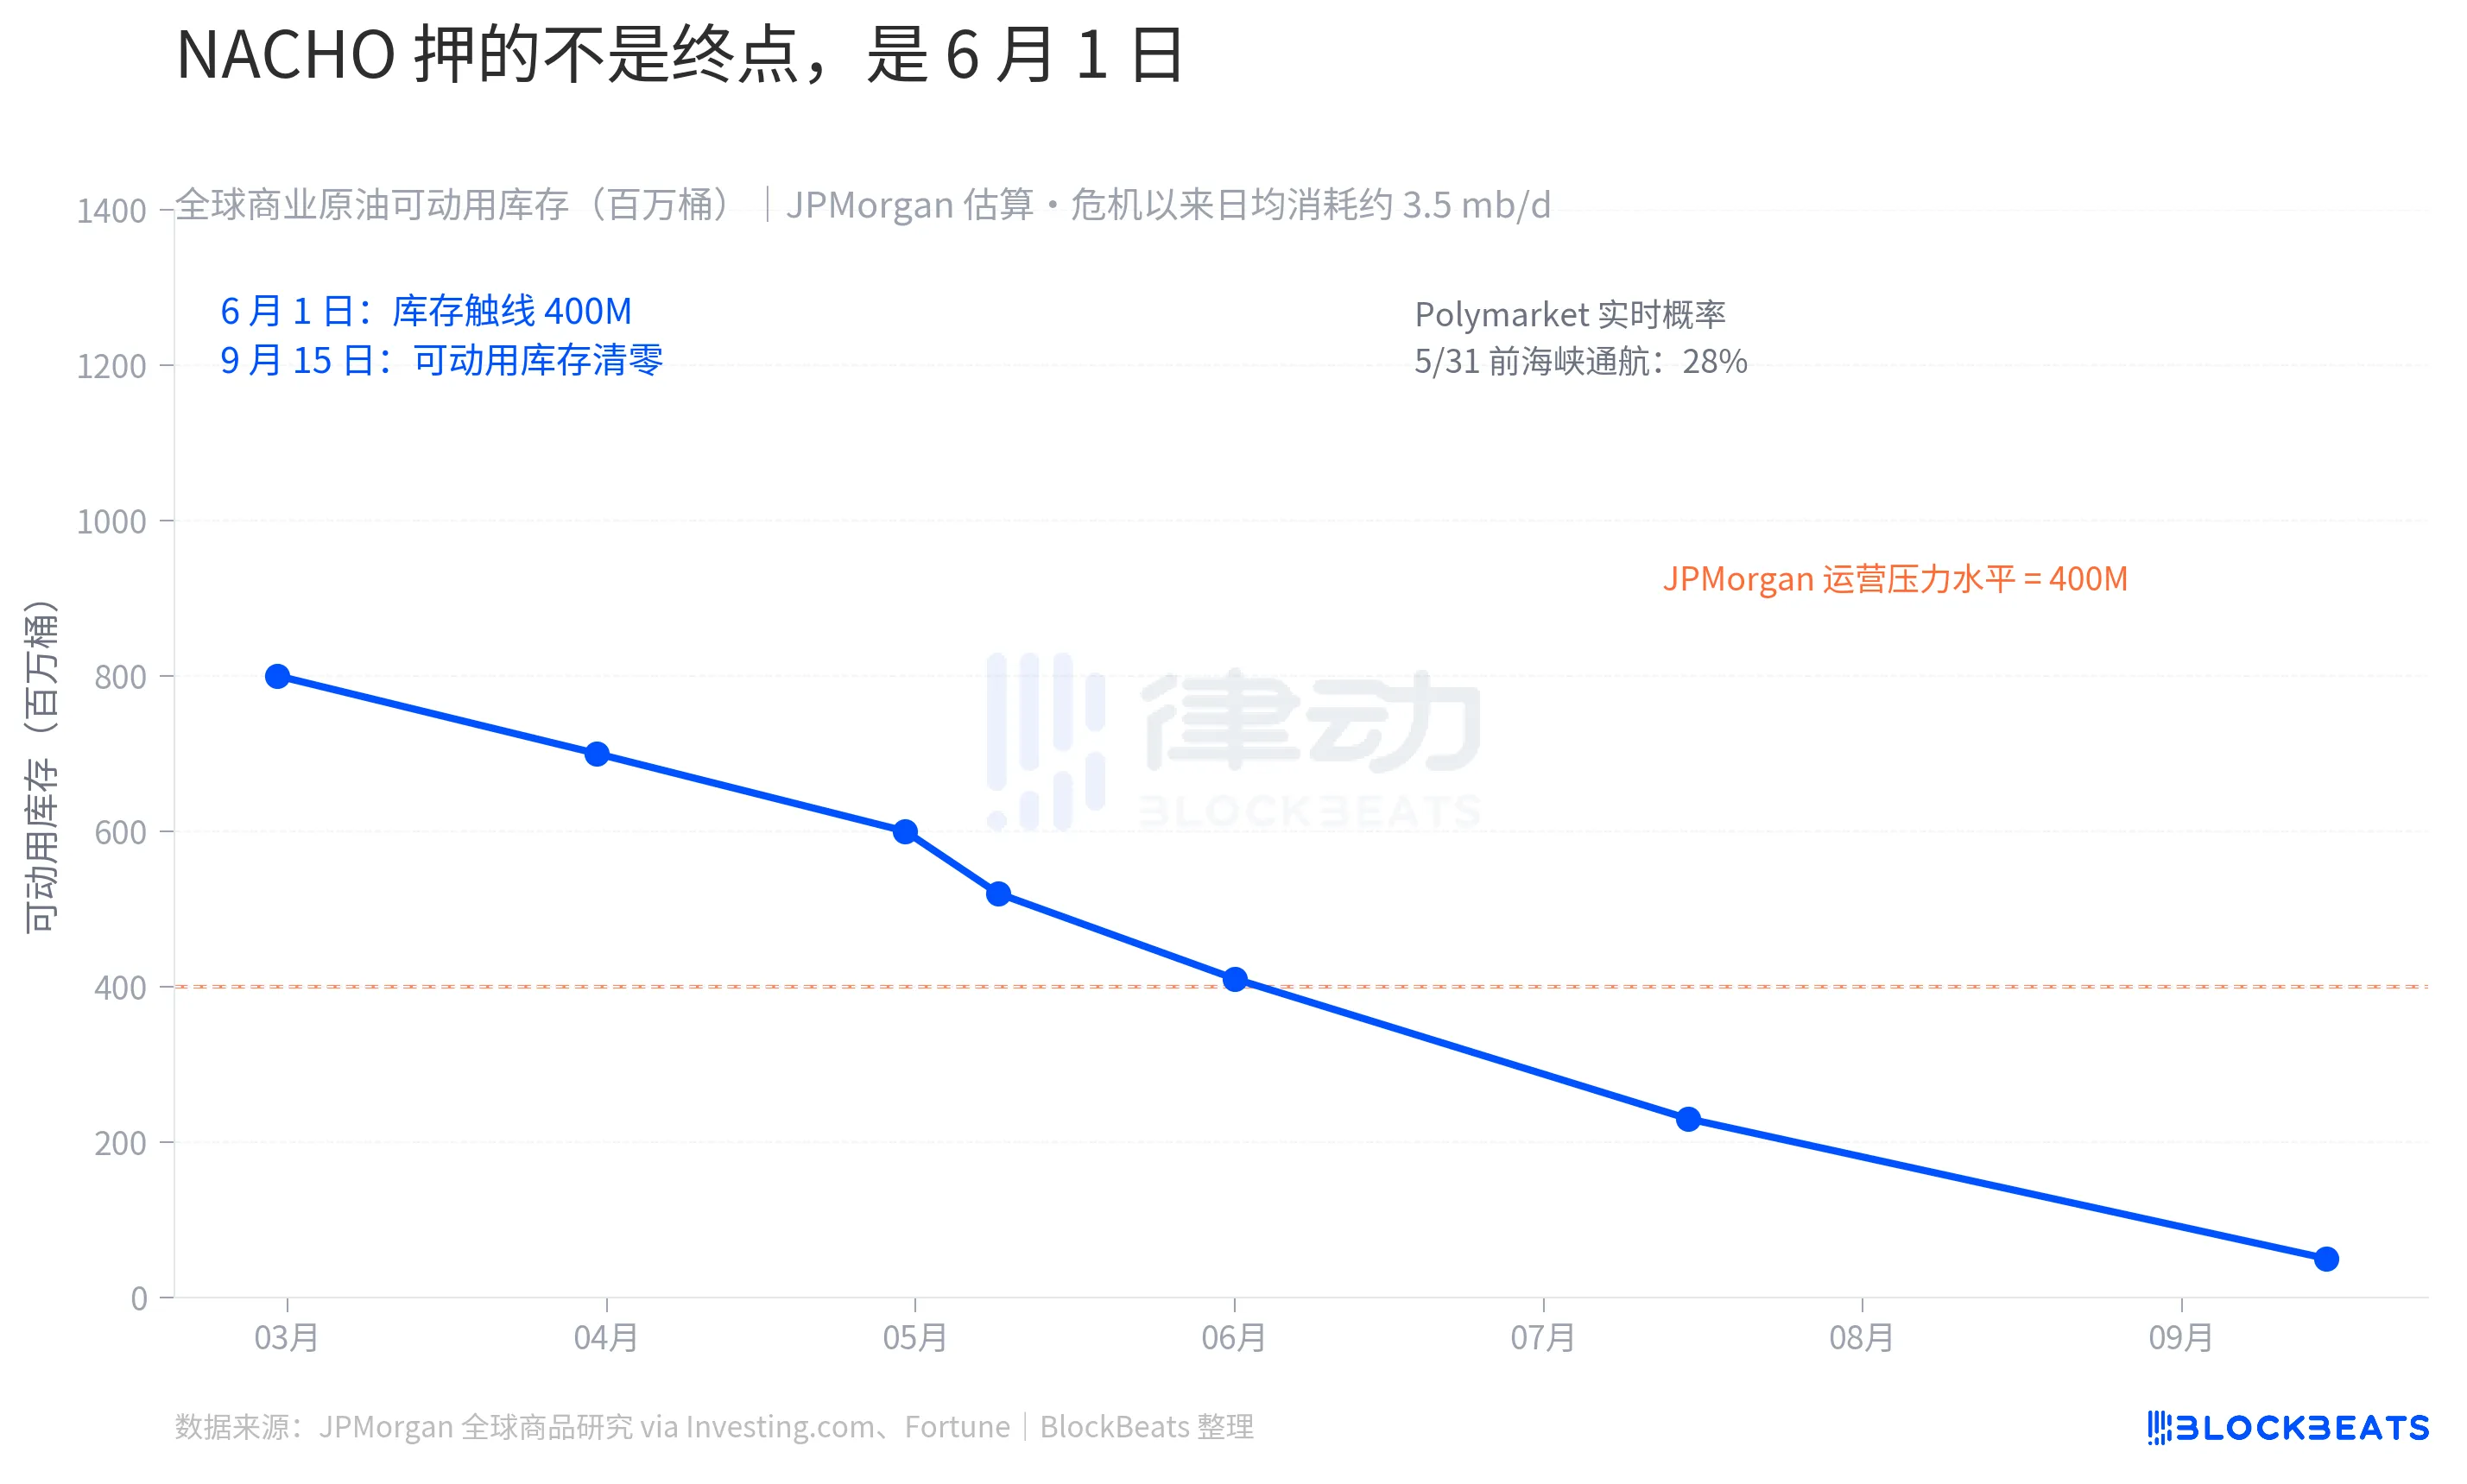
The betting odds in the predictive market are synchronized with the physical clock. According to Polymarket data on May 9, the probability of "the Strait of Hormuz being back to normal navigation by May 31" is 28%, while the probability before May 15 is only 2%. There are $9.92 million in active positions in this market betting that NACHO will not become ineffective at least within May.
The market is no longer trading Trump’s next Truth Social post but has begun to trade the inventory data for the Strait of Hormuz at the beginning of June.
免责声明:本文章仅代表作者个人观点,不代表本平台的立场和观点。本文章仅供信息分享,不构成对任何人的任何投资建议。用户与作者之间的任何争议,与本平台无关。如网页中刊载的文章或图片涉及侵权,请提供相关的权利证明和身份证明发送邮件到support@aicoin.com,本平台相关工作人员将会进行核查。


