Historical data shows that the probability of the S&P 500 declining within a month after a similar divergence is as high as 90%.
Written by: Zhao Ying
Source: Wall Street Watch
As the S&P 500 index repeatedly reaches historical highs, the continuous absence of a key sector is sending a warning to the market.
The financial sector of U.S. stocks has accumulated a decline of about 6% this year, while the S&P 500 index has risen 7% during the same period, closing at historical highs 14 times in the last 17 trading days. This rare divergence has raised the alert of some market participants—similar signals occurred prior to the collapse of the internet bubble and the 2008 financial crisis.
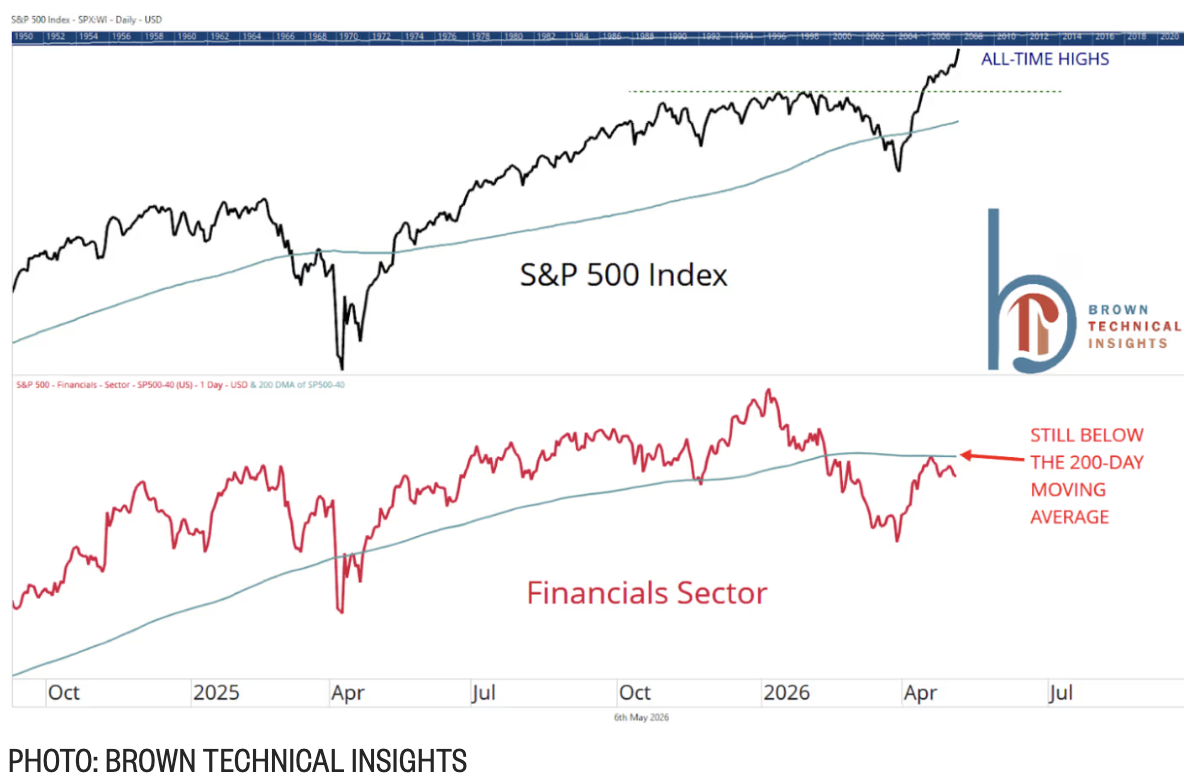
Scott Brown, founder of Brown Technical Insights, stated, "The U.S. stock market cannot do without the support of the financial sector." History shows that financial stocks at least need to participate in an upward trend, while currently, they are barely participating at all.
The hidden worries in the private credit market are considered one of the important reasons for the pressure on the financial sector. Melissa Brown, global investment decision-making research director at SimCorp, pointed out that the financial system is highly interconnected, and related risks "may spread more widely than currently expected," requiring close attention. Although large banks like JPMorgan Chase, Bank of America, and Wells Fargo all reported strong quarterly performances in April, the downturn in the financial sector has still not been reversed.
Technical Divergence: XLF Breaks Below the 200-Day Moving Average
Scott Brown indicated that the technical signals from the financial sector are particularly concerning. The State Street Financial Select Sector SPDR ETF (XLF), which tracks the financial sector, has not only continued to decline during the S&P 500's all-time highs but has also consistently traded below the 200-day moving average—widely regarded as an important reference for assessing long-term trends.
Historical data shows that in the previous 32 instances when the S&P 500 reached new highs while XLF was below the 200-day moving average, the S&P 500 declined 29 times a month later, with an average decline of 3.3%. Six months later, the S&P 500 had 18 declines and 14 rises; although a year later it had 17 rises and 15 declines, with an average increase of 4.6%, the maximum decline reached 41.5%, indicating an asymmetrically high downside risk.
Additionally, among all 11 SPDR industry ETFs for the S&P 500, XLF is currently the only sector where both the price and the 50-day moving average are below the 200-day moving average, indicating weakness in both short-term and long-term trends for the financial sector.
From a relative performance perspective, the situation is similarly bleak. According to data from FactSet and MarketWatch, since its inception on December 22, 1998, the ETF's performance relative to the S&P 500 has fallen to an all-time low.
This means that the current weakness of the financial sector compared to the broader market has exceeded the levels during the COVID-19 pandemic and the 2008 financial crisis, and is significantly worse than the levels at the beginning of the internet bubble's collapse in 2000. This extreme relative weakness has caused concern among some analysts.
Historical Precedent: The Financial Sector Has Warned Twice in Advance
The financial sector is seen as a leading indicator because of its core position as a provider of economic liquidity. Businesses need to borrow to expand, and banks profit through lending. Once credit conditions tighten or the willingness to borrow declines, both the economy and the stock market often come under pressure.
Historically, the financial sector has issued warnings twice before market peaks. Before the internet bubble burst, the performance of XLF relative to the S&P 500 began to weaken in April 1999, about 11 months ahead of the ultimate peak of the S&P 500; before the 2008 financial crisis, XLF began to give warning signals in February 2007, about 8 months ahead of the market top.
In light of these signals, Scott Brown's advice is to be cautious rather than aggressive. He stated that identifying a top in the current market is not easy, and turning bearish is quite difficult because such warning signals can sometimes take a long time to be digested by the market and may not ultimately materialize.
However, he suggested that investors might consider gradually "reducing holdings in chip stocks" rather than chasing further increases, and it is even less advisable to inject new funds into the market. JPMorgan CEO Jamie Dimon previously likened the private credit issues that emerged at the end of last year to "cockroaches"—seeing one may indicate that there are many more behind it—although he also stated that these related issues may not pose a systemic risk, and the market's reaction to this warning has been generally muted. Nevertheless, against the backdrop of the financial sector continuing to signal abnormalities, this warning may deserve a reassessment.
免责声明:本文章仅代表作者个人观点,不代表本平台的立场和观点。本文章仅供信息分享,不构成对任何人的任何投资建议。用户与作者之间的任何争议,与本平台无关。如网页中刊载的文章或图片涉及侵权,请提供相关的权利证明和身份证明发送邮件到support@aicoin.com,本平台相关工作人员将会进行核查。


