Author: Charles Edwards
Compiled by: Deep Tide TechFlow
Deep Tide Introduction: Institutional demand for Bitcoin has reached unprecedented levels, with buying at 577% of daily mining output. Historically, every time this has occurred, the price of Bitcoin has achieved double-digit gains in the following weeks. At the same time, on-chain data, technical indicators, and derivatives markets all show strong bullish signals, which may not just be a local frenzy but the beginning of a bigger upward trend.
Reasons to be Bullish on Bitcoin and the Stock Market
Since the last issue, institutions have been aggressively buying, now acquiring Bitcoin at a rate of 577% of daily mining output. This number is huge. Bitcoin has increased by 12%.
Have we reached a local frenzy peak? Or is this just the beginning of a larger upward trend?
In this issue, we conduct an in-depth analysis of Bitcoin and the stock market.
Bitcoin is bullish in both on-chain and technical data. We reiterate what we wrote last issue: "In the face of this series of data, it's hard not to be bullish."
Institutions are buying at a rate of 600% of daily mining output
Capriole's longest-running on-chain and technical model is bullish at $71,000
A complete surrender in the March/April derivatives market
SOPR shows surrender and bullish breakout
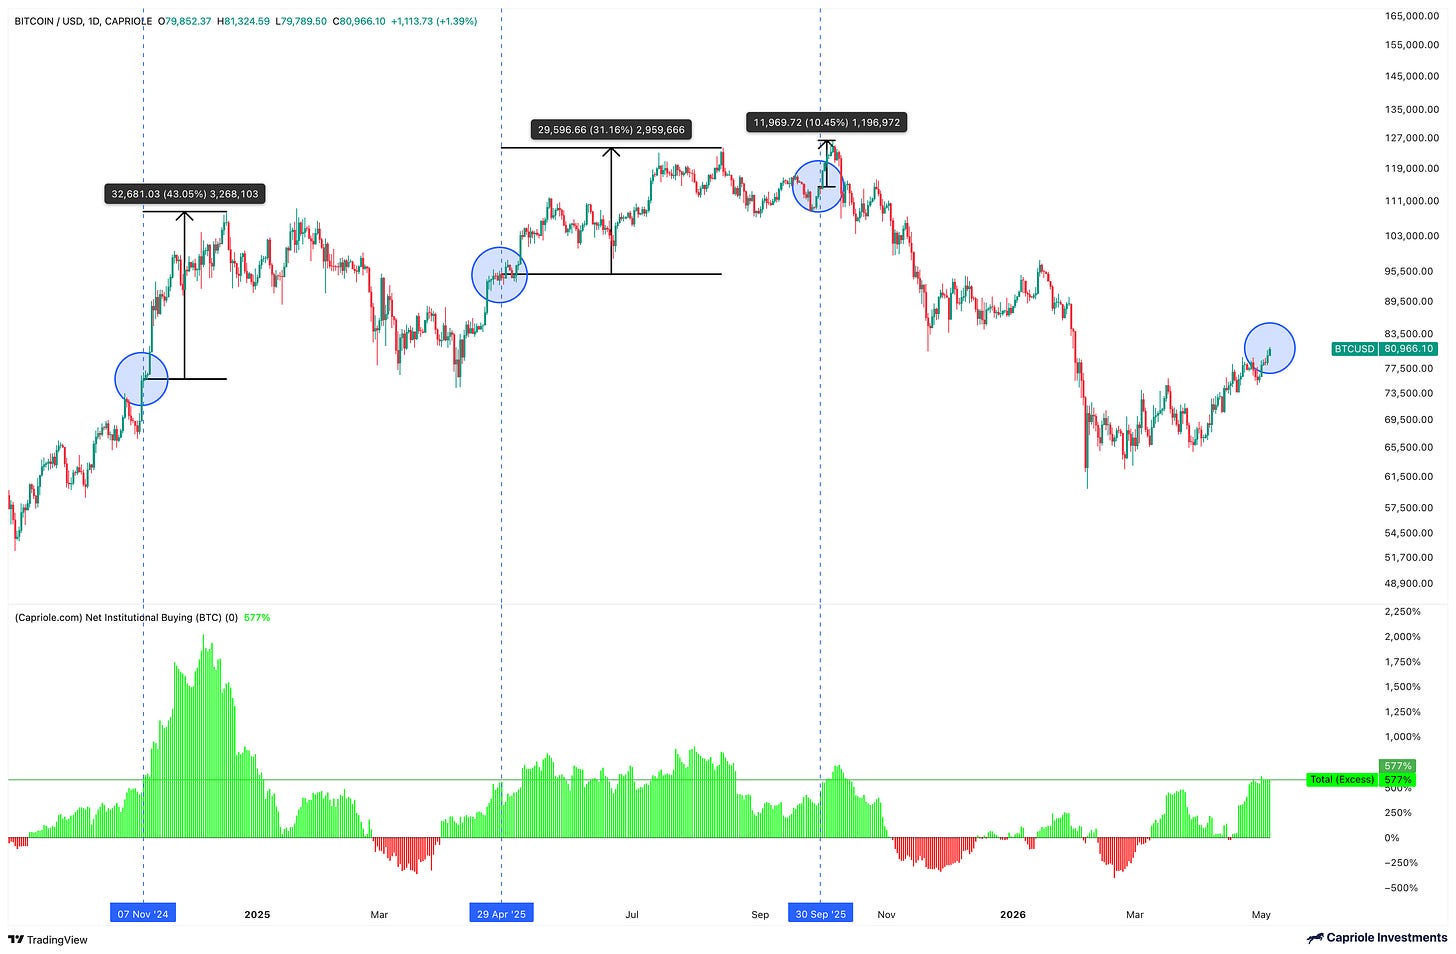
Institutional Demand for Bitcoin
Institutions are buying Bitcoin at a speed exceeding 600% of daily mining output. Each time we've reached such high levels in the past, the price has skyrocketed within the next week. As shown in the chart, in all previous cases, we usually see double-digit returns within a few weeks. This would push the price to around $96,000.
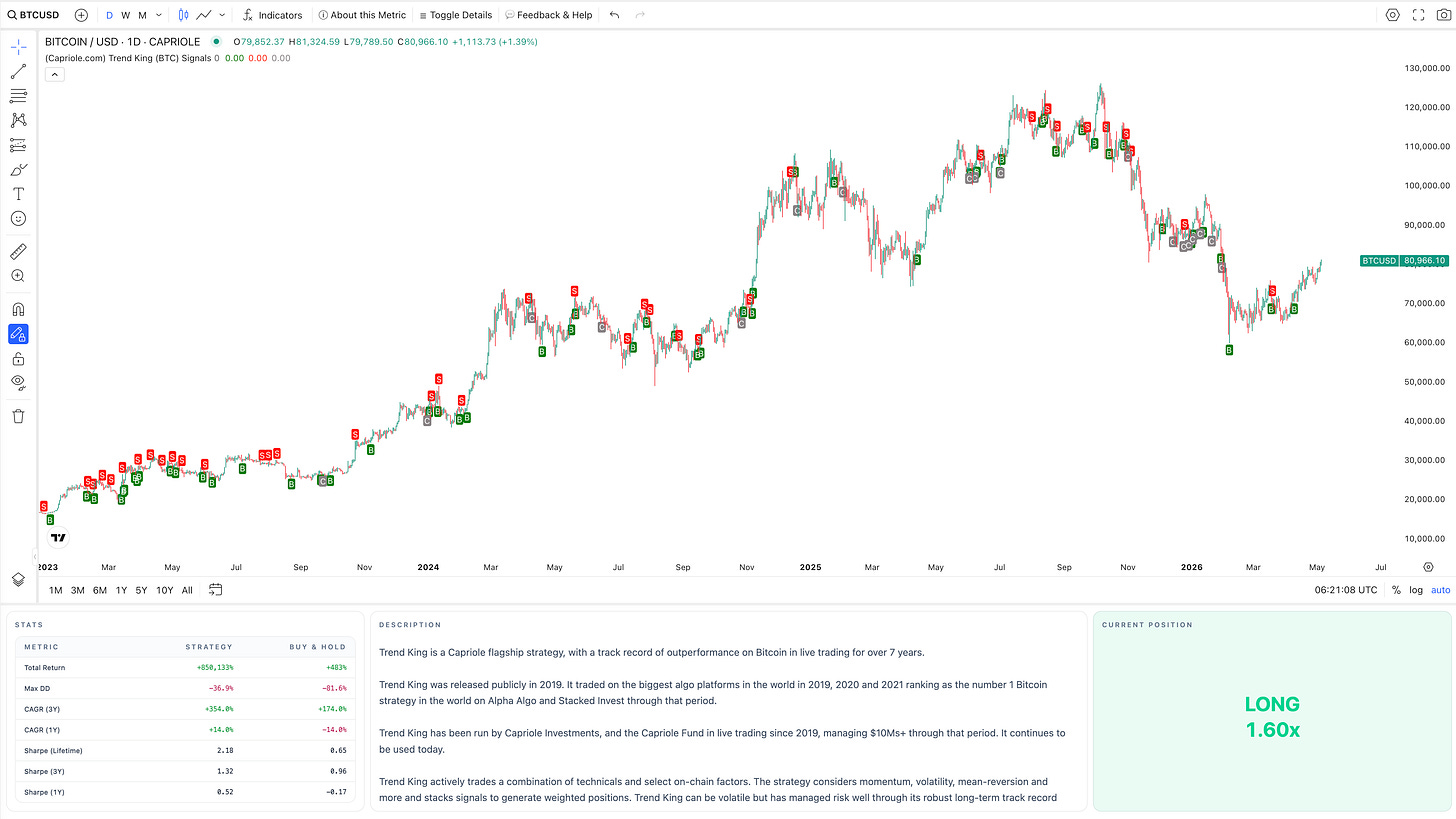
Trend King Leverages Long Bitcoin
Trend King is our longest-running live trading strategy, public since 2019 and continuously managing funds to this day. Trend King was rated as the number one Bitcoin strategy globally in 2019, 2020, and 2021. This is the first public release since 2021. Trend King is primarily a technical strategy but also focuses on selected on-chain factors. Trend King is currently leveraging long on Bitcoin.
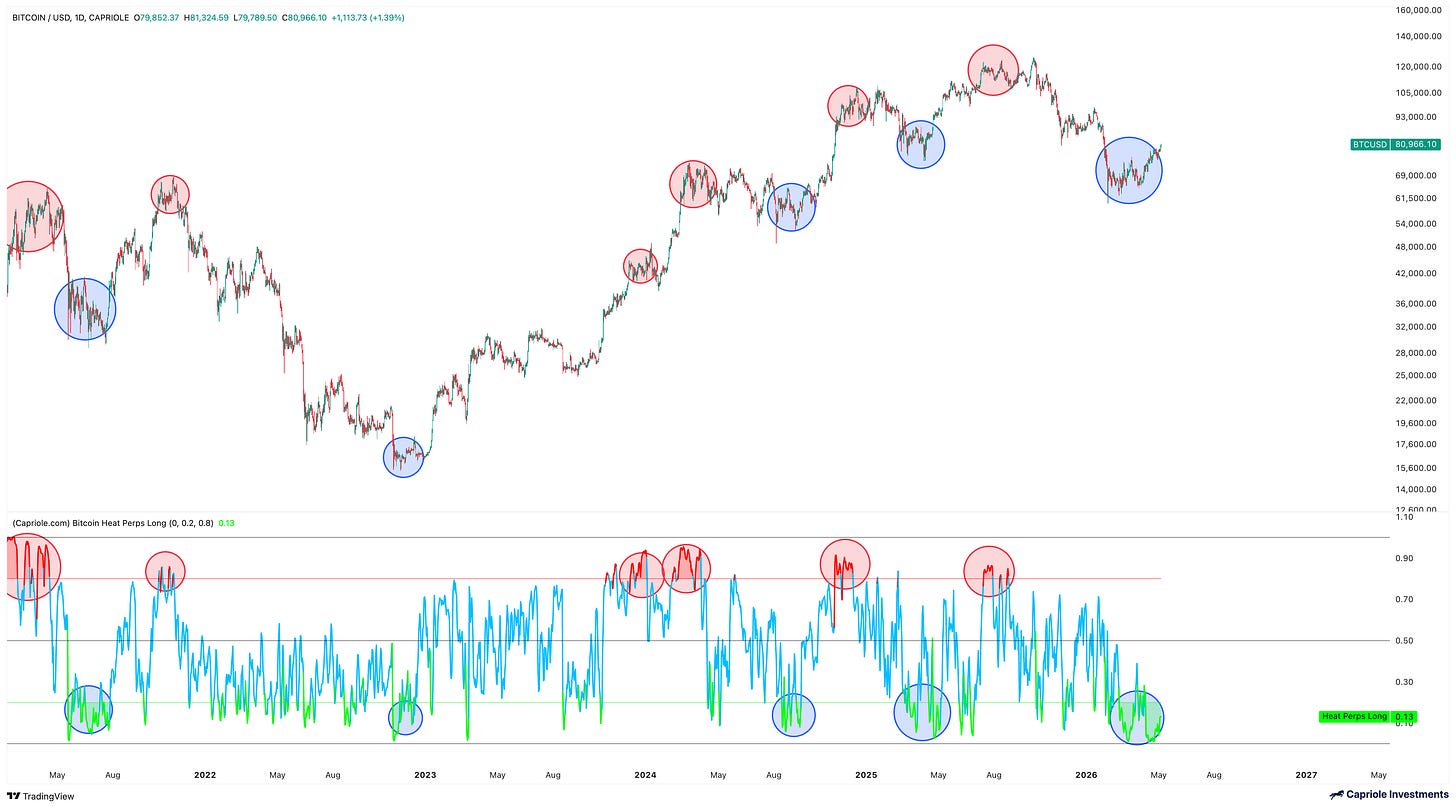
Bitcoin Perps Heat tracks the extreme relative degree of the second largest derivatives market for Bitcoin—Bitcoin perpetual contracts. It observes funding rates and open contracts, standardized over a 4-year period. When it is relatively high, many people go long on Bitcoin. When it is low, many go short on Bitcoin. It is important to look for extended regimes at long/short extremes. We have just gained an extremely bullish long-term signal from an over-short position.
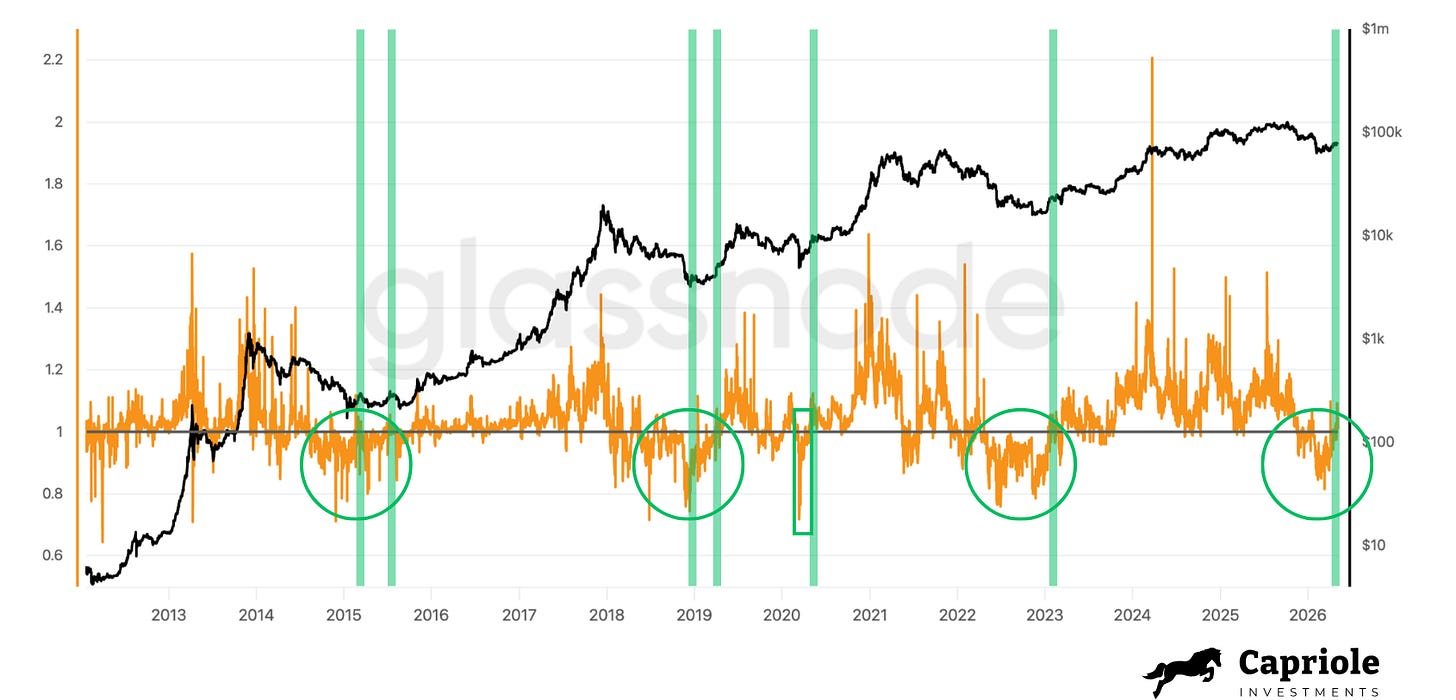
Last issue we discussed the spent output profit ratio (SOPR) being long-term below 1 as a "great historical opportunity for Bitcoin". This issue we also have bullish confirmation, returning above 1. This is a good sign of price and on-chain momentum returning positively.
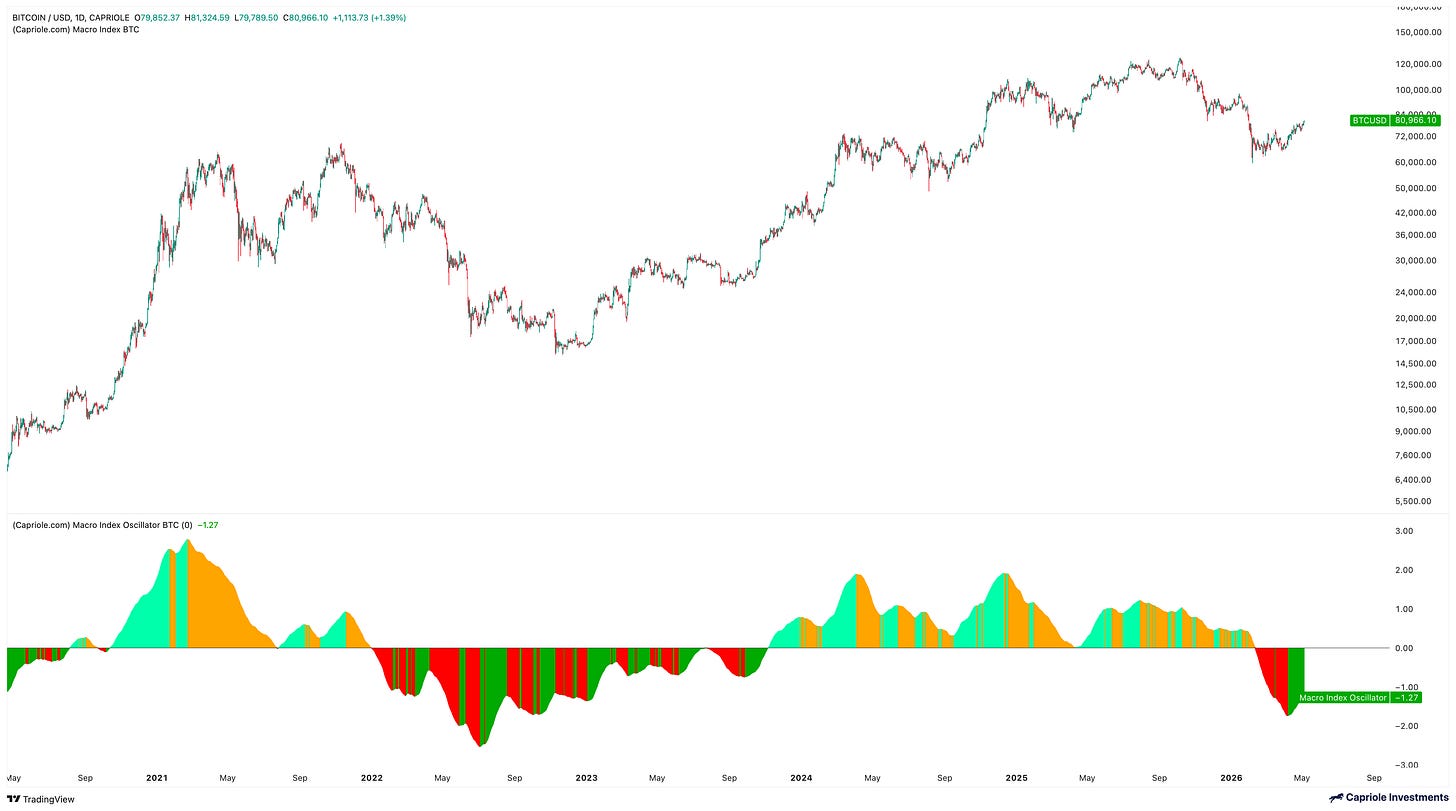
The Macro Index is our Bitcoin model based solely on fundamentals, tracking over 200 on-chain and macro market data points. It provides a preferred aggregated view of Bitcoin's fundamental data. The Macro Index also turned bullish a few weeks ago at around $71,000. It is now in "recovery" mode, and Macro Index trends tend to be sticky.
A classic and quite robust market strategy is risk preference and going long.
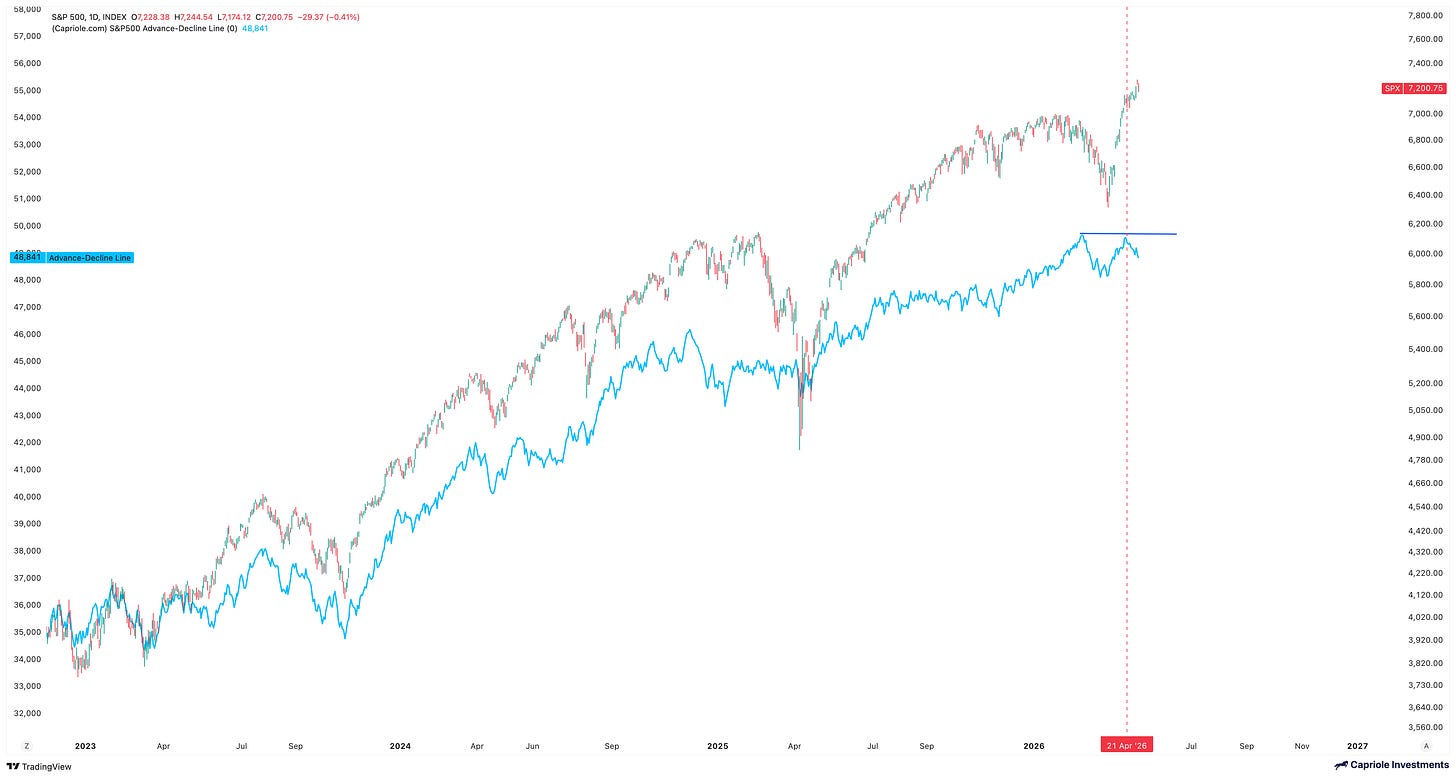
The advance-decline line shows weakness at the highs.
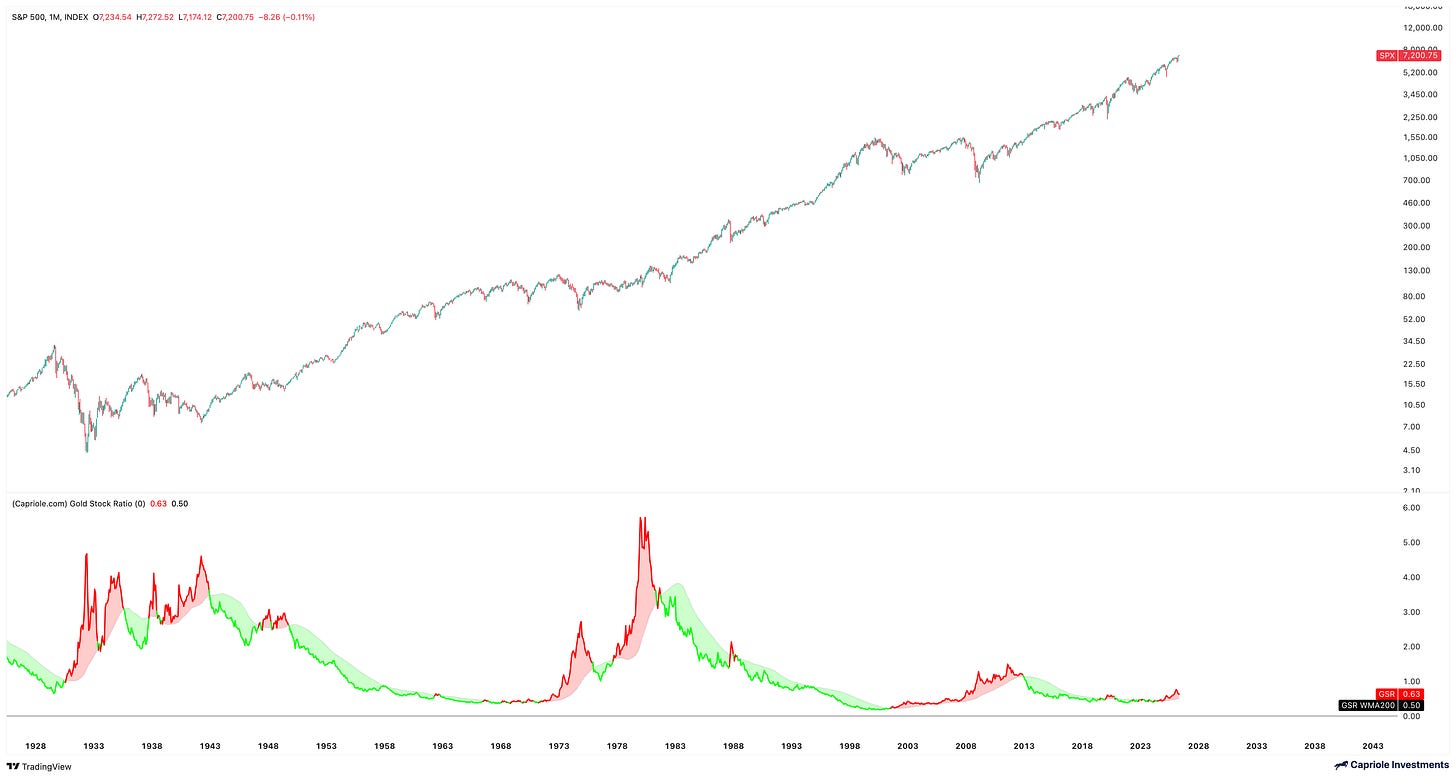
The gold stock ratio is bearish for the stock market, presenting some long-term risks.
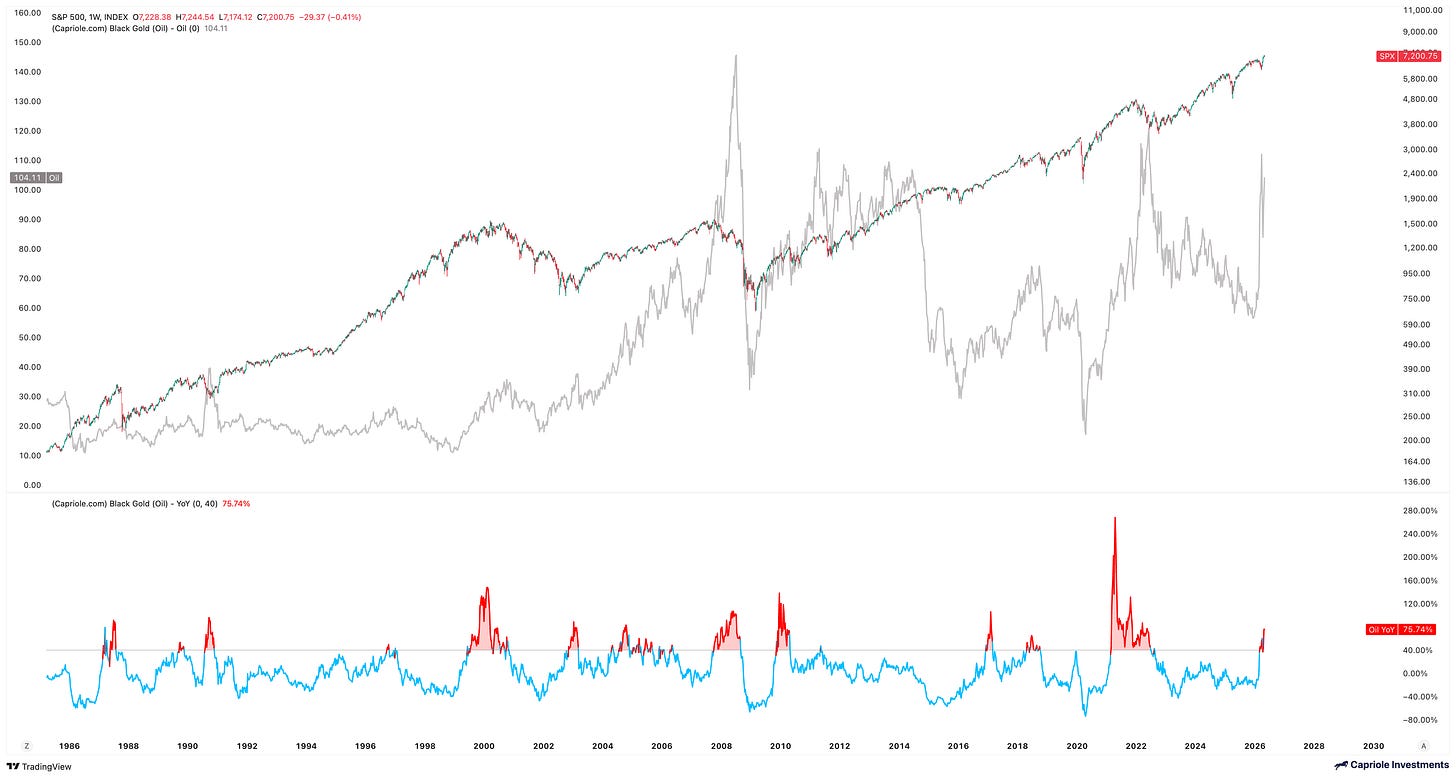
The MAG7's AI earnings exceeded expectations last week. AI is a growth story; tech stocks (at present) do not care about high oil prices.
Credit spreads and volatility have collapsed, supporting a rebound in risk preference.
Sentiment and positions have turned neutral, and now is the time to see if the breakout trend can hold.
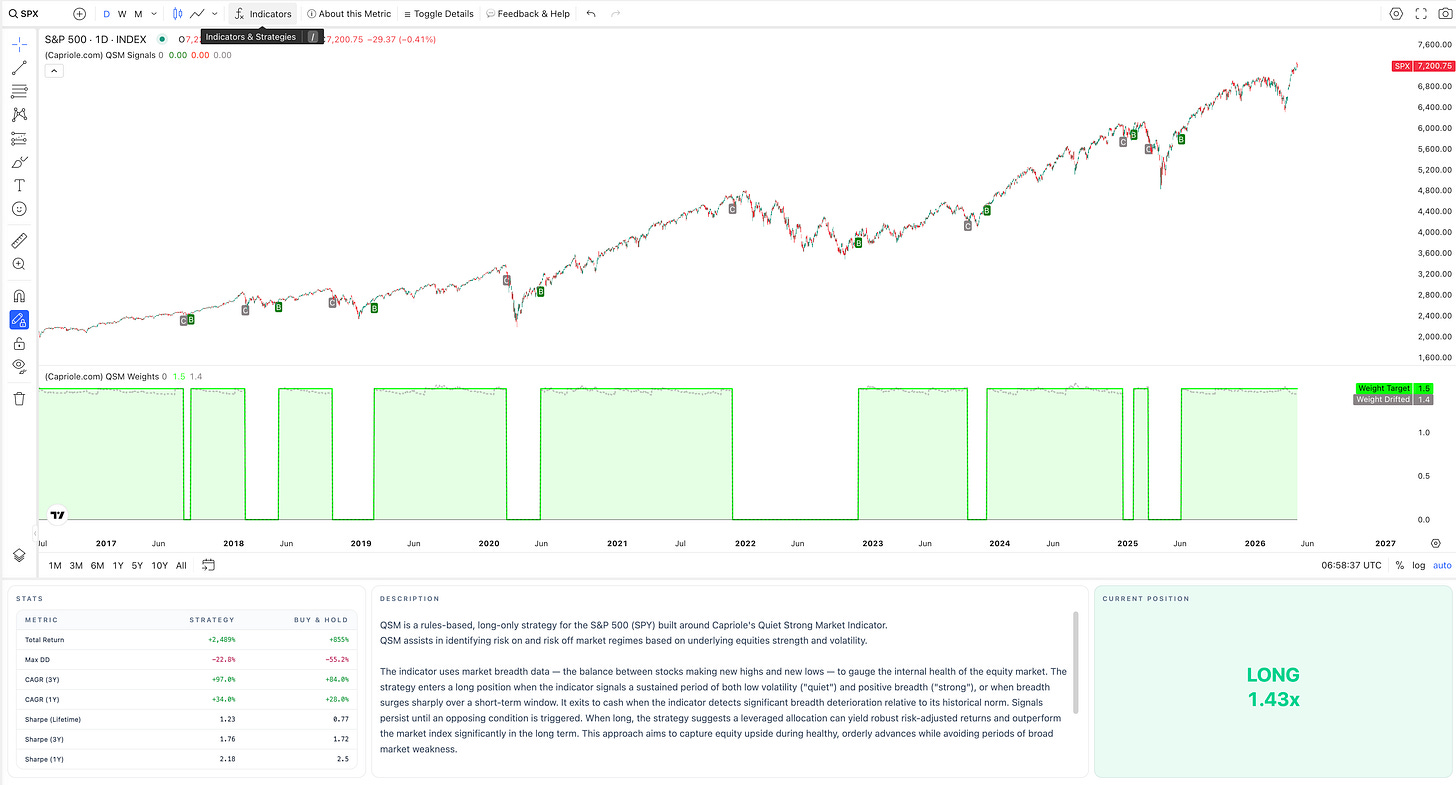
The Quiet Strong Market strategy weighs volatility and market breadth to identify strong trends and manage risk environments. This is a slowly moving strategy, which won't shield against low volatility but navigates large trends very well. Today it is still a preference for risk in the stock market.
The advance-decline line's recent failure to continue to rise after a breakout suggests short-term volatility. However, if the advance-decline line remains stagnant here, it indicates broader issues for the S&P 500, maybe high oil prices starting to squeeze tail assets. This is definitely a risk factor to watch. Ideally, we want to see the advance-decline line break out and rise in the coming weeks.
With the Iranian war ongoing, high oil prices remain a key risk to monitor. Sometimes it may signal false alarms, but generally captures significant risk aversion events very well. The key with high oil prices is duration. The longer we stay elevated, the more risks accumulate. Returning to a high this month is not ideal. However, 1 or 2 months of high oil prices (like we have experienced) is still not enough; risks accumulate when oil prices remain high for years.
For a century, breakouts in the gold stock ratio have been a dangerous signal for the stock market. Its hit rate is extremely high. However, gold has been struggling in recent months, but as long as this relative strength trend in gold remains (like today), we must remain vigilant regarding stock market risks.
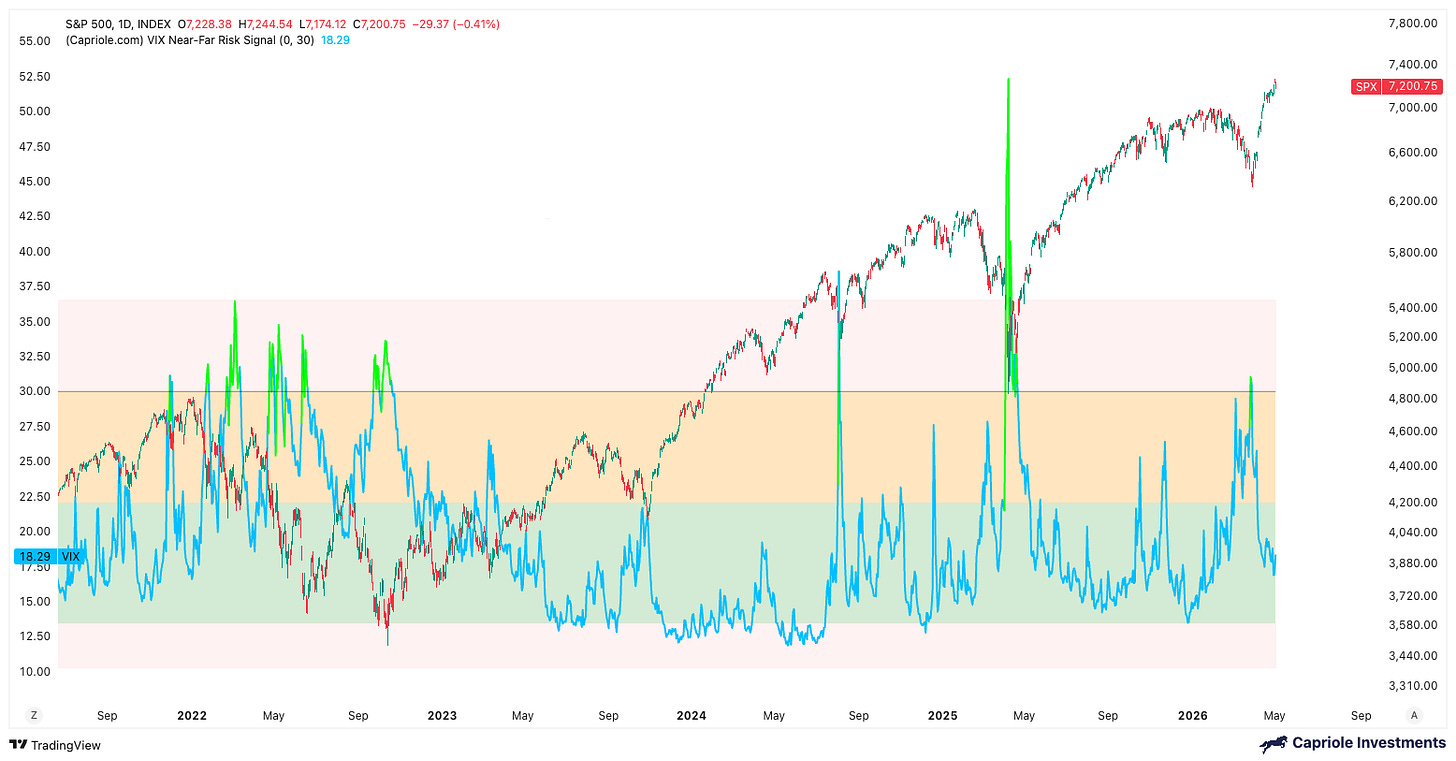
The VIX is in a prime position today. It is also supported by the collapse of credit spreads. Generally, you can divide the VIX into the following regions. A VIX above 30 represents fear, a sign of panic, and getting out of it (VIX falling below 30) is bullish. We just saw this a month ago.
The orange zone, especially when VIX is increasing, is a warning signal for future price volatility. Relatively low VIX readings (like where we are today) indicate a strong risk preference area, usually the main backdrop for a bull market in major stocks. That said, when VIX is too low, it may represent complacency, becoming a warning signal again, but we are far from that today.
In short, VIX and credit spreads support the current breakout trend.
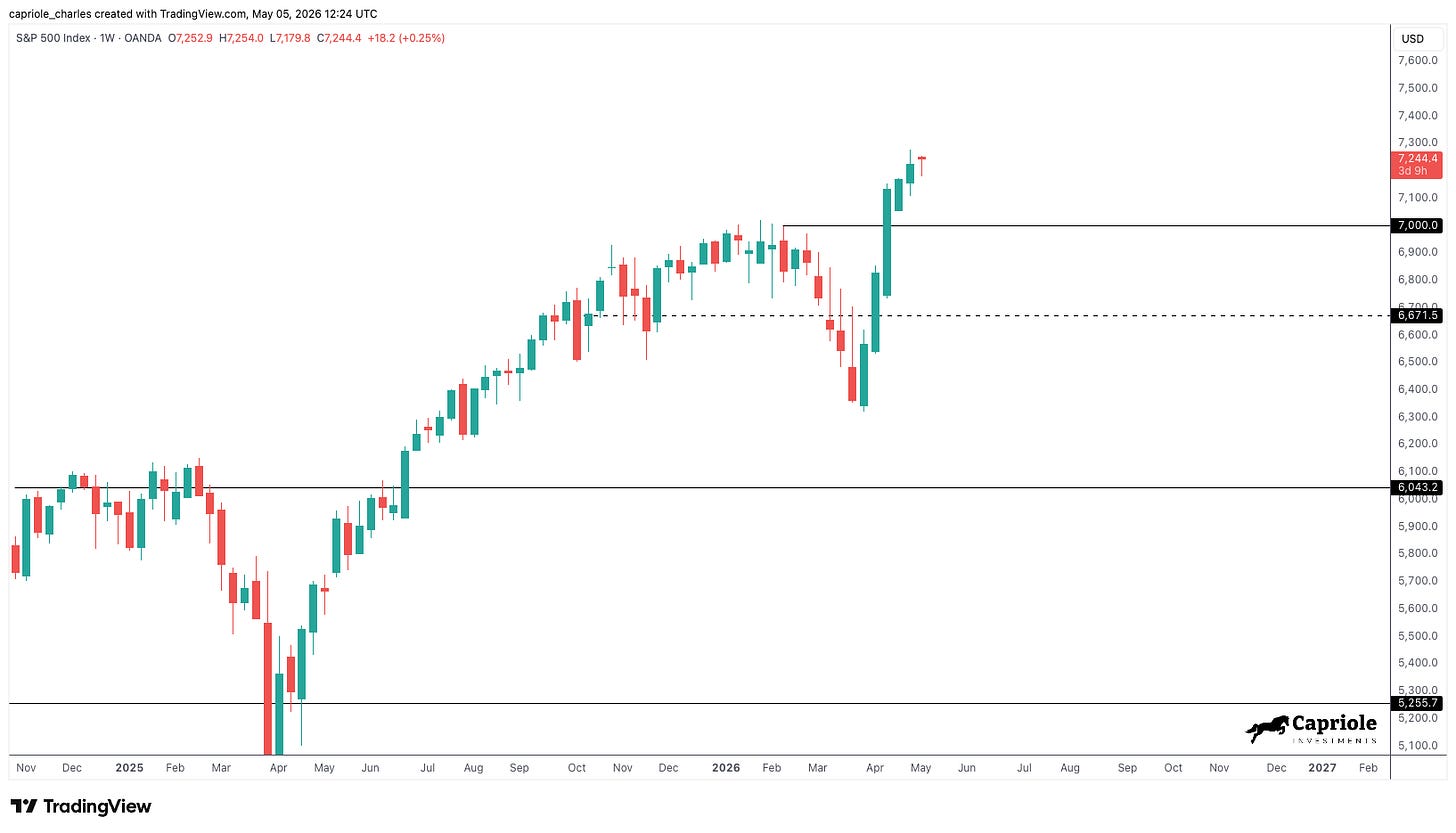
The technical aspect is again helpful here, as we have just set a historical new high breakout for the S&P 500. Context is also important. This historical new high occurs amid war, the Strait of Hormuz, blockades, soaring oil prices, and bad market sentiment. When price reacts strongly to bad news, it is a powerful bullish signal (also true for Bitcoin). Thus, the S&P 500 was in a risk preference state before the recent failure of the 7000 weekly resistance. A weekly close below 7000 would make the technicals quite poor; before that, it made sense to go with the trend.
Conclusion
Bitcoin looks extremely strong here. It is also supported by relative strength against all markets, having bottomed and outperformed since the Iranian war began. Today, we see consistent strength in Bitcoin's technical and fundamental data.
The stock market is more nuanced, with several warning signals flashing, but these are mostly long-term warning signals requiring more bearish recent convergences to truly support. Additionally, we have a fresh and nearby technical line of defense at 7000, which can be used to abandon ship if it fails.
Until then, the trend is your friend.
We may have just returned.
Charles Edwards
免责声明:本文章仅代表作者个人观点,不代表本平台的立场和观点。本文章仅供信息分享,不构成对任何人的任何投资建议。用户与作者之间的任何争议,与本平台无关。如网页中刊载的文章或图片涉及侵权,请提供相关的权利证明和身份证明发送邮件到support@aicoin.com,本平台相关工作人员将会进行核查。