For those who do not understand the direction of trading, please like and follow for daily real-time market breakdowns and to share solid trading ideas.
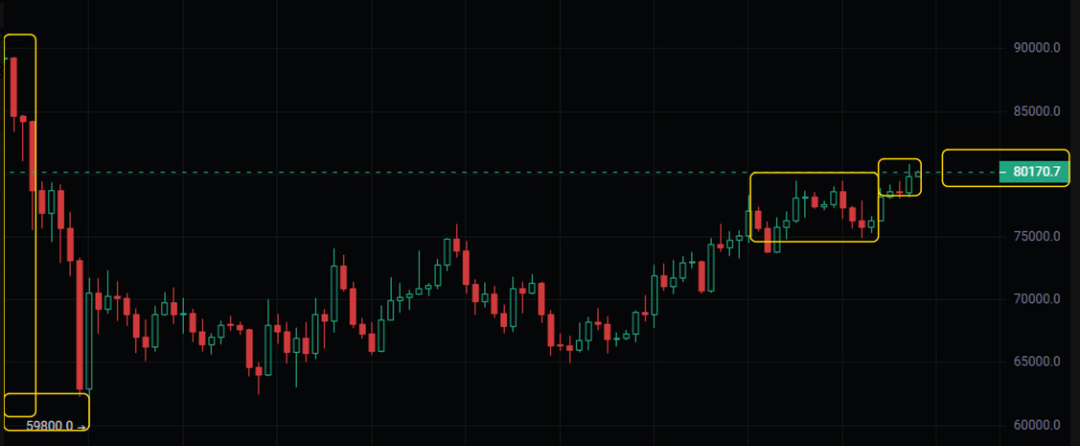
Reviewing this market segment; from the daily chart, the current BTC trend shows a clear three-stage structure of "sharp decline - bottom formation - rebound". The market began at a peak near 90000, and due to multiple bearish factors, it initiated a deep sell-off, hitting a low around 59800, with market panic sentiment concentrating and selling pressure being fully digested. Subsequently, the market entered a prolonged bottom formation phase of several weeks in the range of 65000-72000, with alternating bullish and bearish candles, back-and-forth market dynamics, and trading volume remaining low. Market sentiment gradually shifted from panic to indecision. During this process, bullish strength accumulated slowly, eventually forming a clear ascending channel, with both lows and highs consistently rising. The current price has rebounded above 80000, a recovery of over 33% from the low point, showing a significant strong correction.
In conjunction with the current trend, the core support and resistance levels have formed a clear bullish and bearish contest pattern that directly determines the subsequent market direction:
Core support levels: 78000, 75000. The former is the key retracement platform for this rebound, while the latter is the upper edge of the previous consolidation range. A break below these levels would indicate a depletion of short-term rebound momentum, further opening up space for bearish targets.
Core resistance levels: 82500, 85000, 90000. Among these, 82500 is an important rebound high during the previous decline phase and stands as a dense area of trapped positions. It is the primary barrier for bulls to break through and is also a key defensive level for medium-term bearish positioning.
Currently, prices are in the range of 79000-81500. This is both the dense selling pressure area of previous trapped positions and the core resistance zone for this rebound. The bullish and bearish contest here will enter a heated phase, directly influencing the subsequent trend direction.
Medium-Term Bearish Positioning Logic and Execution Strategy
Based on the technical characteristics of the current daily rebound's end and our preset trading plan, medium-term bearish positioning should adhere to the core principle of "gradual entry and strict risk control". The specific strategies are as follows:
Entry Range and Position Allocation
Using 79000-81500 as the core entry range, utilize a staggered entry model to avoid high exposure in a single trade. The planned position can be divided into 3-4 parts, with entry points evenly distributed within the range, and each position strictly controlled within 1% to reduce stop-loss risks from short-term fluctuations, while also avoiding being swept out by market movements.
Stop-Loss Settings: Lock in the core stop-loss level above 82500. Once the price effectively breaks through this resistance, it indicates that the rebound trend has exceeded expectations, and the previous bearish logic would fail, necessitating decisive stop-loss exit to avoid significant losses due to holding against the trend. If the price rises above 85000, it can be directly interpreted as a trend reversal, requiring unconditional exit.
Take-Profit Settings: The first target level is set at 78000. If the price falls below this support level, consider reducing some positions to lock in profits. The second target level looks towards 75000, which is the upper edge of the previous consolidation platform. If broken, continue to hold short positions and watch for testing opportunities at lower support levels.
Be alert to three core risks in this round: First, the bullish trend on the daily level has not yet been broken, and short-term rebound momentum still exists, with prices potentially oscillating near resistance; Second, the timing of releasing previous trapped positions' selling pressure is uncertain; if market sentiment improves, bulls might break through resistance with favorable news; Third, systemic risks arising from macro policy changes could disrupt the current technical contest.
Therefore, risk control is the lifeline of this positioning: strictly enforce a position limit of ≤1% per trade, never hold positions against the trend, and never add to positions while in a loss. Once stop-loss conditions are triggered, exit decisively, while dynamically adjusting positions and take-profit/stop-loss levels according to market trends, ensuring that the shorting opportunities at the end of the rebound are captured under manageable risks.
Friendly Reminder: This is only a review of market funds and volume-price structure logic and does not constitute any investment advice. Due to large market fluctuations, it is essential to approach this rationally and strictly control position risks.
If you want to get more timely market interpretations and practical trading ideas exchanges or consult super member services, please like and follow, and apply to join the free 🐧 group: 746191163
免责声明:本文章仅代表作者个人观点,不代表本平台的立场和观点。本文章仅供信息分享,不构成对任何人的任何投资建议。用户与作者之间的任何争议,与本平台无关。如网页中刊载的文章或图片涉及侵权,请提供相关的权利证明和身份证明发送邮件到support@aicoin.com,本平台相关工作人员将会进行核查。