Dear friends, I am Sister Qinglan. Today, market sentiment has been ignited by two pieces of news: first, Bitcoin broke through 80,000 USDT, reaching a historic high, with a 24-hour increase of 1.72%. After breaking through this key psychological level, market confidence has clearly warmed up; second, Federal Reserve's Williams stated explicitly that there is currently no need to consider raising interest rates, and the expectation for rate cuts remains, which is a direct benefit to risk assets, including cryptocurrencies. The expectation of loose monetary policy combined with Bitcoin's strong breakthrough has boosted the morale of the bulls. But don't rush to chase the highs; we need to let data speak and use the system to verify signals.
Current Price and Time
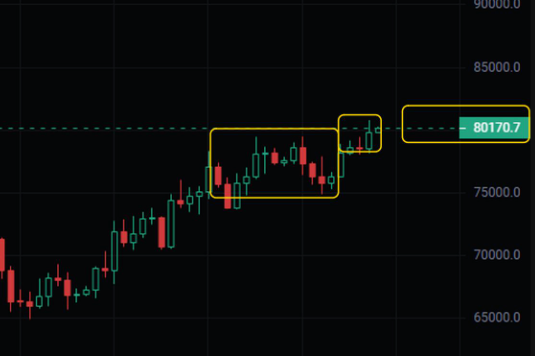
The current time is May 5th, 10:09 AM, with Bitcoin quoted at 80,461 USDT. The price has steadily stood above 80,000, marking a historic moment, but also a test of trading discipline. In our Qinglan crypto class, we emphasize that the more extreme the market, the more we must return to the system, using the TPV system to filter out noise.
Multi-Timeframe Overview
First, look at the daily level. MA5=79,161, MA10=78,030, MA30=75,648; the moving average system shows a bullish arrangement, with the price far above all moving averages. MACD's DIF=1,805, DEA=1,721, histogram at 83.74, positioned above the zero axis, indicating sustained bullish momentum. RSI=67.54, has not entered the overbought zone, indicating there is still room for upward movement. The daily chart overall shows a strong bullish pattern.
At the 4-hour level. MA5=79,839, MA10=79,520, MA30=78,302, with the price also operating above the moving averages. MACD's DIF=693, DEA=581, histogram at 112.65, bullish momentum is also growing. RSI=64.62, neutral to strong. The 4-hour chart indicates a healthy upward trend, with no significant divergence.
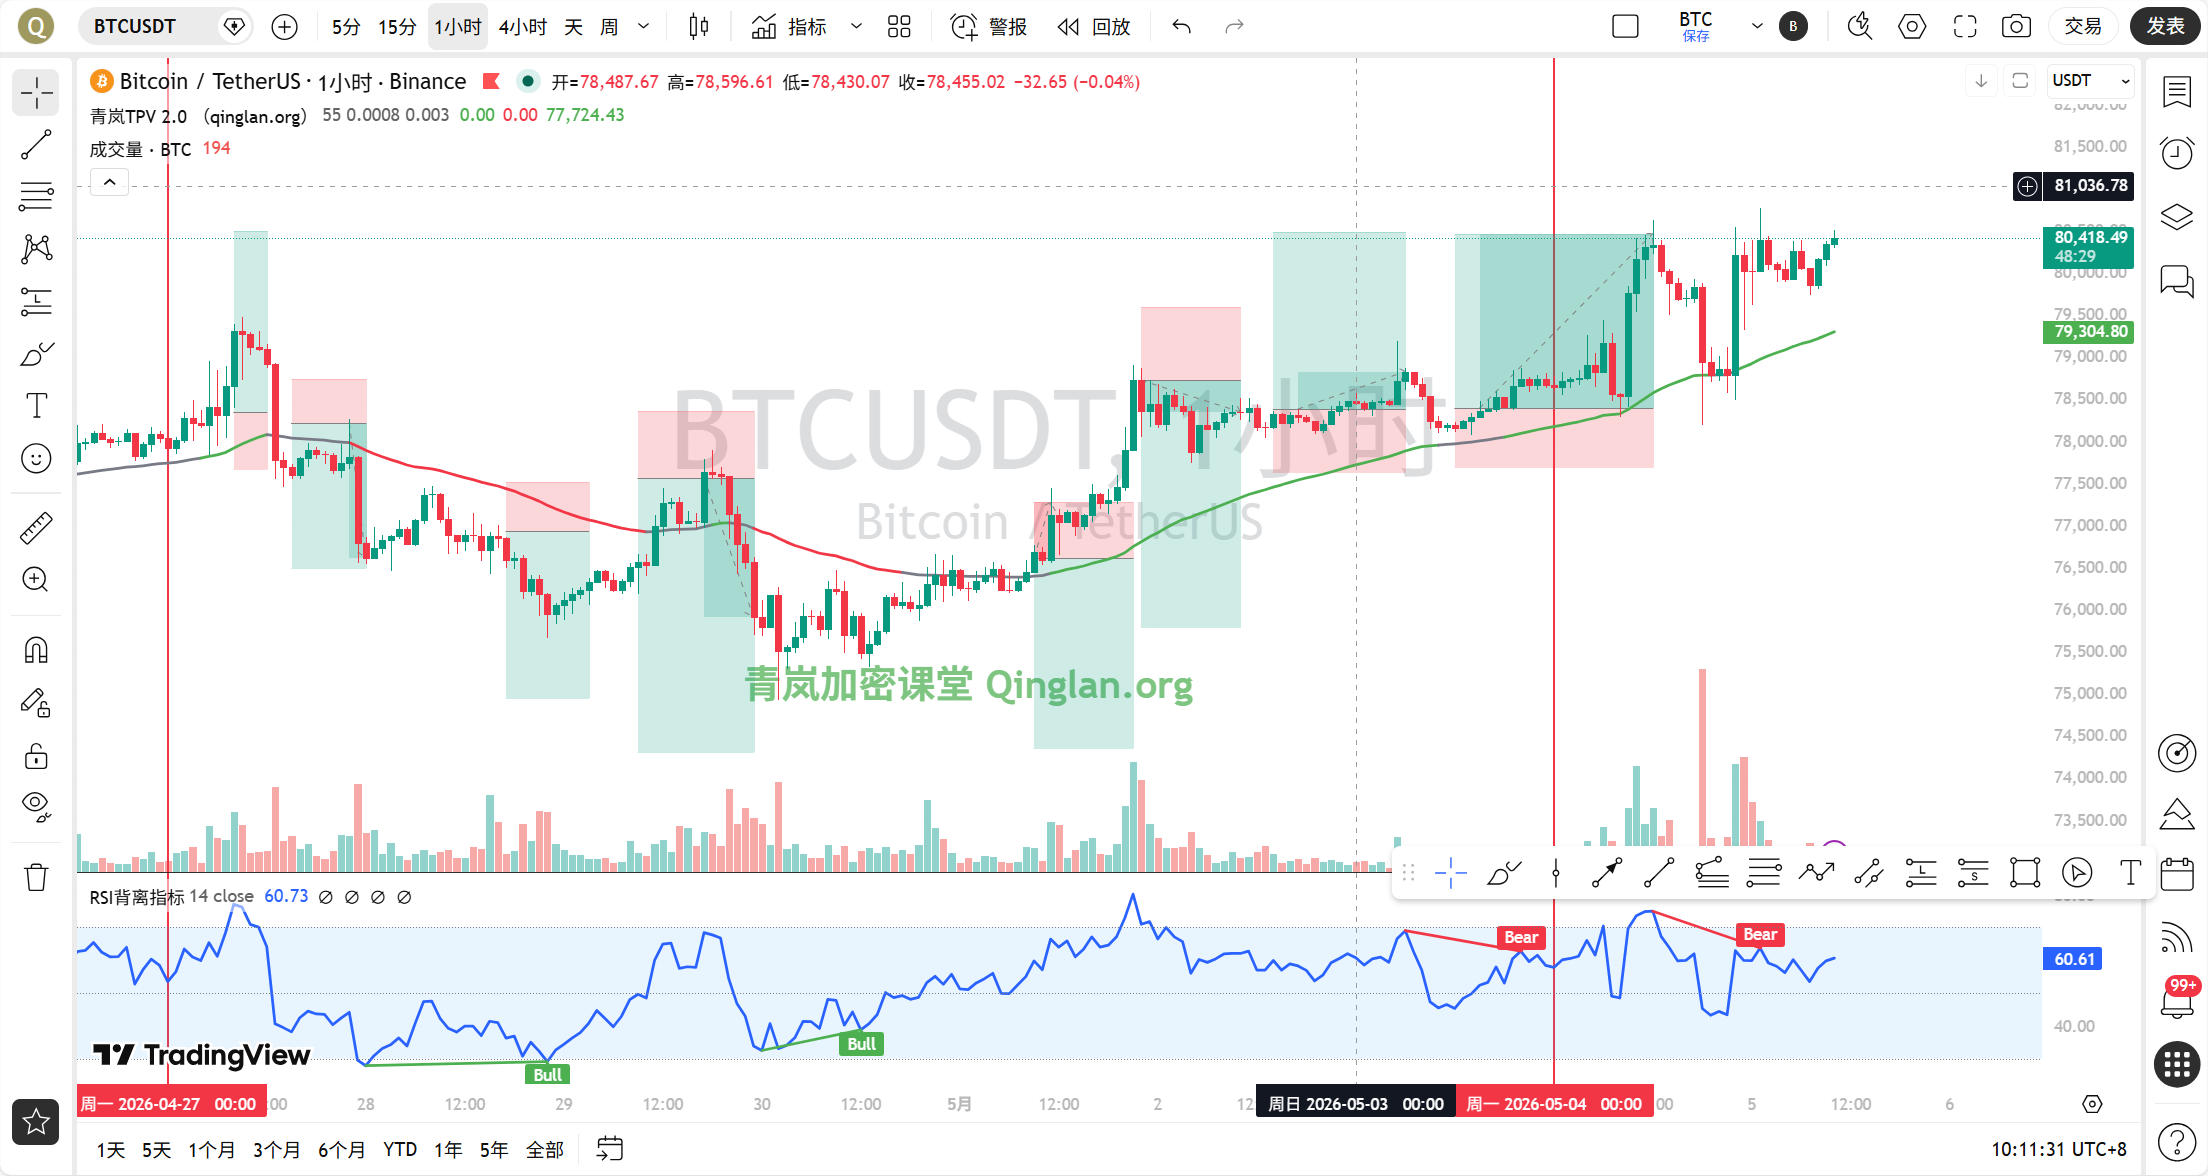
At the 1-hour level. MA5=80,182, MA10=80,166, MA30=79,739, with the price above the moving averages. MACD's DIF=285, DEA=266, histogram at 18.05; although the histogram value is not large, both DIF and DEA are above the zero axis, indicating a bullish advantage. RSI=70.97, close to the overbought area, warning of short-term retracement risks. EMA55=79,378, with the current price at 80,461, approximately 1.36% above EMA55; this range is not significant, but it is not in a consolidation state.
At the 15-minute level. MA5=80,306, MA10=80,145, MA30=80,098, with moving averages diverging upwards. MACD's DIF=81, DEA=44, histogram at 37.83, bullish momentum is still expanding. RSI=62.64, neutral to strong. The 15-minute chart shows that there is still upward momentum in the short term.
TPV Signal Verification
According to the Qinglan TPV system, we first use the 1-hour EMA55 as the dividing line for bullish and bearish. The current price of 80,461 is far above EMA55 at 79,378, and in the past 8 1-hour candlesticks, the closing price has been greater than EMA55 8 times, with no times crossing below it, indicating that the price is firmly in the bullish zone, with no consolidation signal. The current price is 1.36% away from EMA55, which does not meet the consolidation threshold, belonging to a one-sided trend.
Long Conditions Verification: First, the price is stable above 1H EMA55, with 2 consecutive 1-hour candlesticks closing above EMA55; this condition is fully met, in fact, there have been 8 consecutive candlesticks above it. Second, support stably forms; is there a long lower shadow after breaking through 80,000? From the 15-minute chart, the price briefly retraced near 80,000 but quickly rebounded, forming an effective low point support. Third, bearish momentum weakening, have the MACD bars shortened over 2 periods? Currently, the MACD bar at the 1-hour level is 18.05, with the previous one around 15.6, indicating actual expansion, not weakening. But note, our long conditions require all three to be satisfied; currently, the third condition is not met because the MACD bars are still expanding, indicating bullish momentum is still being released, with no signs of exhaustion. Therefore, the system signal is: the bullish trend is clear, but not at exhaustion point, suitable for holding with the trend, but caution is needed when chasing highs.
On-chain Funding Situation
On-chain data shows that the Fear and Greed Index is at 40, in the fear range. This value is quite interesting; the price has reached a historic high, but market sentiment remains fearful, indicating low retail participation, which is often a signal of continued momentum as the major forces have not yet reached the selling stage. BTC's market dominance is 58.67%, at a high level, indicating funds are concentrated in Bitcoin, while altcoins are relatively weak. In the past 24 hours, 505 million was liquidated across the network, with shorts being the main victims, and the shorts being cleansed, alleviating pressure for the subsequent rise. However, also note that after the bearish liquidation, there may be a short-term lack of counterparties, making retracement easy.
Key Offensive and Defensive Levels
The first resistance level above is at 81,000, an integer level and near the previous high point. The second resistance level is at 82,000, a psychological level. The first support level below is at 80,000, which is the recently broken integer level and serves as the dividing line between bulls and bears. The second support level is at 79,378, which is the 1-hour EMA55; if the price falls below here, the bullish trend may weaken. The third support level is at 78,500, near the 4-hour MA10.
Trading Ideas
Direction: The bullish trend is clear, but the short-term RSI is close to overbought, so chasing highs is not advisable. It is recommended to wait for a low buying opportunity after a retracement or to enter as the trend confirms after a breakout.
Entry Conditions: If the price retraces near 80,000 and shows stability signals, such as a long lower shadow or bottom formation in the 15-minute chart, while the MACD bars start to shorten at the 1-hour level, one can go long with a small position. If the price directly breaks through 81,000 and stabilizes, one can chase long, but positions should be controlled.
Stop Loss Level: Long stop loss set at 79,500, below 1-hour EMA55; if it falls below here, the bullish structure may be compromised. Chasing long stop loss set at 80,500 to prevent false breakouts.
Target Levels: First target at 81,000, second target at 82,000. If the market is strong, it could reach 83,000.
Risk Warning
The current price is at a historical high, with RSI close to overbought; the short-term retracement risk cannot be ignored, please strictly control positions and do not heavily chase highs.
Follow the Qinglan Crypto Classroom to seize more trading opportunities! Welcome to visit www.qinglan.org
📊 Qinglan TPV Trading Strategy Backtest Reference
🕒 Last Backtest Time 05-05 07:00:01
Total Analysis: 1307 Backtests: 1301 Accuracy: 67.6% (879/1301)
免责声明:本文章仅代表作者个人观点,不代表本平台的立场和观点。本文章仅供信息分享,不构成对任何人的任何投资建议。用户与作者之间的任何争议,与本平台无关。如网页中刊载的文章或图片涉及侵权,请提供相关的权利证明和身份证明发送邮件到support@aicoin.com,本平台相关工作人员将会进行核查。