1. Shape Definition
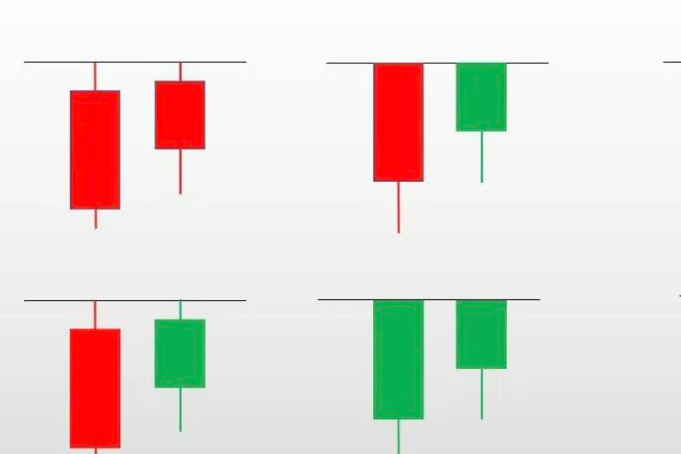
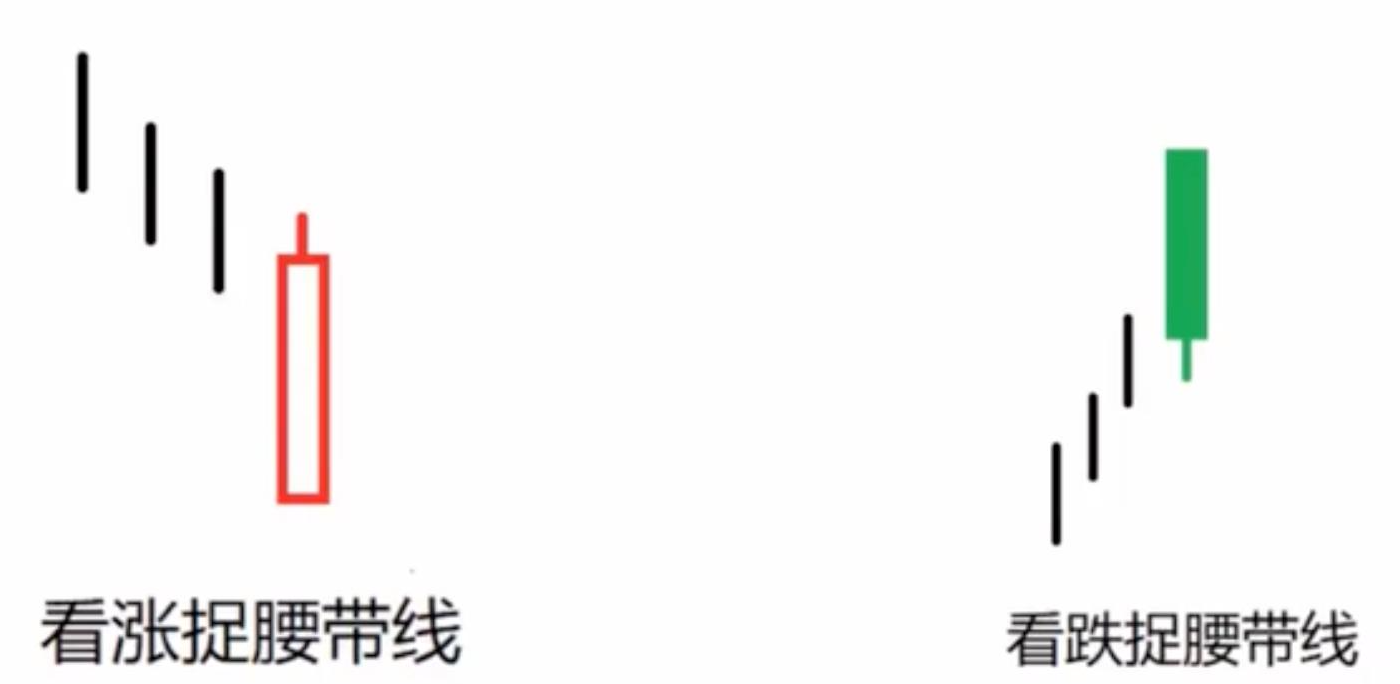
The bearish grabbing belt line is a single strong reversal candlestick, which appears at the end of an uptrend, at wave highs, and at important resistance points. The classic features of the pattern: the opening price is the highest price of the day, with almost no upper shadow. After the opening, the price fluctuates downwards and closes with a long bearish candlestick body, the lower shadow is extremely short or non-existent, and the closing price is close to the lowest price of the day, showing an overall no-head long bearish, one-sided drop structure.
2. Core Market Logic
After a round of continuous rise, the bullish buying momentum is completely exhausted, and high-level buying dries up; the bears seize the opportunity to launch an attack, directly suppressing the price at the opening, firmly controlling the market throughout the day, with panic selling and concentrated selling pressure being a clear signal of an instant reversal of bullish and bearish forces, changing the trend from rise to fall.
3. Effective and Ineffective Distinction
The three elements of an effective signal: high position + no-head long bearish body + synchronized volume increase. When all three are present, the probability of a peak and drop is extremely high. Ineffective signals: occurring in the midst of a decline, in a sideways fluctuation range, or when the body is short, shadows are messy, or volume is decreased with a bearish close, do not qualify as a standard bearish grabbing belt line and should not be used as a reversal basis.
4. Practical Trading Rules
For Long Positions: Once you see a standard pattern at a high position, prioritize taking profits in batches, not being greedy for the last rise in profits, and avoid the risk of a plunge from a high position.
For Those Wanting to Short: Do not rush to enter the market that day, patiently wait for the next day’s closing price to drop below the minimum point of this candlestick, and then test the short position lightly after the pattern is confirmed.
Risk Control Settings: Consistently set stop-loss above the opening price of the grabbing belt line. If it subsequently breaks above the opening price, it indicates the pattern has failed, triggering a false breakdown washing out, immediately stop-loss and exit, do not hold positions.
5. Simplified Mnemonic
High position no-head long bearish line, the opening is the highest point; volume forms the grabbing belt, the bulls are over, the bears come; if it breaks low the next day, follow up, stop-loss above the opening.
Warm Reminder: This article is for the popular science education of candlestick technical patterns and does not constitute any investment reference or operational advice. The market is highly volatile, trading is risky, and it is essential to approach it rationally, strictly controlling positions and risk.
If you want to get more timely market interpretations and practical communication, or consult super member services, you can like, follow, and apply to join the free 🐧 group:746191163
免责声明:本文章仅代表作者个人观点,不代表本平台的立场和观点。本文章仅供信息分享,不构成对任何人的任何投资建议。用户与作者之间的任何争议,与本平台无关。如网页中刊载的文章或图片涉及侵权,请提供相关的权利证明和身份证明发送邮件到support@aicoin.com,本平台相关工作人员将会进行核查。