The spot demand is warming up, but the futures market shows a clear bearish sentiment, continuing the range-bound pattern.
Written by: Glassnode
Translated by: AididiaoJP, Foresight News
Bitcoin is still suppressed below the real market mean, with support located in the range of $65,000 to $70,000. Spot selling pressure is easing, capital flow is tending to stabilize, but demand remains weak. Heavy short positions leave room for a squeeze in the range-bound market.
Summary
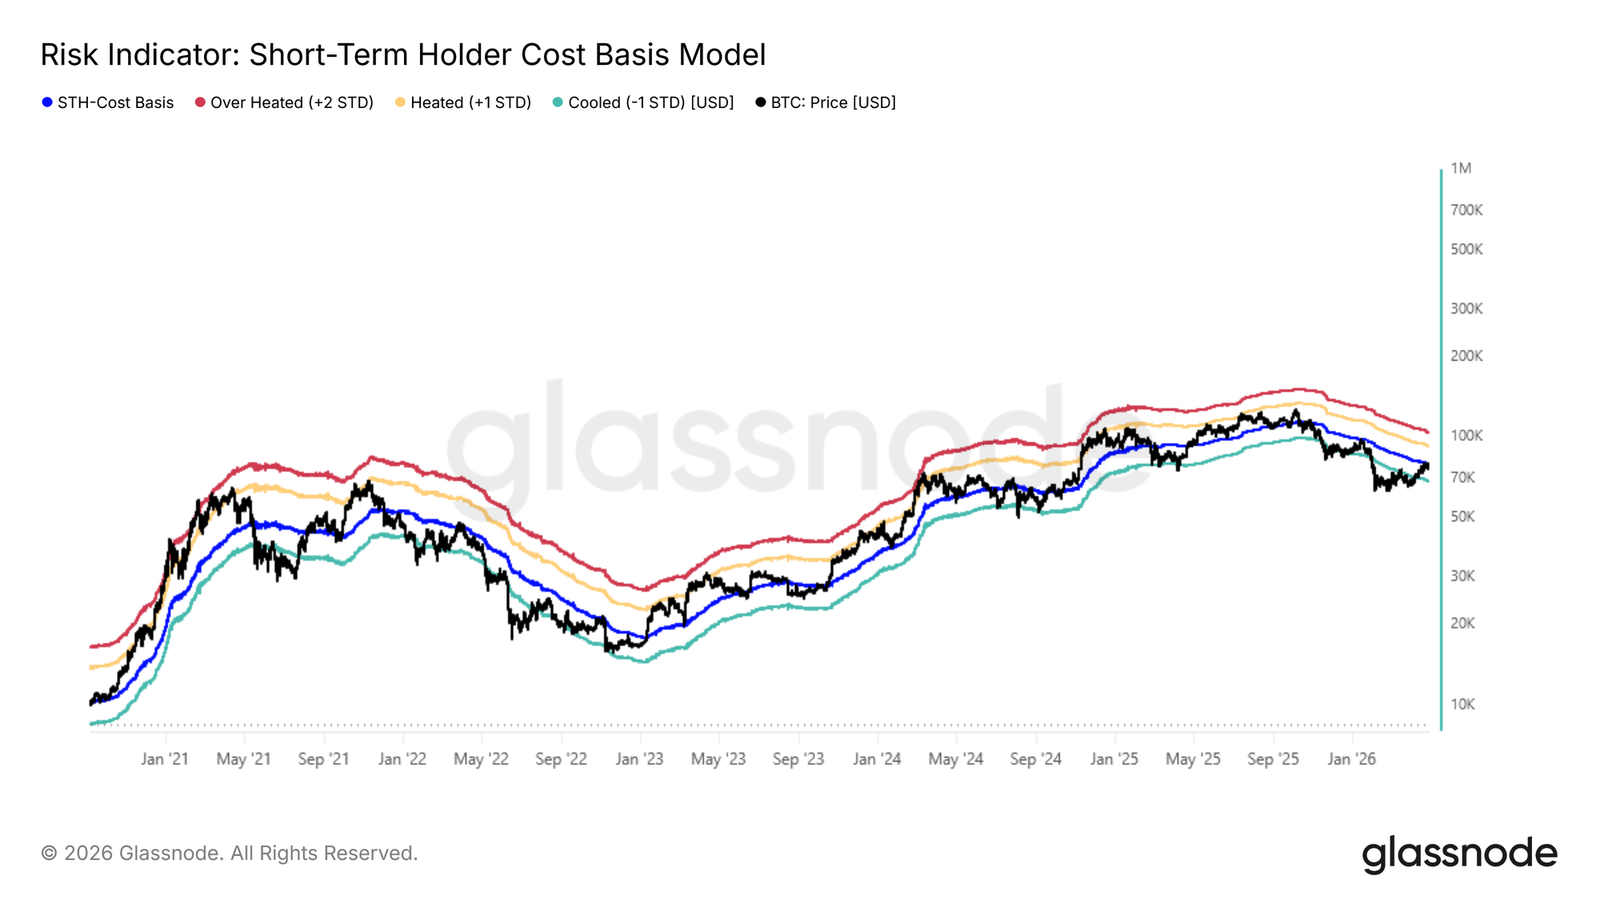
- The price break at the real market mean (approximately $79,000) and the cost basis of short-term holders encounters resistance, reinforcing the mid-term bearish bias.
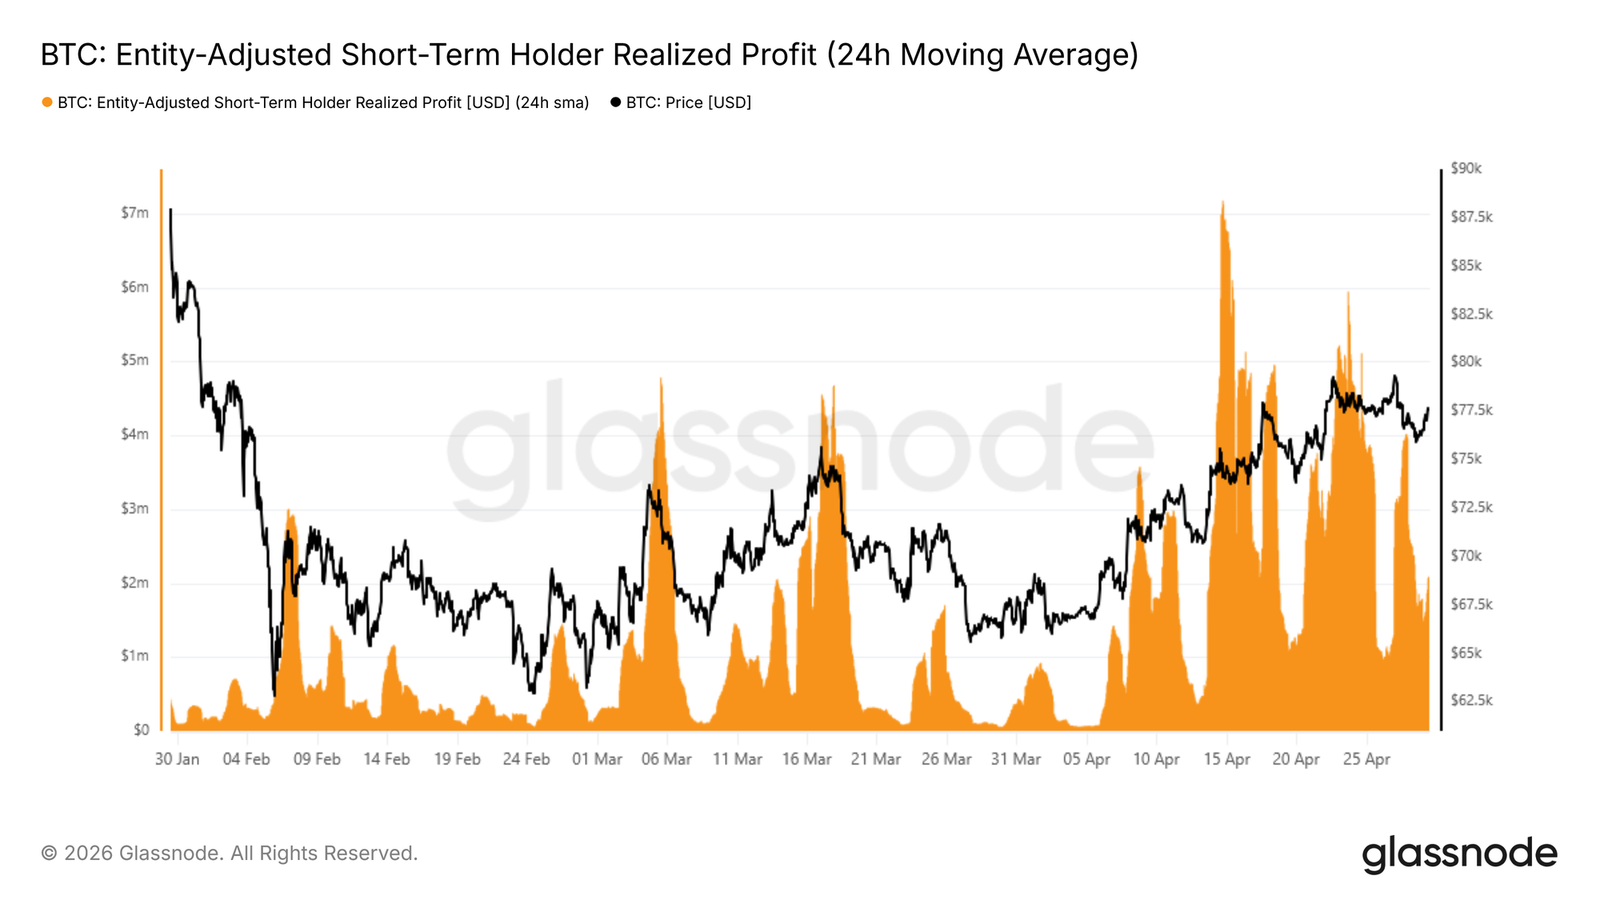
- Short-term holders realized profits surged to $4 billion per hour, reflecting significant profit-taking pressure that limits the sustainability of rebounds.
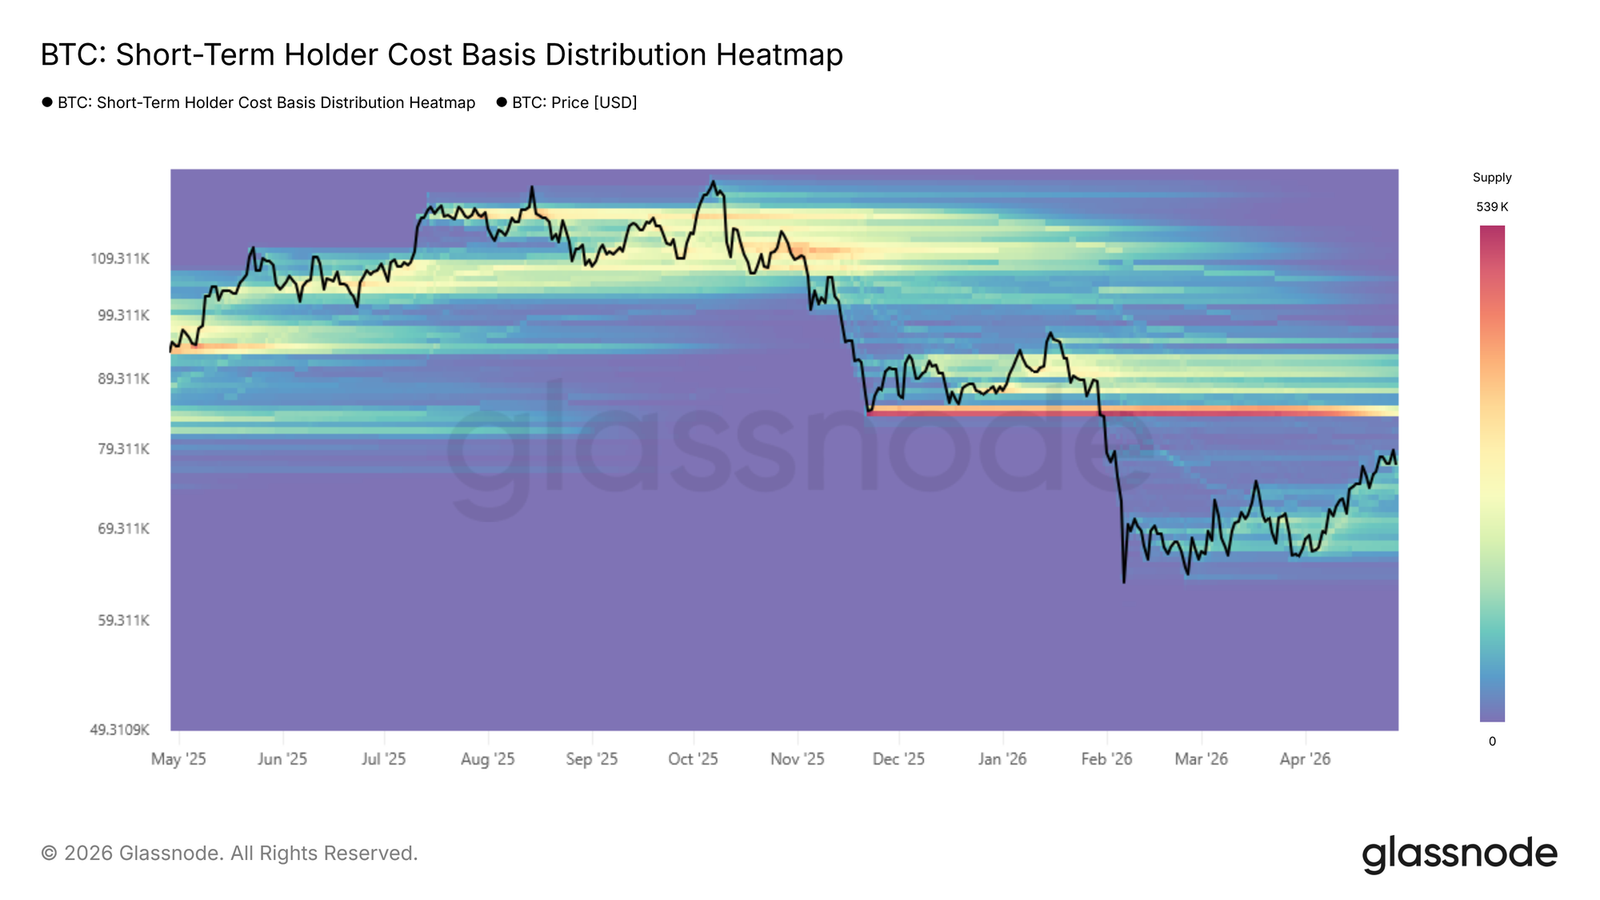
- The dense accumulation cluster between $65,000 and $70,000 constitutes short-term support, but a breakdown would weaken the short-term structure.
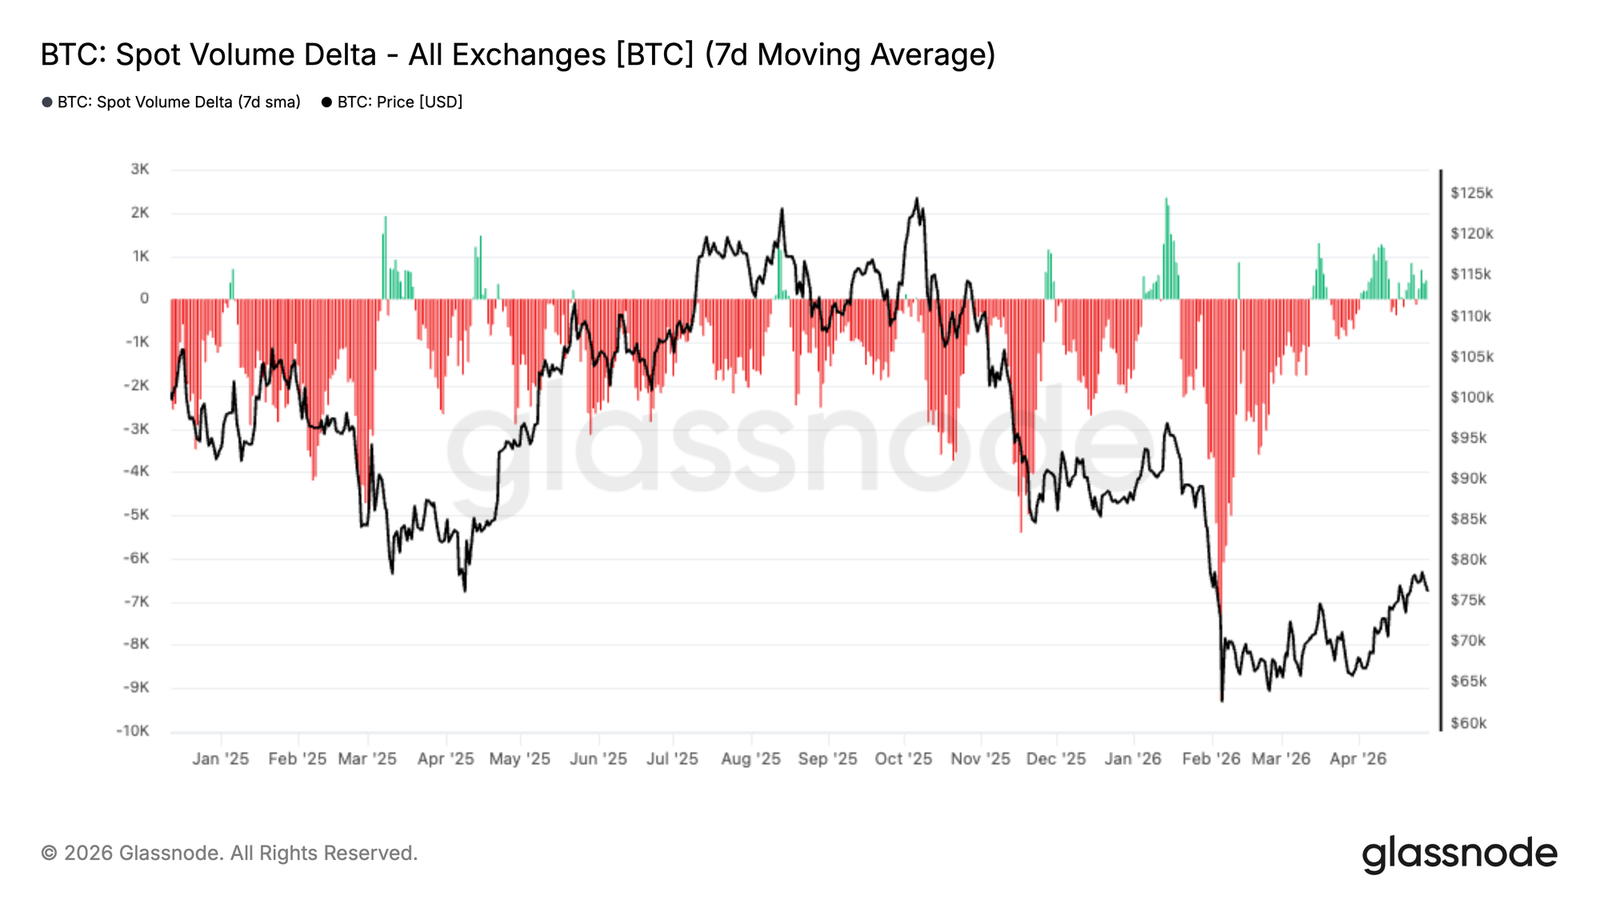
- Spot selling pressure is easing, with the volume delta rebounding to near neutral, and early signs of buyers re-entering the market.
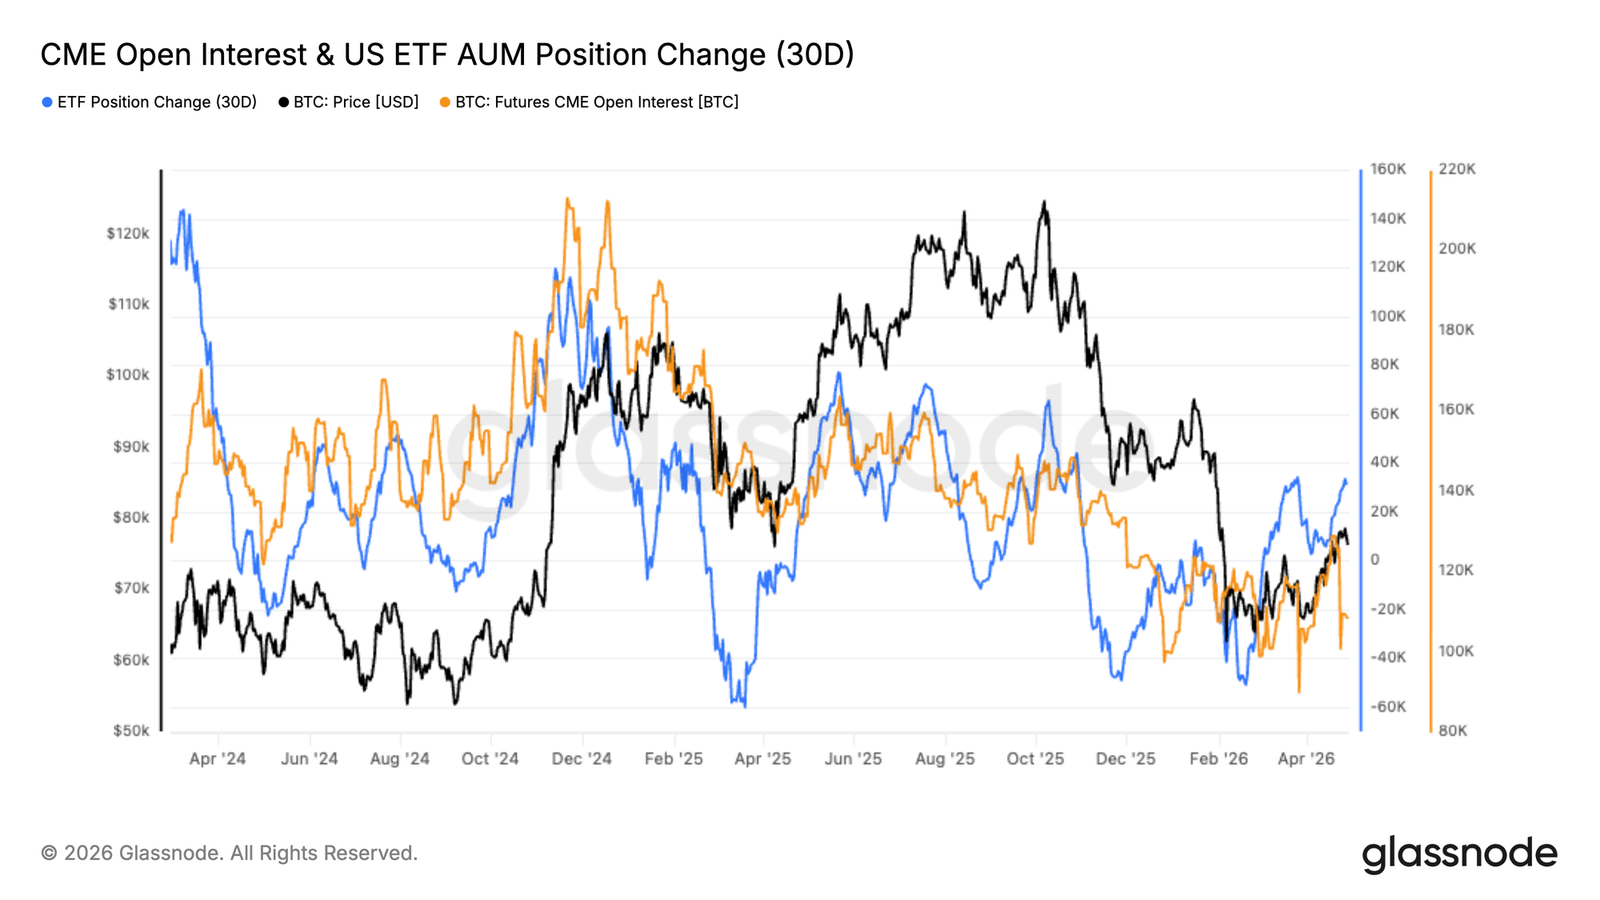
- Institutional capital flow is stabilizing, ETF assets under management are rebounding, and CME open interest has started to bottom out after continuous outflows.
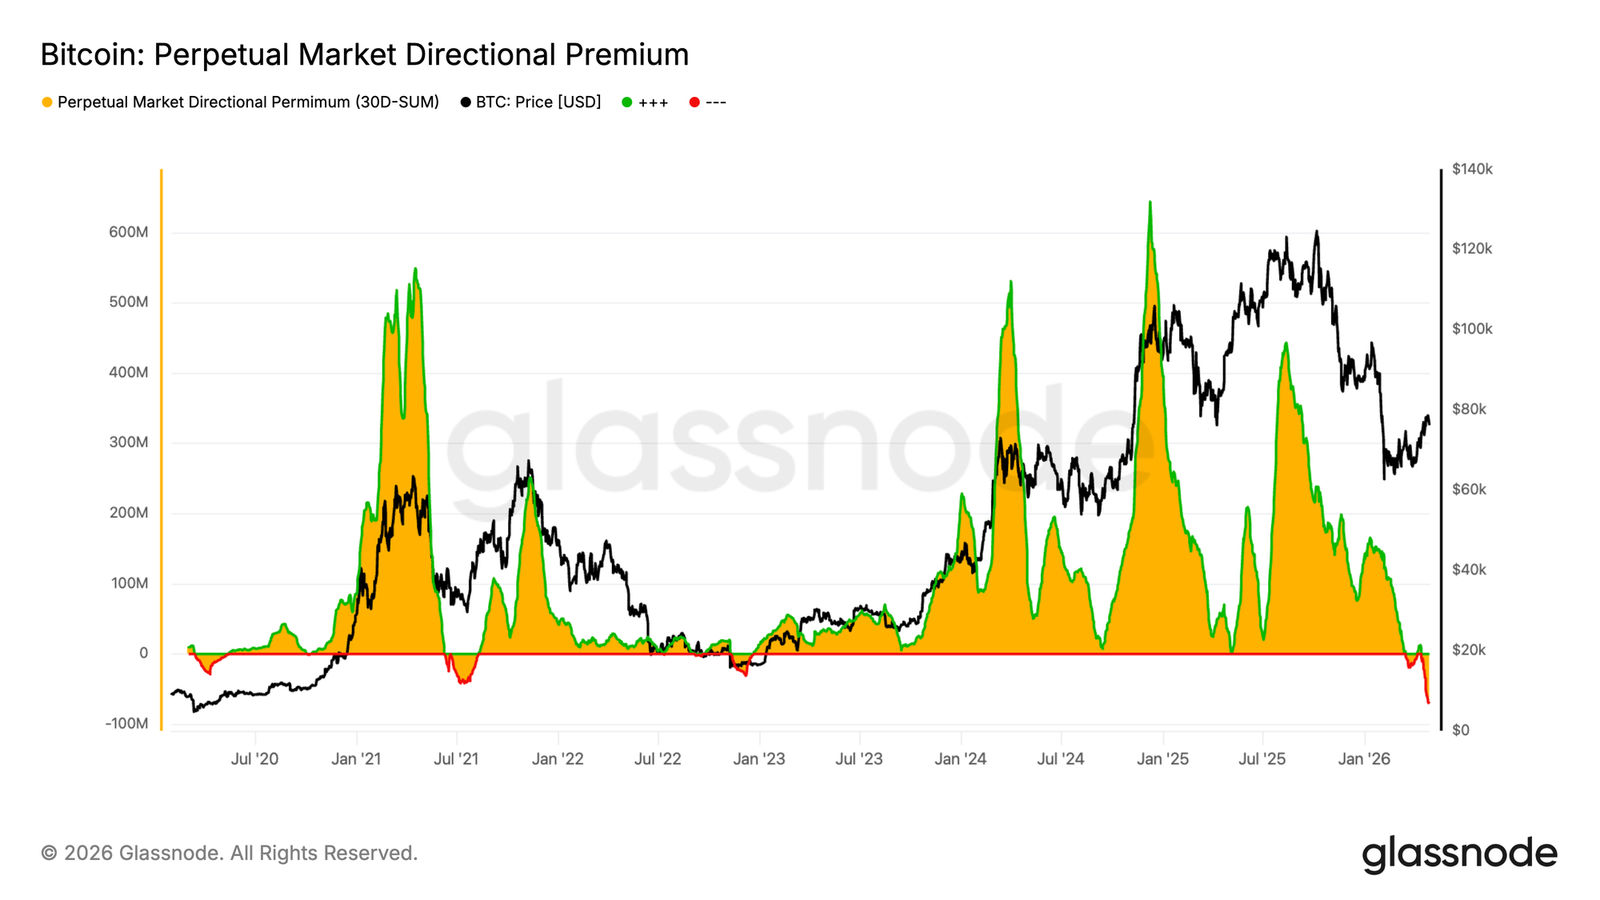
- Perpetual contract positions have shifted to a record net short bias, highlighting increased hedging activity and potential squeeze possibilities.
- Volatility continues to compress, and while protection demand rises, confidence is weak, reinforcing a cautious and range-bound pattern.
- Realized volatility and implied volatility are highly consistent, confirming that the market background is calmer, with limited directional conviction.
On-chain Insights
Breakthrough encounters resistance, focus shifts to support line
Last week, this report identified the cost basis of short-term holders and the real market mean as the most likely resistance area for the current bear market rebound. Recently, the profit-taking by buyers surged to historical levels consistent with local tops. The price subsequently encountered rejection in this area, unable to maintain above the real market mean of $78,000 and the cost basis of short-term holders at $79,000. This behavior is a textbook pattern in a bear market: the price approaches the breakeven point for the most price-sensitive groups, with exit incentives overpowering growing demand, thus exhausting upward momentum.
With this rejection confirming upper resistance, the mid-term bias turns toward further downward pressure, and attention now shifts to the $68,000 level, near the -1 standard deviation zone, as the most immediate structural support that needs close monitoring.
Downward Analysis
The drop at the cost basis of short-term holders is not just a price observation; on-chain spending data accurately captures how it unfolded. The 24-hour simple moving average of profit realization for short-term holders is an indicator measuring in real-time how aggressively recent buyers convert unrealized gains into exits.
As the price approached $80,000, this indicator surged to approximately $4 million per hour, about four times the base level established since mid-April, confirming short-term holders seizing the rebound as a distribution opportunity. Buyers completely lacked sufficient liquidity to absorb this wave of profit-taking, thereby restricting momentum and triggering subsequent rejection.
This indicator is most useful when analyzing two dimensions simultaneously: the benchmark line (as a proxy for broader buyer liquidity trajectory) and the peaks (which have served as reliable local top indicators in the current bear market cycle).
Two scenarios, one cluster
The resistance at the real market mean and short-term holder cost basis area reinforces the broader structural weakness unique to this bear market. However, the picture is not entirely bearish.
The dense accumulation cluster built between $65,000 and $70,000 over the past two months reflects a notable level of buyer conviction at these levels, providing a foundation for a short-term rebound towards the upper supply cluster near $84,000.
Conversely, if the market fails to absorb ongoing selling pressure from the real market mean zone, then the same accumulation cluster at $65,000–$70, more specifically the cost basis of short-term holders near the -1 standard deviation at $68,000, will become a key support reference for the short to mid-term. Therefore, the path forward depends on whether buyers within this range can maintain sufficient conviction to overcome the upper distribution pressure.
Off-chain Insights
Selling pressure eases, buyers re-emerge
Spot volume delta has remained in deep negative territory for most of the past few months, reflecting ongoing net selling pressure from exchanges. This sustained seller dominance aligns with broader retracements, particularly during periods of significant pullbacks to the approximately $60,000–$70,000 range.
However, recent data has shown a distinct shift. The 7-day average line has now rebounded to near neutral and has begun to show intermittent positive delta surges. This indicates that selling pressure is easing, and buyers are beginning to re-enter the market at current levels.
From a market structure perspective, this shift is significant. While it does not yet indicate strong accumulation, the move towards balance suggests an improvement in spot demand and reduced urgency on the seller's part. For a more sustained recovery, a continued expansion into positive territory is needed to confirm that buyers are regaining control.
Institutional liquidity reconstruction
Institutional positions are starting to stabilize, with CME open interest and U.S. spot ETF assets under management showing early signs of recovery after a period of outflows. ETF position changes have rebounded from deep negative territory, while CME open interest seems to be bottoming out, indicating early re-engagement.
The early decline reflected a broad risk-averse stance, with capital exiting both the futures and ETF channels during the pullback. The recent upward movement indicates cautious re-accumulation rather than aggressive positioning.
Continued inflows will be necessary to support a stronger trend. Currently, the data suggests early re-engagement by institutions, but full conviction has not yet been demonstrated.
Record net short bias
The directional premium in the perpetual contracts market has dropped to the most negative level on record, marking the deepest sustained net short bias in this dataset. Unlike the negative values correlated in previous cycles, this movement reflects a more enduring defensive stance.
The extreme discounts are driven by various factors. Recent price weakness has triggered increased hedging and direct shorting in the perpetual market, while earlier crowded longs were forced to liquidate, accelerating this move. At the same time, weak spot demand and soft ETF capital flows have reduced natural buying pressure, allowing derivatives to dominate short-term price action.
Historically, such extremes have occurred during highly uncertain periods and often precede turning points. While short-term uncertainty remains, the market is increasingly preparing for a potential squeeze if sentiment or spot demand improves.
Implied volatility declining across the curve
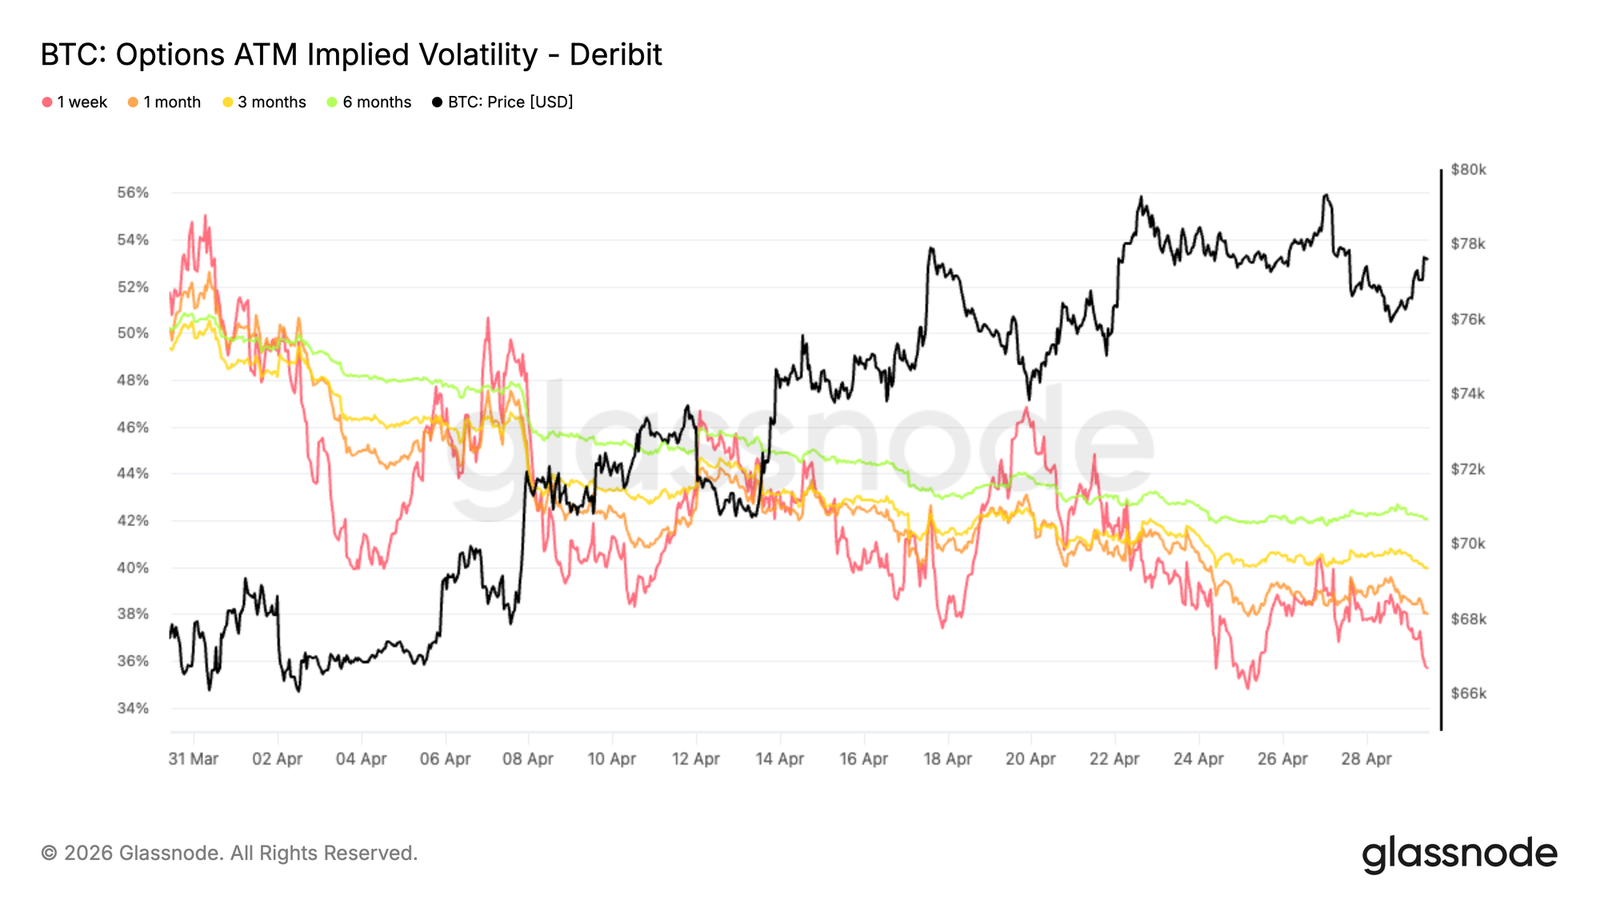
Looking back to April, the dominant trend has been widespread compression across various maturities in implied volatility.
The 1-week ATM volatility decreased by approximately 16 percentage points, while the 6-month maturity fell by about 8 percentage points. Other maturities are within this range, averaging a decrease of about 10 volatility points.
The curve remains in a state of positive price spread, meaning longer-term options are still trading at a premium over shorter-term options, but at lower levels. This reflects the market pricing in a more stable environment for the future.
Lower implied volatility reduces the cost of options, especially call options. Meanwhile, protection demand seems to have eased. Traders are no longer willing to pay high premiums for volatility exposure, which is consistent with the recent price recovery, indicating expected normalization rather than conviction accumulation.
25 Delta skew downtrend, but protection remains
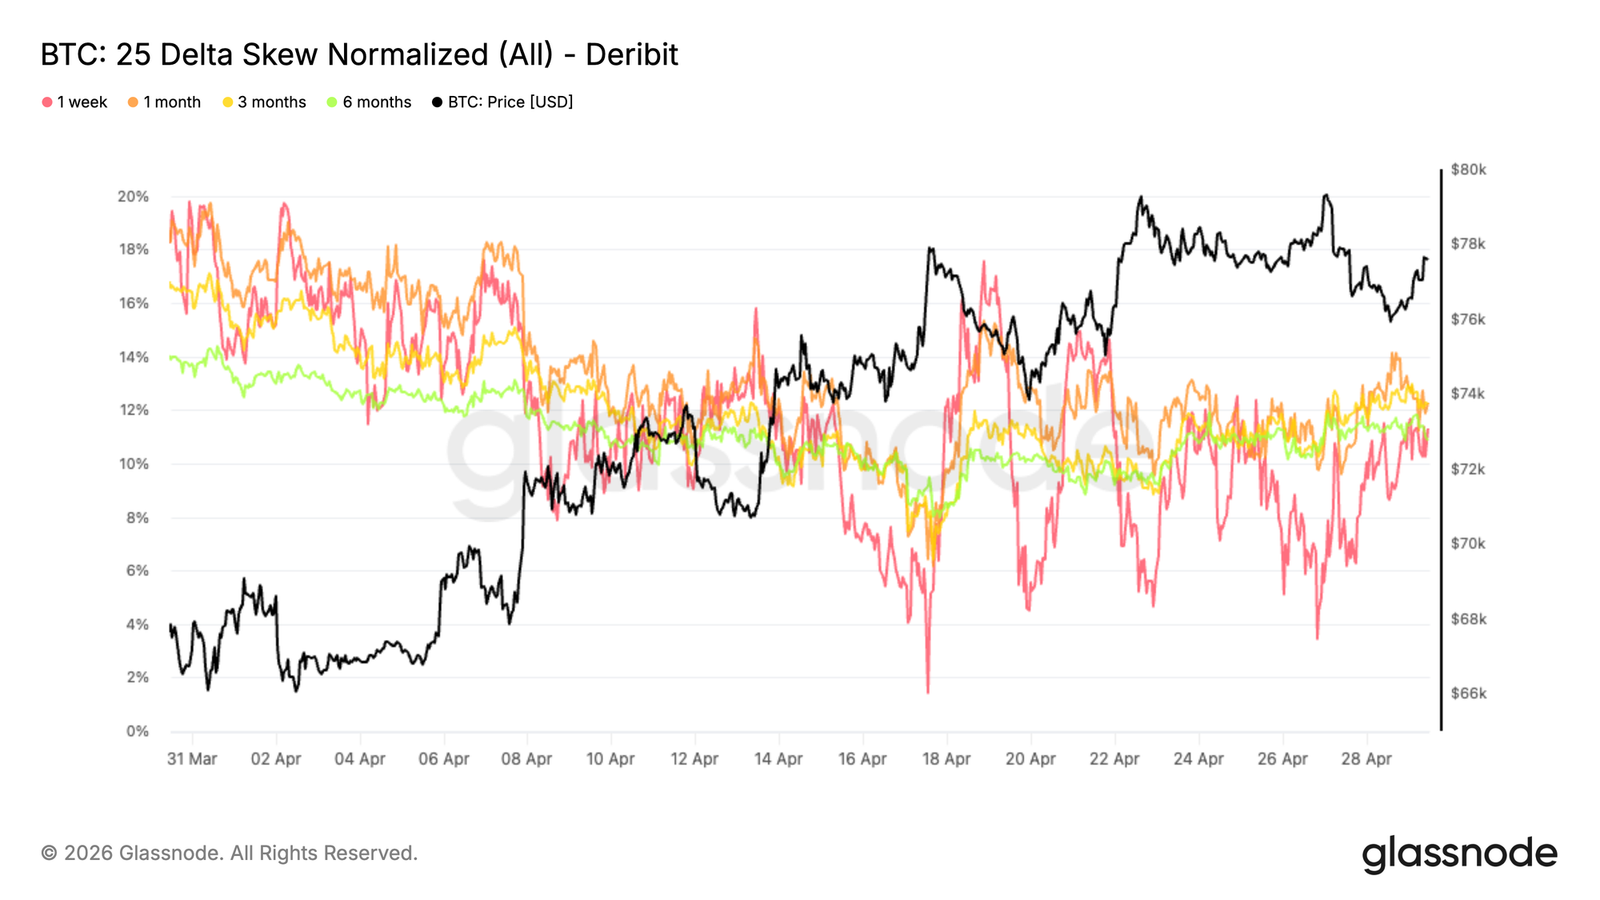
As implied volatility compresses, the skew shows how protection demand has evolved since April. The broader trend is a steady decrease in put option premiums, with the 1-month skew dropping from about 18% to 12%. This reflects a notable reduction in downside protection demand as conditions stabilize.
On the short-term end, the 1-week skew reacted more sharply, experiencing several spikes towards neutral (2%–4%) at various points in April. These moves were mainly tactical, as pullbacks were used to buy call options and sell puts, temporarily flattening the skew.
Recently, as the price approached $80,000 resistance, put option demand has risen again, pushing the skew for all maturities back into the 11%–12% range. Protection remains, with the market making tactical adjustments in the short term while maintaining a cautious stance at the further end of the curve.
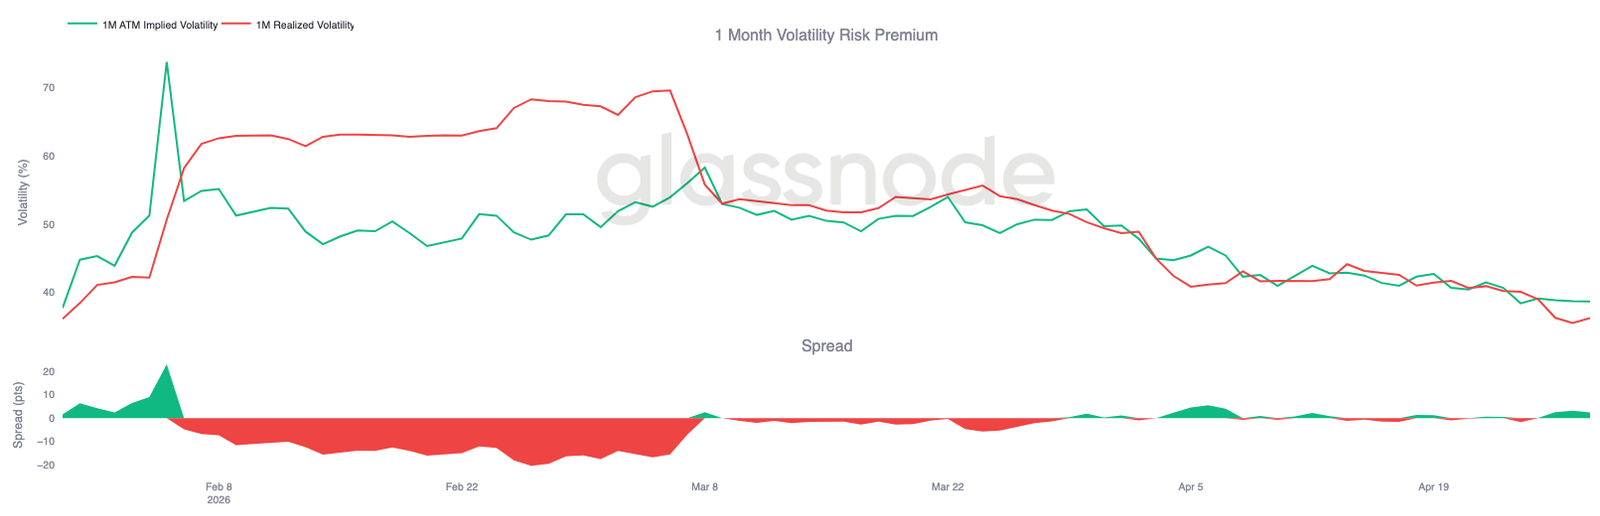
Realized volatility confirms downward shift
As implied volatility continues to compress, realized volatility is also moving in the same direction and reinforcing the trend. Bitcoin's realized volatility has been steadily declining. This is important because realized volatility anchors how options should be priced. When realized volatility decreases, it naturally pulls down implied volatility as the need for pricing large price fluctuations diminishes.
This creates a feedback loop: cheaper options reduce the urgency of hedging, leading to decreased price moves driven by hedging.
The 1-month realized volatility is around 36, while implied volatility is close to 38, leaving only a small premium for volatility sellers to assume risk.
The current environment reflects a shift from pressure to a more balanced situation. Volatility is no longer aggressively bought, and the market seems comfortable with the expectation of a narrower price fluctuation range.
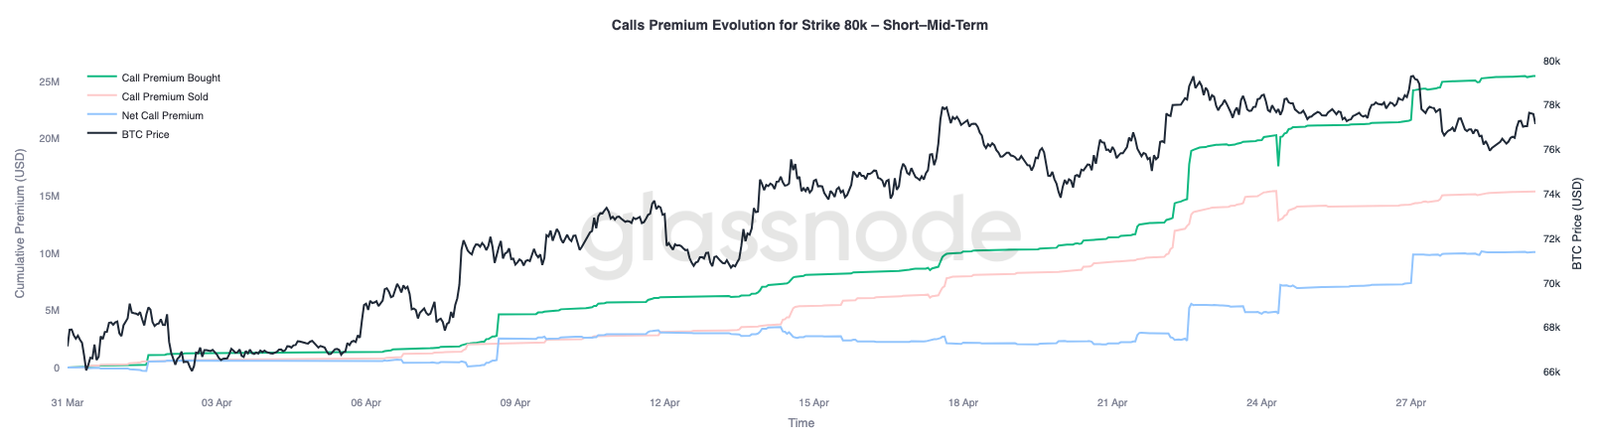
$80,000 strike price premium accumulating as a key pivot
As volatility and skew have eased, positions have become the next layer to monitor, with the $80,000 level becoming the next focal point.
Short and mid-term maturities are experiencing continued buying at the $80,000 strike price, indicating an increasing interest in exposure above this level. This suggests that traders are positioning to test resistance rather than shorting.
Meanwhile, two key negative gamma regions stand out, down at $76,000 and up at $82,000. These levels may become areas where hedging liquidity amplifies price action, especially in a low liquidity environment.
Breaking above $80,000 would bring spot prices closer to the $82,000 region, where negative gamma could force market makers to buy strongly, reinforcing the trend. Positions remain cautious, but if resistance is cleared, it becomes increasingly likely for a more vigorous upward reaction to occur.
Conclusion
In summary, the market remains trapped below key resistance, with the real market mean continuously limiting upward attempts, while the support clusters around $65,000–$70,000 provide a bottoming support. Spot selling pressure is beginning to ease, and early signs of institutional re-engagement are appearing, but demand has yet to show the strength required for a sustained breakout.
Meanwhile, derivative positions have decisively shifted to a bearish stance, with record net short exposure and high protection demand reflecting a defensive mindset. This has placed the market in a finely balanced state. While the weighting of positions leans cautious, it also leaves room for potential sharp upward misalignment if capital flows shift.
Until there is a clear expansion of spot demand or institutional inflows, the most likely outcome remains a sideways, range-bound environment. The next directional move is likely not solely driven by position changes, but rather depends on whether real capital intervenes to absorb supply and reclaim higher levels.
免责声明:本文章仅代表作者个人观点,不代表本平台的立场和观点。本文章仅供信息分享,不构成对任何人的任何投资建议。用户与作者之间的任何争议,与本平台无关。如网页中刊载的文章或图片涉及侵权,请提供相关的权利证明和身份证明发送邮件到support@aicoin.com,本平台相关工作人员将会进行核查。


