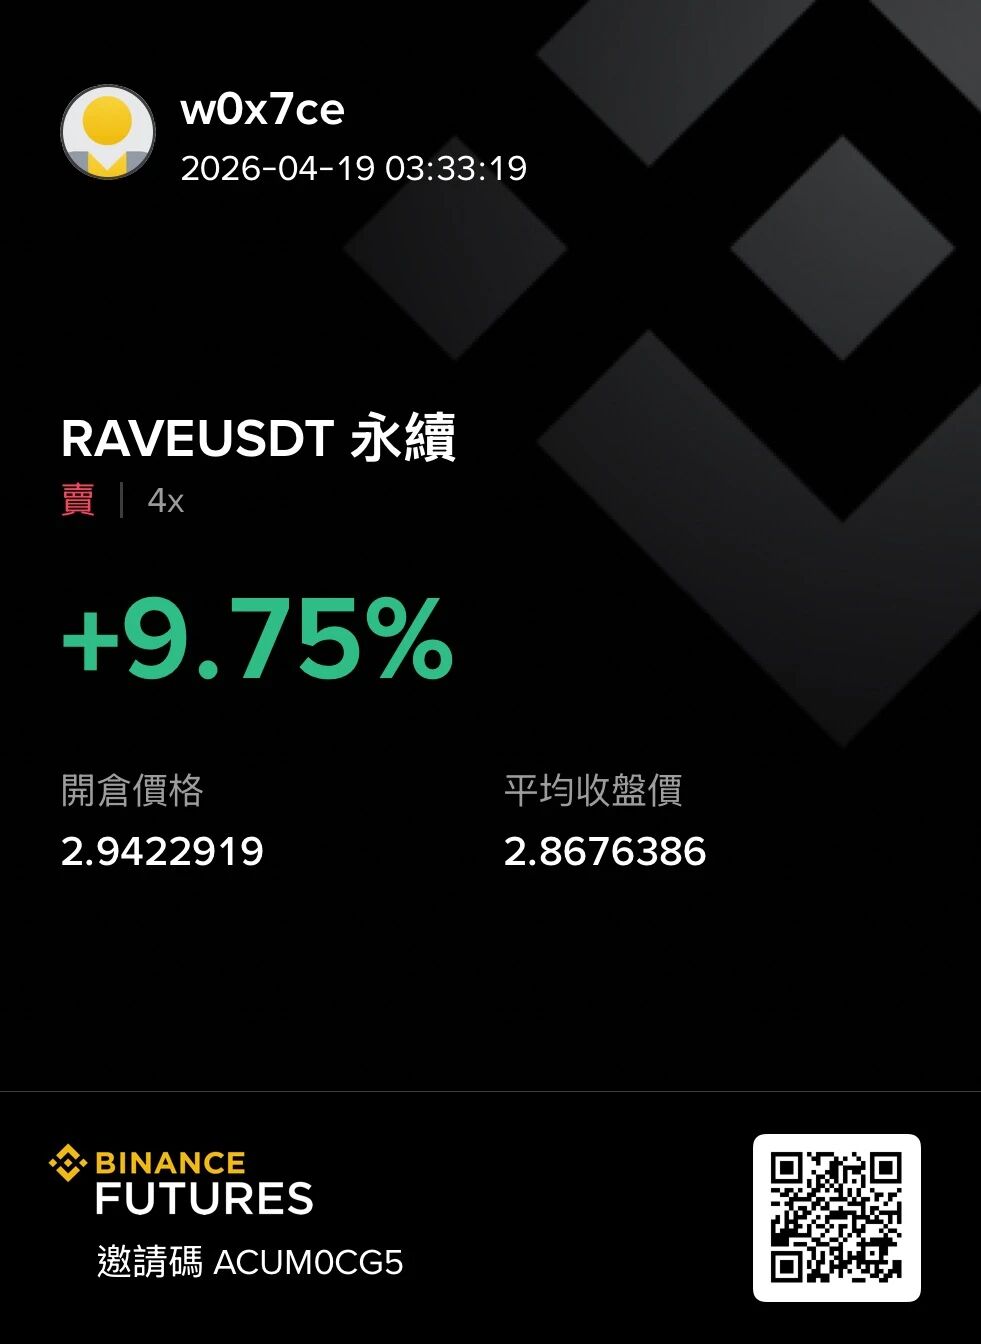
Author: w0x7ce
Introduction
In mid-April 2026, the cryptocurrency market staged a bloody harvest at a scientific level—the $RAVE token experienced a complete cycle of explosive growth, frantic short squeezes, a stepped collapse, and ultimately nearly zero within a very short time. Countless retail investors rushed in driven by the FOMO sentiment during the rise, only to be instantly swallowed by the death spiral of consecutive liquidation. By 3 AM on April 19, the drop was nearing 90%.
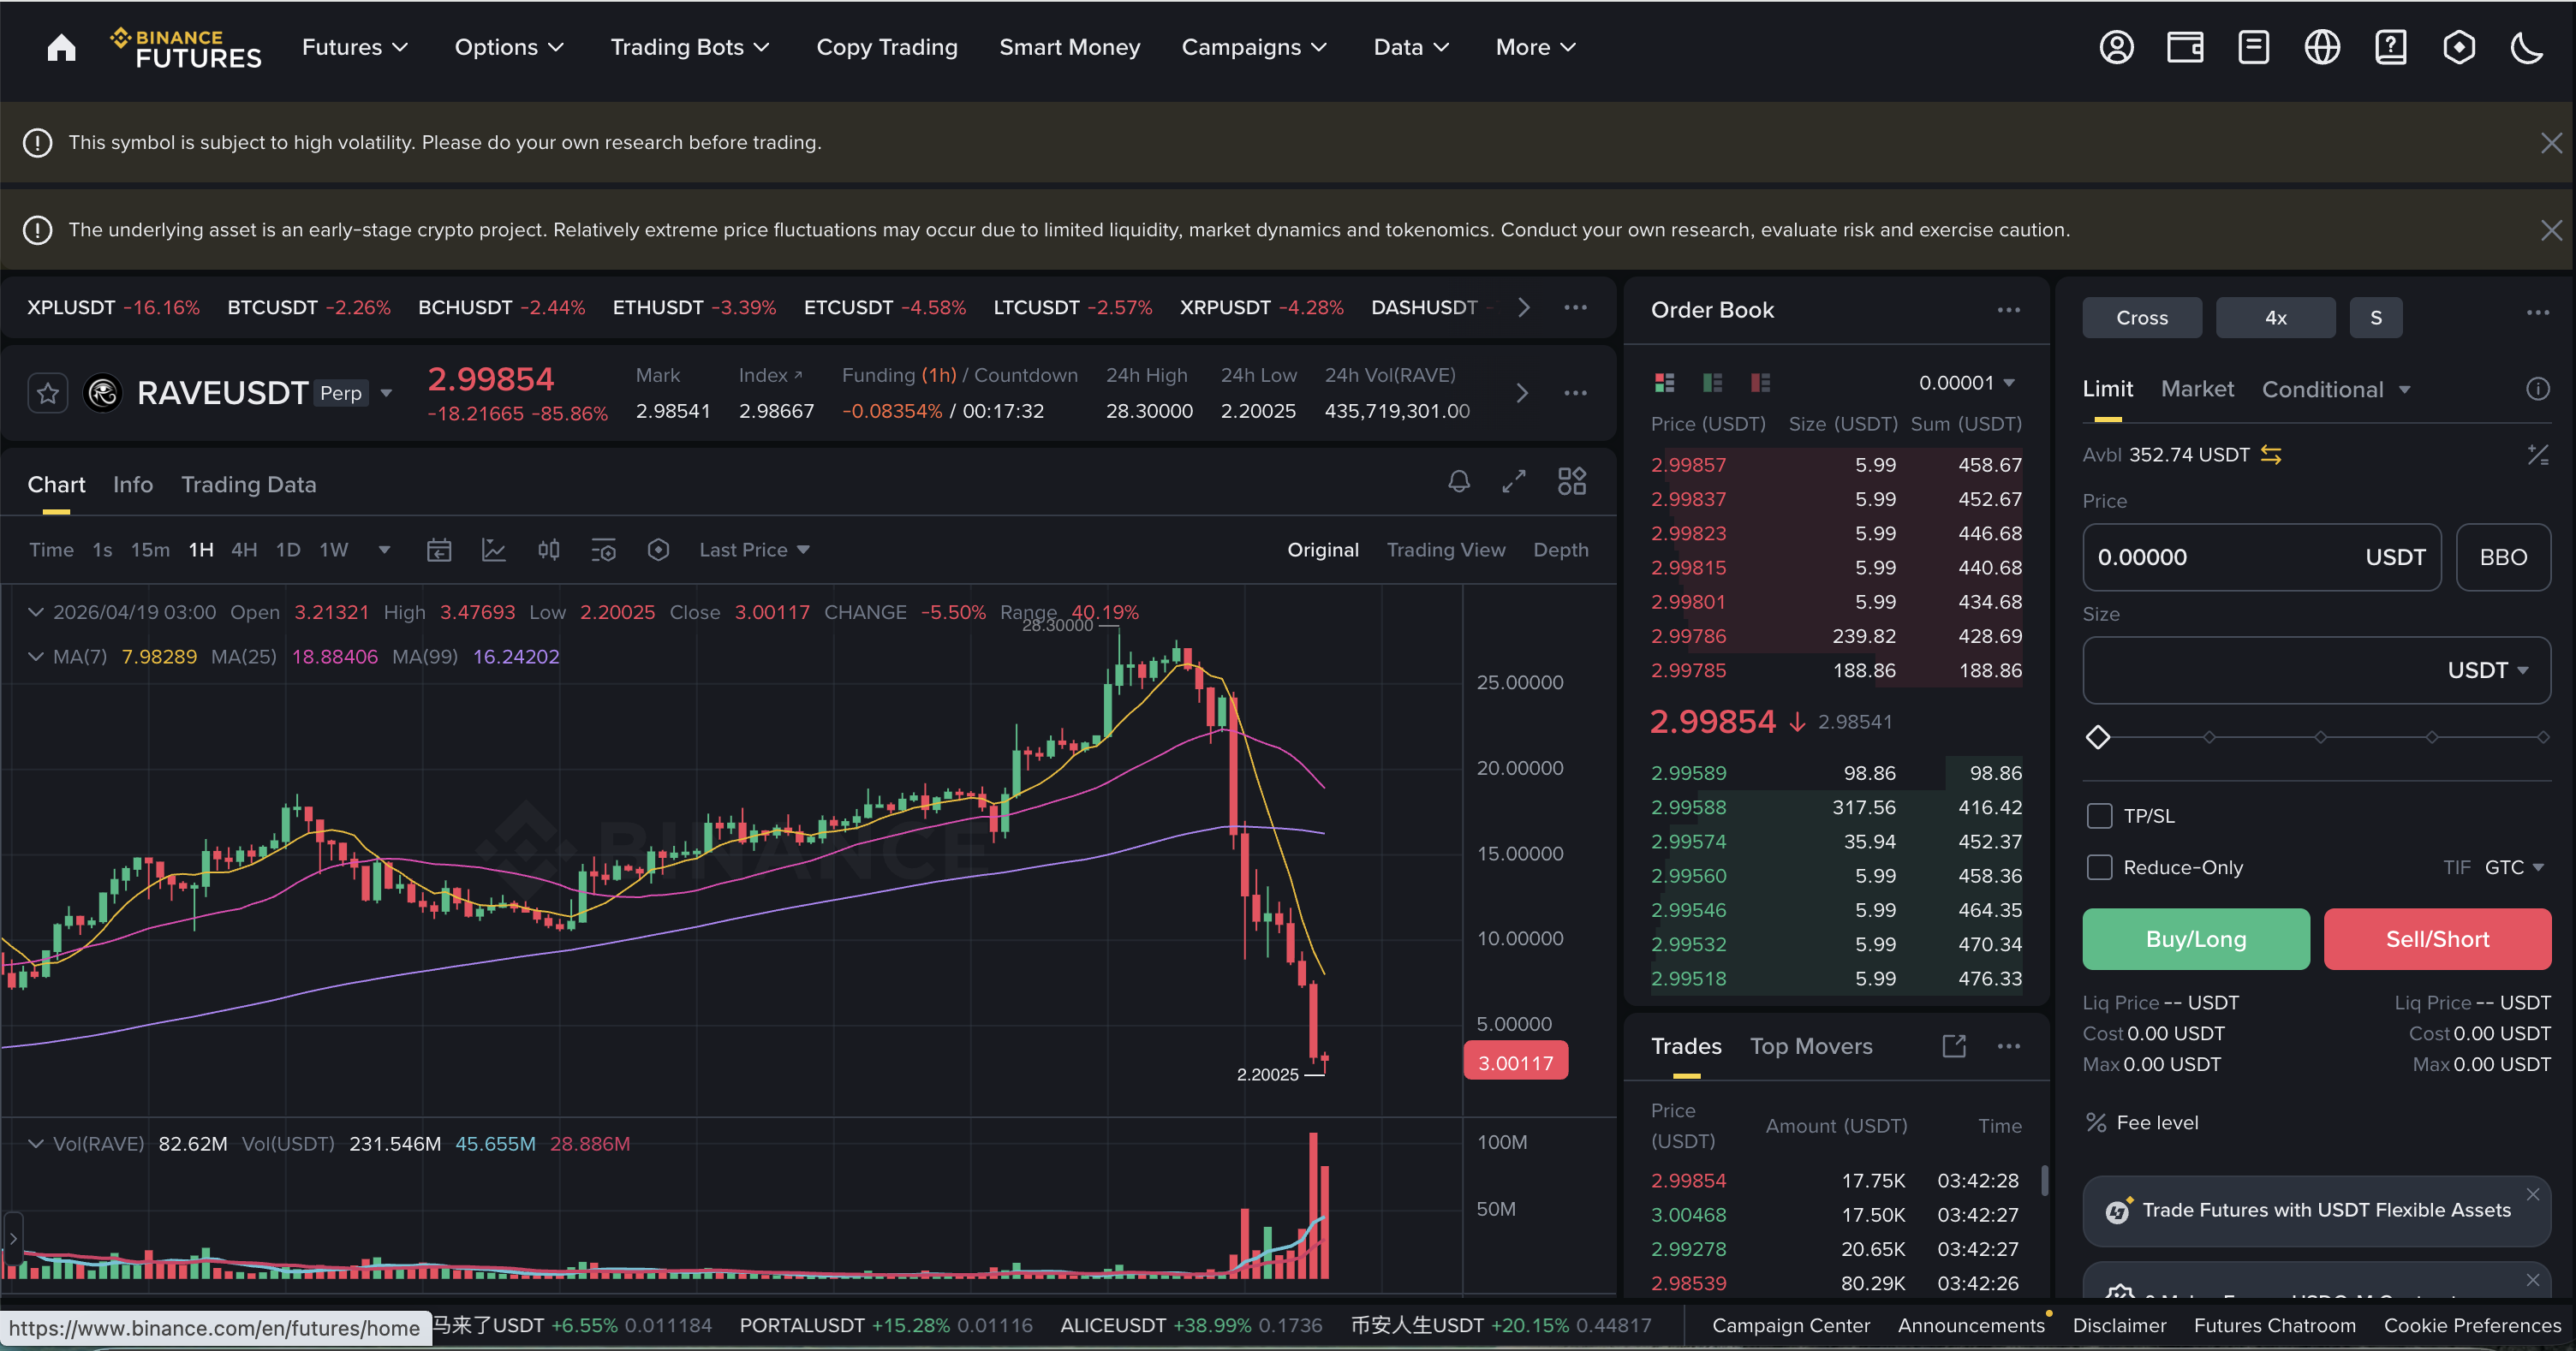
This is not an isolated incident but a standard script replayed repeatedly by highly controlled altcoins. Thus, the following charts were created.

To truly understand this kind of "malicious short squeeze" and "high control," we must move away from pure candlestick charts and delve into microstructural market theory and quantitative finance.
The manipulation by the dealers is not simply "randomly pushing prices," but a meticulously calculated liquidity manipulation and derivative arbitrage. We can decompose this "meat grinder logic" that swallows retail investors whole using several core mathematical and economic models.
This article will take the RAVE event as a case study and, following a complete logical chain of rising (squeezing) → collapsing (instant zero) → stepped decline → aftermath after a sharp drop (death resistance of secondary rise) → limitations of the model, layer by layer analyze the entire process.
Chapter One: Rising Logic—How Dealers Use Precise Calculations to Swallow Retail Investors Whole
Model One: Liquidity Exhaustion and Price Impact Model (Kyle's Market Impact Model)
Dealers can push the price to the sky with minimal funds, at the core of which lies ** "controlling circulation" **. In quantitative finance, we typically use Kyle's (1985) price impact model to explain the effect of orders on market prices.
In a normal market, the price movements can be simplified to the following formula:
- The magnitude of the asset price change.
- The number of buy or sell orders.
(Kyle's Lambda): The reciprocal of the market liquidity depth parameter, representing ** "market illiquidity." ** The worse the liquidity, the larger the value.
Dealer's operation:
Dealers will transfer tokens from the exchange on-chain (withdraw), or remove all sell orders from the spot market. This will lead to a sharp decline in the depth of the spot prices within the exchange, causing.
In such an extreme state of illiquidity, even if the dealer uses a very small amount of funds (e.g., tens of thousands of dollars) to buy at market price, multiplied by a value approaching infinity, it will generate an extremely large value (e.g., an instant rise of 50%). This is why you often see candlesticks of such tokens experiencing "unvolume-driven surges."
Model Two: Funding Rate Bleed Model
The core mechanism of perpetual contracts is the funding rate, which is a "pump" that continuously extracts from retail investors without the dealer having to sell the spot.
The calculation of the funding rate is based on the premium of the futures contract price and the spot index price:
- Price of the perpetual contract.
- Spot index price.
- Benchmark interest rate (usually very small, can be ignored).
Clamp: The upper and lower limits set by the exchange for the funding rate (e.g., a maximum of 2% or -2%).
Dealer's operation:
When retail investors see the price skyrocket and frantically open short positions in the futures market, the massive short selling will pull down the futures price, leading to negative premiums; at this point, the funding rate becomes an extreme negative value (e.g., -2% every 4 hours).
This means that shorts must pay high maintaining costs to the longs.
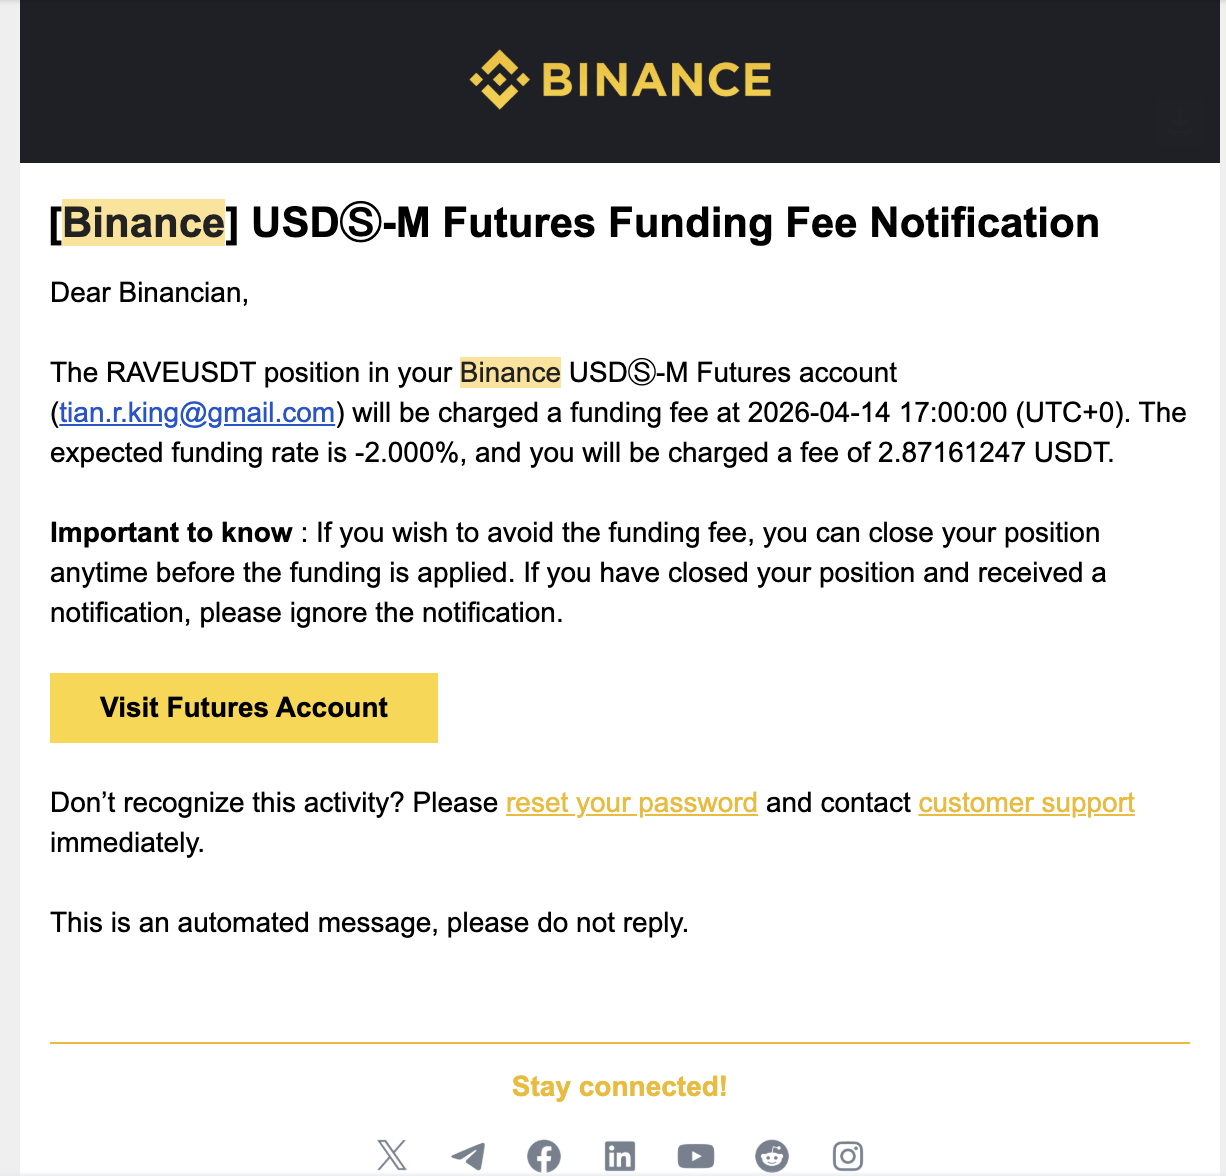
As the largest longs (holding spot while possibly also opening low-leverage long positions in contracts), the dealer's income from funding fees is:
As long as the total amount of short contracts by retail investors is large enough, the dealer can generate millions of dollars in risk-free cash flow daily just from collecting "tolls." This is the mathematical truth behind why dealers "appear to earn a fortune without selling tokens."
Model Three: The Liquidation Cascade Effect
This is the bloodiest aspect of a squeeze, also known as "liquidation." Futures trading carries leverage; when the price rises to a certain extent, the exchange's engine will forcefully take over the retail investors’ short positions and buy at market price to close them.
For an investor in a position with price opening a short position, leverage of , and maintaining a margin rate of , the liquidation price (Liquidation Price) is:
Differential equation of liquidation cascade:
When the dealer pushes the price to , the exchange system will automatically inject a market buy order into the market. Combined with our previous [Model One], this forced buy order will immediately lead to further price increases:
This creates a deadly positive feedback loop:
Price increase triggers liquidation orders that buy at market price, which further raises the price, triggering more liquidation orders that again buy at market price.
Mathematically, this is a divergent exponential function. By this time, the market no longer requires the dealer to spend a dime to push the price; the liquidation orders from retail short positions (forced buying) have become the infinite fuel propelling the price skyward.
Model Four: The Game Theory Conclusion of the Collapse
Finally, we will use **Prisoner's Dilemma** from game theory to explain why the peak of such coins never slowly recedes but rather falls off instantly to "cliff-like zero."
Assuming there are two main dealers (Big Player A and Big Player B) in the operation alliance, who collectively hold the vast majority of spot. At high points, they face two choices: continue to support the price (Hold) or sell to cash out (Sell).
Their payoff matrix is as follows:
table style="width:100%;border-collapse:collapse;margin:10px 0;" pingfang="" sc",="" cambria,="" cochin,="" georgia,="" times,="" "times="" new="" roman",="" serif;font-size:="" 16px;font-style:="" normal;font-variant-ligatures:="" normal;font-variant-caps:="" normal;font-weight:="" 400;letter-spacing:="" normal;orphans:="" 2;text-transform:="" none;widows:="" 2;word-spacing:="" 0px;-webkit-text-stroke-width:="" 0px;white-space:="" normal;background-color:="" rgb(255,="" 255,="" 255);text-decoration-thickness:="" initial;text-decoration-style:="" initial;text-decoration-color:="" initial;"="">>
Big Player B: Continue to Support (Hold)
Big Player B: Sell to Cash Out (Sell)
Big Player A: Continue to Support (Hold)
Both continue to earn funding fees (10, 10)
A goes to zero, B becomes rich (-50, 100)
Big Player A: Sell to Cash Out (Sell)
A becomes rich, B goes to zero (100, -50)
Both trigger liquidation, earning less (20, 20)
In a scenario where the spot price is extremely inflated with no real buy orders beneath (very poor liquidity), whoever sells first can eat up the remaining bit of spot buy orders (Exit Liquidity) in exchange for real USDT.
According to Nash Equilibrium, although both sides continuing to support the price (Hold, Hold) could earn long-term funding fee revenue, the Dilemma is that neither can ensure the other won't betray, making "sell to cash out" a strictly dominant strategy for both.
Therefore, under the absolute drive of interests, the trust within the alliance becomes exceedingly fragile. As soon as the price hits a certain psychological tipping point or there is any sign of wind, one dealer is certain to choose "front-running." When the first massive sell order appears, (liquidity inverse) will similarly act in reverse—very little selling pressure can cause the price to instantly drop by 90%. This is why crashes always happen in an instant.
Chapter Two: Falling Logic—Why Crashes Always Go to Instant Zero
Many retail investors develop a fatal illusion while watching the market: "The price is now $100, even if it falls, it should go down slowly through $90, $80, and $70, right?" But in reality, once the highly controlled tokens crash, the candlestick often resembles a vertical "guillotine" without any rebound, directly plummeting from $100 to $1 or even $0.0001. This phenomenon is referred to in the professional finance field as ** "liquidity vacuum" or "flash crash." **
To understand why prices "instantaneously go to zero" rather than "slowly drop," we need to completely discard candlestick charts and delve deep into the microstructure of order books at the lowest level of trading engines.
The following are the four deep mechanisms that cause prices to instantaneously go to zero:
Section One: The Liquidity Vacuum and the Four Mechanisms of Instant Collapse
1. The "Holographic Illusion" of Price and Liquidity Vacuum
We first need to establish a fundamental piece of financial common sense: the "current price" on the board merely represents "the price of the last transaction" and does not represent the value of the entire board at all.
What supports prices is not market cap, but the "limit buy orders" in the order book.
In a normal market (like Bitcoin): Between $100 and $90, there are thousands of buy orders tightly placed. If you sell, it requires substantial funds to consume all these buy orders, which is called "good depth."
In controlled altcoins (liquidity vacuum): After the dealer pushes the price to $100, there are actually no retail investors taking over below. The order book might look like this:
- $99: 10 buy orders
- $95: 5 buy orders
- $94 to $2: 0 buy orders (this is the liquidity vacuum)
- $1: 1000 buy orders (retail investors placing very low price limit buy orders for fun)
When the dealer decides to offload, directly throwing out an "market sell of 100 coins" command, what will the trading engine do?
It will instantly consume the $99 and $95 buy orders of 15, while the sell orders are still not fully executed (85 remaining). Because there are no buy orders in between, the engine will skip over all prices from $94 to $2 and directly crash into the buy orders at $1.
In the eyes of retail investors, what happens in that second is: the price instantly changes from $95 to $1. There is no buffer in between because there is literally no money at all.
2. The "Unplugging the Network Cable" Self-Defense of Market Makers (Market Maker Withdrawal / Spoofing)
Normally, in order to make the market appear active, dealers or market maker bots will place large amounts of fake buy and sell orders at various price levels (this is called providing liquidity).
However, these bots are very smart and cold-blooded. They have a hard-coded condition in their algorithms: once they detect a one-sided massive selling pressure (for example, when the main dealer starts to sell off) or a volatility breaching a threshold, the bots will withdraw all buy orders within milliseconds.
This is akin to standing on the 100th floor, where a bouncy mat (market maker buy orders) was originally placed. The moment you jump down, they pull away all the mats. You can only crash onto the concrete floor of the first floor. This is also the reason why there are no slight rebounds when a crash occurs.
3. Slippage and Wealth Annihilation
We can explain how wealth "vanishes" out of thin air using the **slippage** mathematical model. Slippage refers to the difference between the expected selling price and the actual transaction price.
In a state of liquidity exhaustion, the average transaction price when selling at market price can be expressed using the following simplified formula:
(where is the limit buy order price, is the number of orders at that price, is your total selling volume)
When the dealer holds 10,000 coins with a paper price of $100, their apparent wealth looks like $1 million.
But if the buy orders below are extremely thin (like the aforementioned liquidity vacuum), the actual weighted average transaction price for these 10,000 coins could be only $2. The dealer ultimately cashes out only $20,000, while the remaining $980,000 in "market value" was not earned by anyone, but directly mathematically annihilated due to the absence of genuine funds to take them.
4. Liquidation Cascade
Combining what we mentioned earlier in the futures market, when a large sell order by the dealer crashes the price from $100 to $50, it triggers大量在高位(例如80、90) 开多单的散户爆仓.
The essence of longs being liquidated is the system's forced **"sell at market price." **
Thus, the dealer's selling triggers forced selling from retail longs. These forced sell orders again crash into the order book that no longer has buy orders, driving the price down to $20 and further triggering margin calls from longs at $50... forming a death spiral until the price hits $0, wiping out all leverage.
Summary of the liquidity vacuum:
Price drops from $100 to $1 without needing $99 worth of sell pressure; it just needs that there are no buyers in between the $99.
In these excessively manipulated markets without fundamental support, high prices are like a thin layer of paper suspended above a bottomless abyss. As long as the dealer pokes through this layer of paper, or the market maker removes the bricks below, the price will adhere entirely to the law of free fall, reverting to its true value—zero—in a second.
Section Two: The Micro Mechanism of Stepped Declines—Why Not a Linear Drop but a "Stair-Step" Collapse
You have keenly observed this phenomenon. In extremely severe crashes, the market rarely presents a perfect vertical line. Instead, we often see a **"stair-step drop."** Each time it breaks through an integer threshold (like from 15 to 14), the price will pause at that position, consolidate or even slightly rebound for several minutes, before continuing the sell-off.
This phenomenon in financial microstructure has very clear physical and game logic. It is mainly caused by the combined effects of the following four mechanisms, each having its respective mathematical characterization:
1. The "Integer Threshold Resistance" of the Order Book: Cumulative Buy Orders at Psychological Price Levels
In the limit order book, retail investors and some institutions have an inherent "round-number bias." When the price is at , many attempting to catch the falling knife will place limit buy orders at integer psychological barriers like $15.00 or $14.00. When the price drops to these levels, the market sells from shorts and sellers' market sell orders collide with this "limit buy order wall."
The essence of consolidation: Sellers need time to consume all these buy orders placed at integer thresholds. This few minutes of consolidation is actually a wear-and-tear battle between longs and shorts at specific price levels. Once the buy wall is completely consumed, the price will instantly slide down to the next vacuum zone.
Mathematical characterization—order book density aggregation model:
We can characterize the density of buy orders near integer thresholds using Gaussian kernel functions. Suppose is the price, and the integer threshold is (), then the buy order density function at integer thresholds is:
- Base order density (sparse buy orders at non-integer price levels).
- Total buy orders surrounding the integer price level.
- Psychological concentration of retail investors' "round number preference." The smaller it is, the more concentrated the buy orders are at integer levels.
When the price is , experiences a peak, forming a "buy order wall." The seller must consume the buy orders over time:
where is the seller's selling rate. This is the mathematical essence of what you have observed as "holding for a few minutes for every dollar drop."
2. Short Covering: Reverse Buying Power
Many overlook a basic trading common sense: closing short positions is in fact a buy (Buy to Cover).
When those who shorted high see the price drop to $10 or $15, they need to lock in profits. To close their positions, they must buy in the market. This massive buying power from short covering creates a short-term counter force against panic selling.
免责声明:本文章仅代表作者个人观点,不代表本平台的立场和观点。本文章仅供信息分享,不构成对任何人的任何投资建议。用户与作者之间的任何争议,与本平台无关。如网页中刊载的文章或图片涉及侵权,请提供相关的权利证明和身份证明发送邮件到support@aicoin.com,本平台相关工作人员将会进行核查。


