
Author: Ali Charts
Compiled by: Yuliya, PANews
If you want to accurately judge the timing of the end of the bear market and the beginning of the bull market, you must look at the 3-day chart. This timeframe is the best observation point for Bitcoin's macro structure. It is more agile than the weekly chart, but more reliable than the daily chart.
Historically, since 2014, there has been a specific signal marking the "absolute bottom" of each major cycle. That is the crossover interaction between the 50 simple moving average (SMA) and the 200 simple moving average (SMA).
Although this name sounds intimidating, history shows that this "crossover" is indeed a golden opportunity for long-term investors.
History of the "Last Drop"
Every time these two lines cross on the 3-day chart, it signals the last pullback before a new round of the bull market begins:
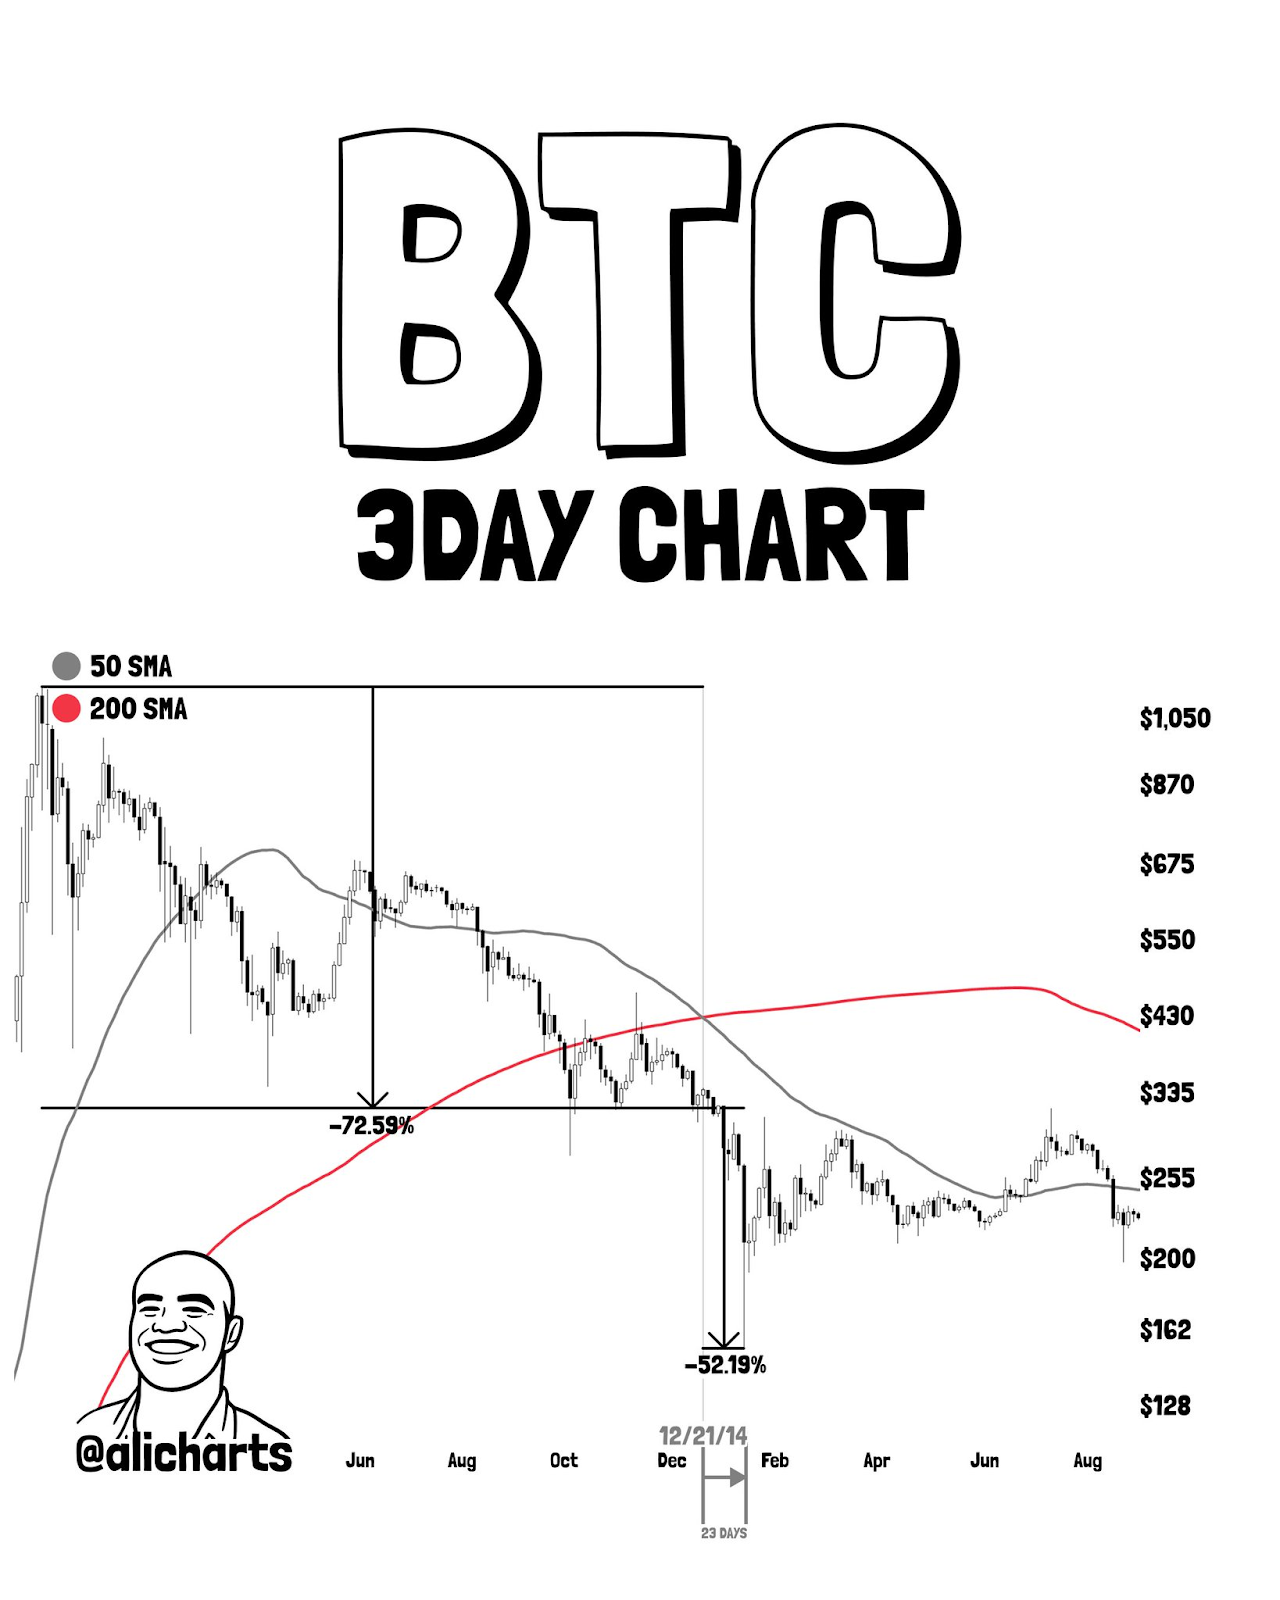
2014 Cycle: Before the crossover in December, Bitcoin had already dropped 72% from its historical high. Just 23 days later, the golden opportunity arrived, as Bitcoin experienced its final 52% drop, reaching the absolute bottom of the new bull market.
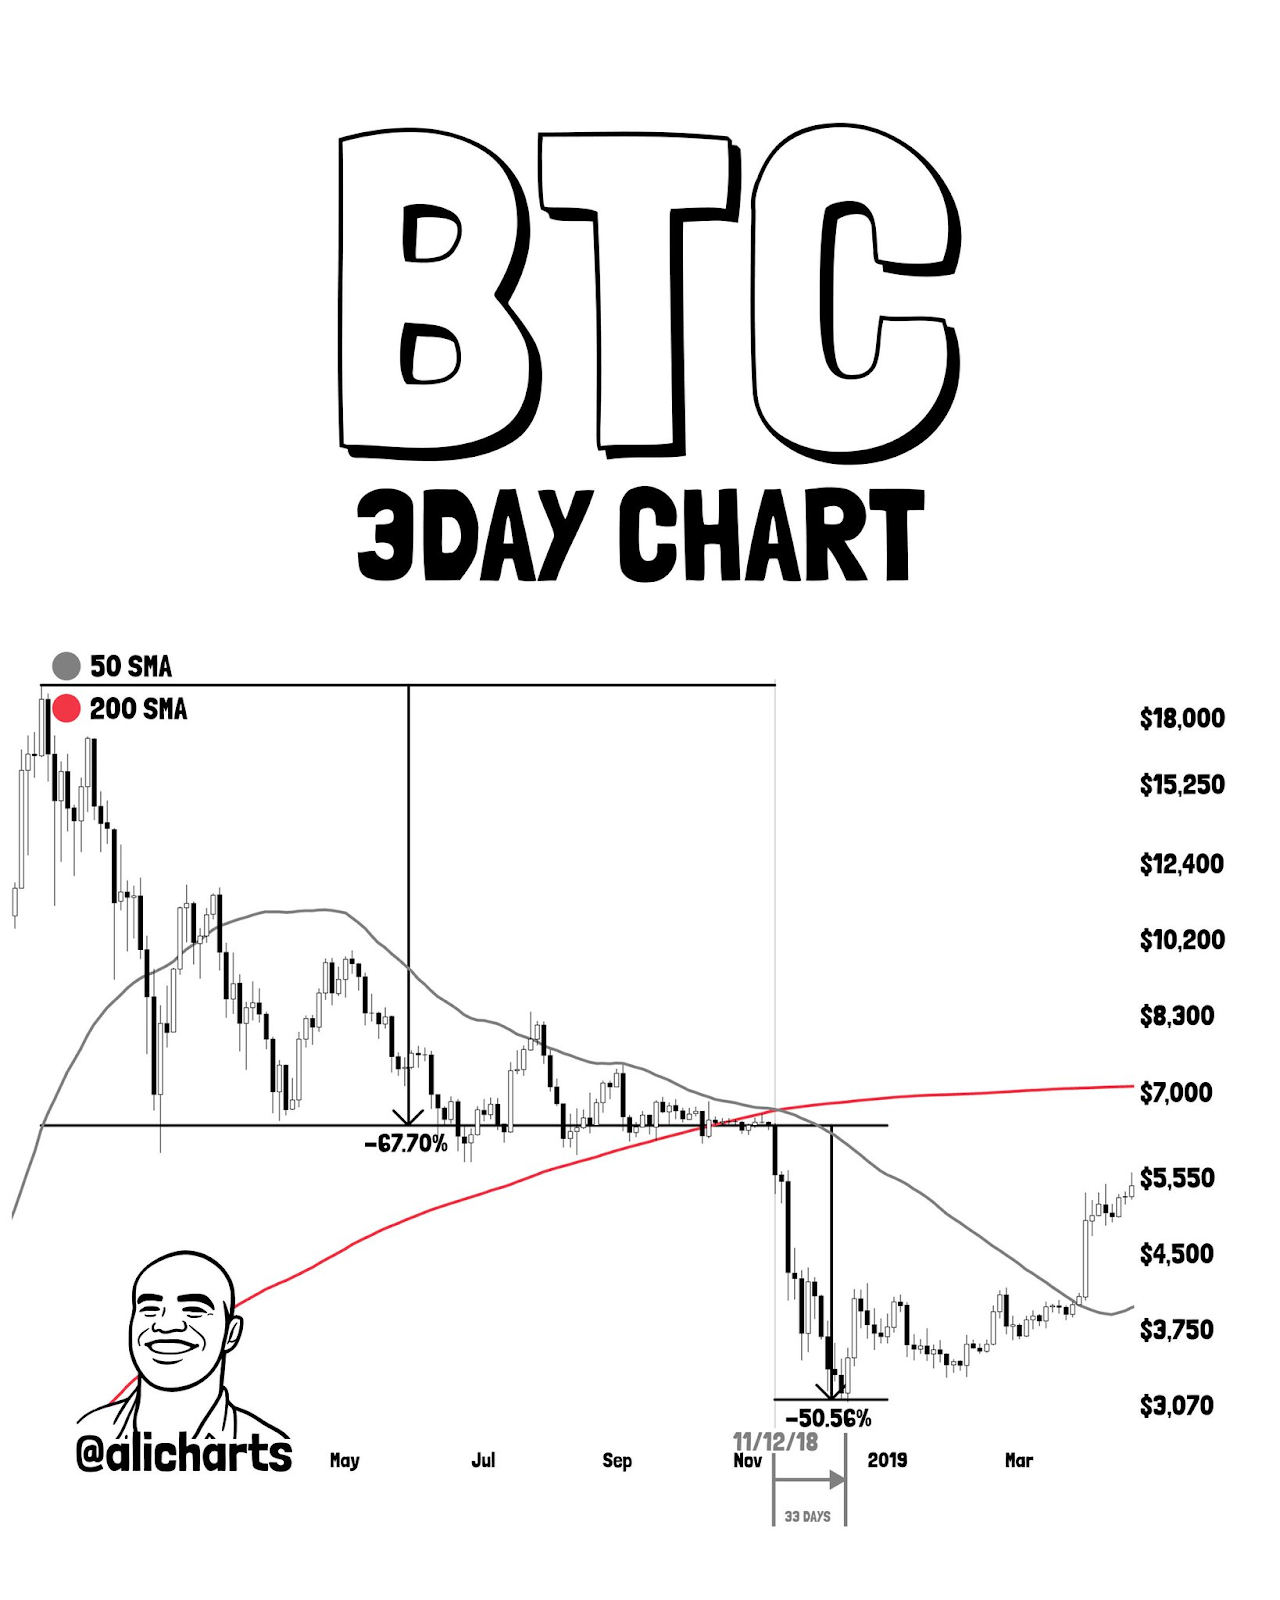
2018 Cycle: After dropping 67% from the top, the crossover occurred in November. Just 33 days later, we witnessed the last 50% capitulation sell-off, marking the golden opportunity for long-term investors.
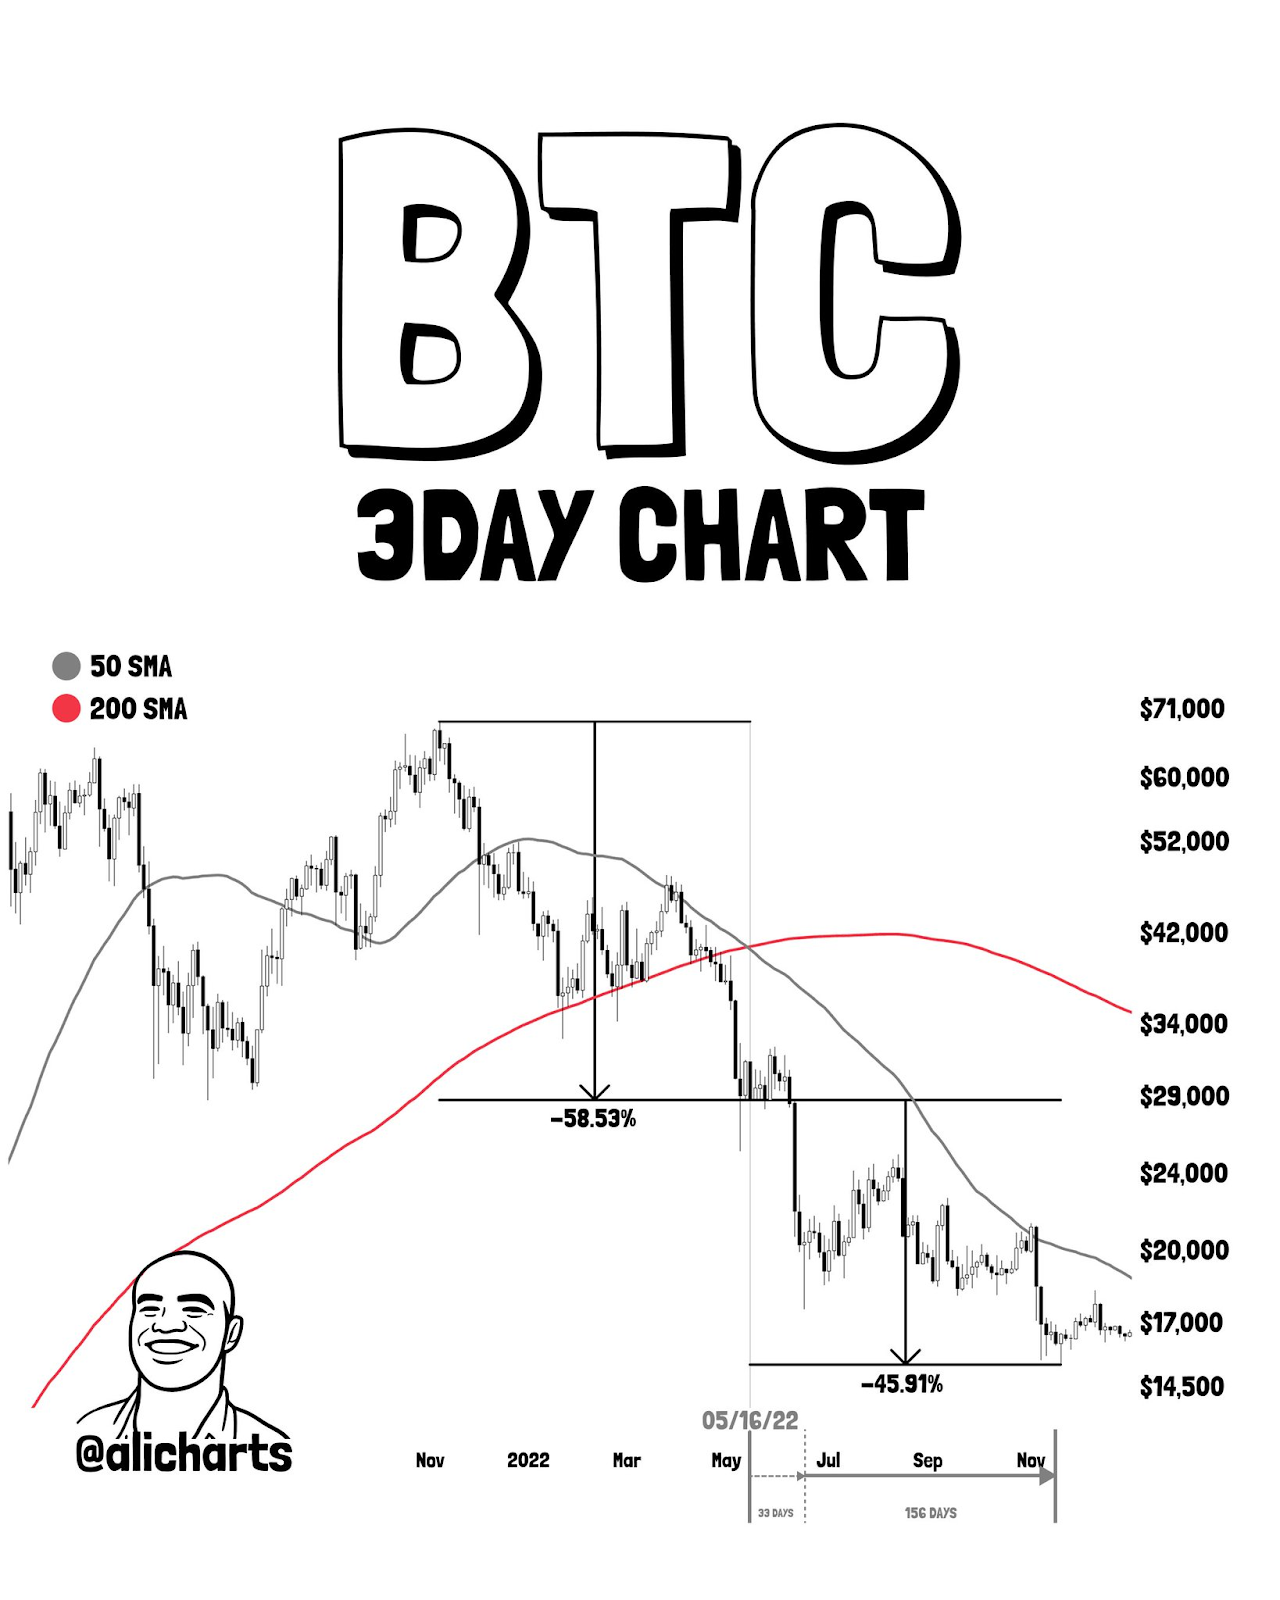
2022 Cycle: Before the crossover in May, the price had already dropped 50%. A full 33 days later, the market dropped another 45%, providing an excellent buying opportunity. However, after 156 days, another lower low was formed, completing the bear market structure and opening the door for the next round of the bull market.
Where are we now?
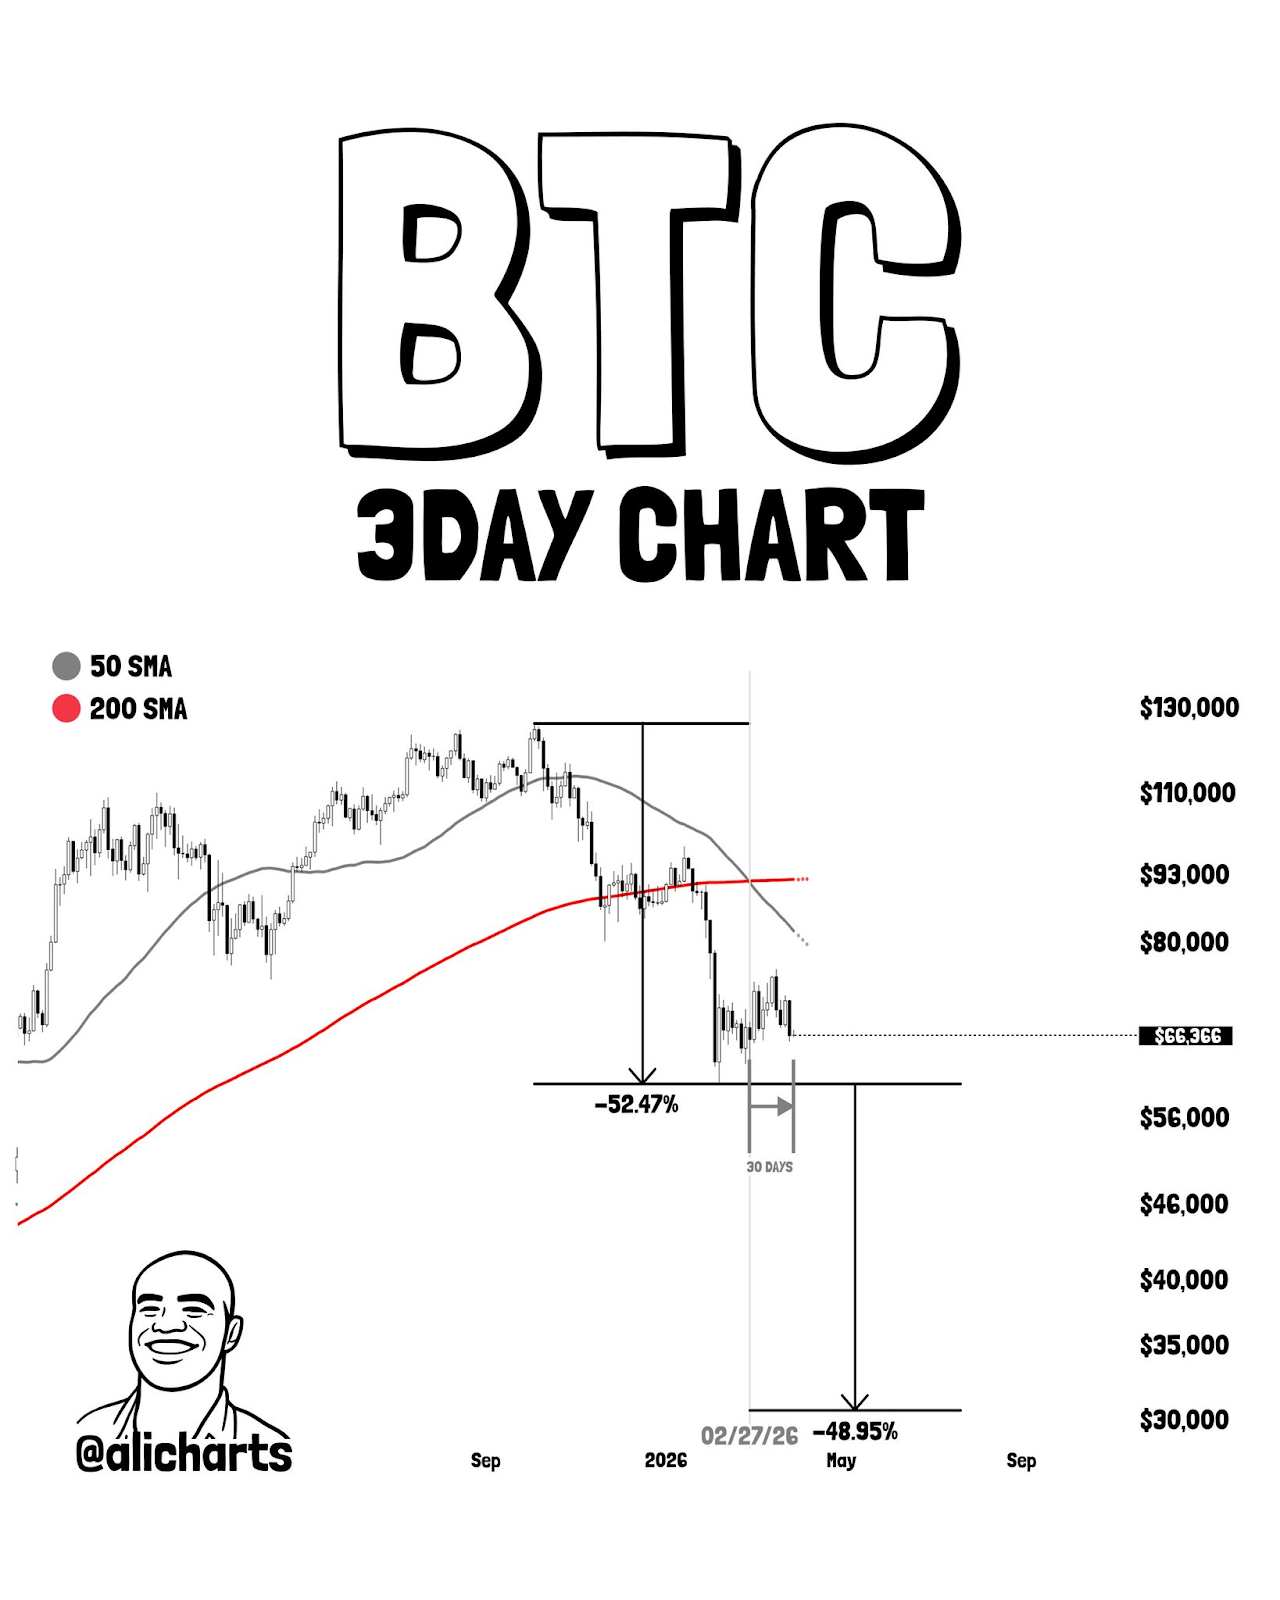
After the peak in October 2025, Bitcoin has experienced a 52% pullback. On February 27, 2026, we saw the 3-day SMA crossover again. As of today, we have been in this signal for a full 30 days.
If history "repeats," then in the next 3 to 6 days, we are very likely to enter the "final accumulation period" of this cycle.
Strategic Buying Zones
The final "consolidation phase" will be a great gift for those eager to build life-changing investments. Based on these historical resets of 40% to 50% that happen post-crossover, we are focusing on two main accumulation zones:
- Target 1: $40,000 (a standard 30% reset from current levels)
- Target 2: $30,000 (completely washing out 50% of speculative bubbles)
Structurally, this formation has historically coincided with the last major downtrend before the generational macro bottoms are formed.
This does not mean that a steep decline is guaranteed to happen next, but it reminds us: the "once-in-a-century fire sale" may be just around the corner.
If the price indeed drops to these levels, do not be afraid. This is precisely a clear signal: the conditions for the launch of the next super bull market have fully matured.
The countdown to the next linear skyrocketing has now begun.
免责声明:本文章仅代表作者个人观点,不代表本平台的立场和观点。本文章仅供信息分享,不构成对任何人的任何投资建议。用户与作者之间的任何争议,与本平台无关。如网页中刊载的文章或图片涉及侵权,请提供相关的权利证明和身份证明发送邮件到support@aicoin.com,本平台相关工作人员将会进行核查。


