By: Vadym
Compiled by: Luffy, Foresight News
It is an undeniable fact that on-chain yields have generally declined, and discussions surrounding it have been pervasive. Lending rates are aligning with the Federal Reserve's rates, with "safe" deposit rates averaging around 3%, which is lower than U.S. Treasury bonds and the secured overnight financing rate (SOFR) among other products. Notably, at the time of writing, the yields for USDC and USDT on Aave are around 2%, Steakhouse and Gauntlet Prime offer about 3.2% returns (with yields on the Base chain being more competitive), and sUSDe has a yield of 3.5%.
Among the over $20 billion in treasury assets on Ethereum and L2 networks, 58% of stablecoin locked value (TVL) has an annualized yield of less than 3%, while 35% falls between 3% and 5%. This makes the 3.75%-4% yield offered by Sky's USDS savings product an attractive haven. However, the question arises: why can Sky offer rates above the market average while holding such a large TVL?
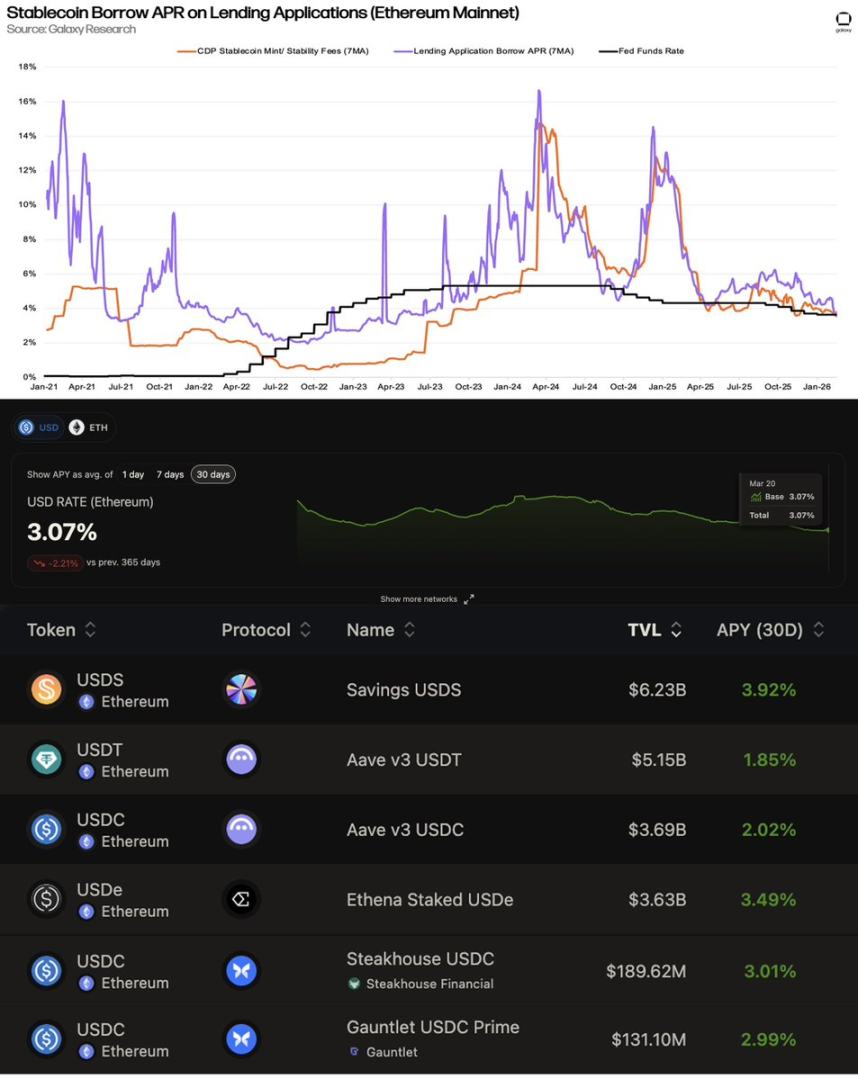
Data Source: Galaxy Research, https://app.vaults.fyi/
Of course, directly comparing Sky's savings rates with the lending rates of Aave or Morpho is not entirely accurate. The latter's yields are entirely derived from borrowing demand and capital utilization rates, whereas Sky's yield mechanism differs:
- Interest rates are set by governance (stability fee/stability savings rate SSR);
- Sky accepts any collateral it recognizes for lending operations, including off-chain asset initiated financing (however, this model also has a double-edged sword, as lending rate flexibility is lower and costs are higher within its ecosystem).
Nevertheless, on the funding supply side, all projects remain in a competitive relationship. Sky's role is akin to that of a central bank, participating in the majority of yield sources by providing unsecured credit lines to different entities. Therefore, exploring the essence of its yield sources, the yield contribution of on-chain versus real-world assets, and the correlation and scalability of various yields, is extremely valuable.
As Sky co-founder Rune has stated: "Currently, stablecoins valued at over $300 billion are not generating any yield"…… but just how much of this enormous potential demand can be absorbed?
On-Chain Yield Overview
Before diving into an analysis of Sky's balance sheet and financial condition, let's briefly outline how on-chain yields are generated and the overall yield scale for 2025.
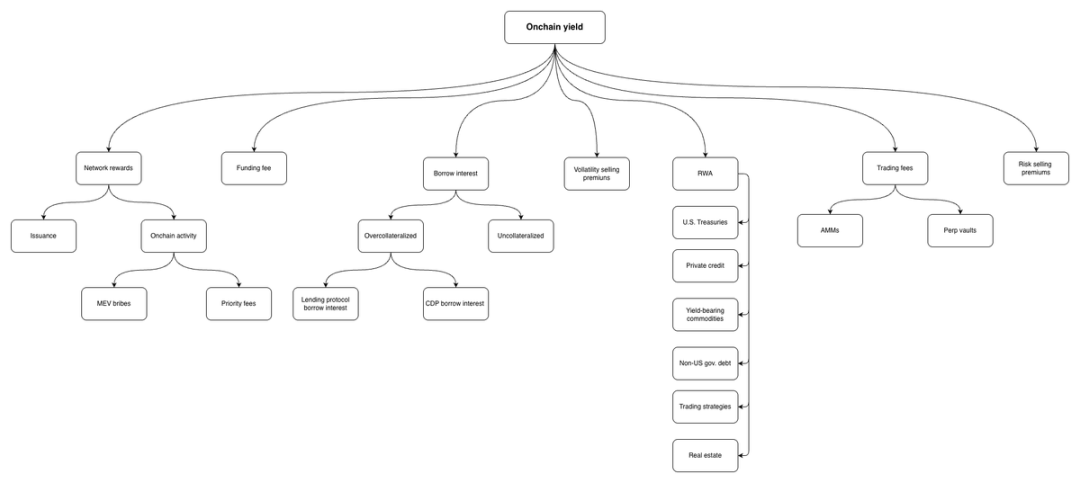
Simplified sources of on-chain yield
Lending Interest
Similar to traditional finance, the money market is also central to DeFi, accounting for over 60% of DeFi's total TVL. In 2025, total revenue from lending interest (including collateralized and uncollateralized/low collateral lending) is approximately $1.76 billion. So what is the core motivation for users to borrow? There are three main lending models currently: unified liquidity pools like Aave v3, isolated pools with risk managers like Morpho, and the central bank model of Sky and its associated ecosystem. We will break them down one by one.
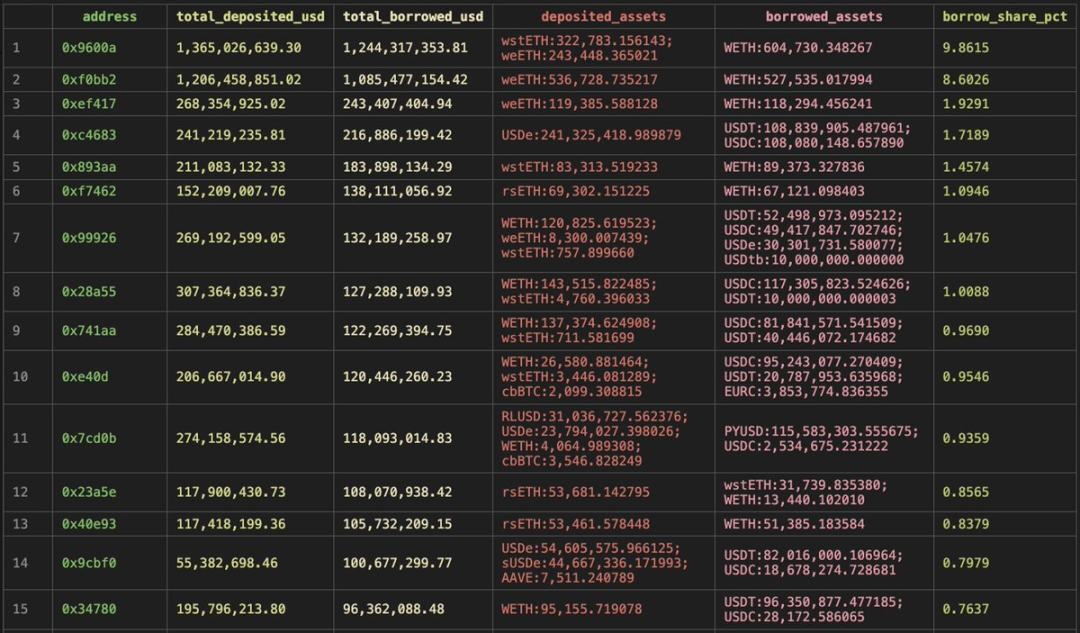
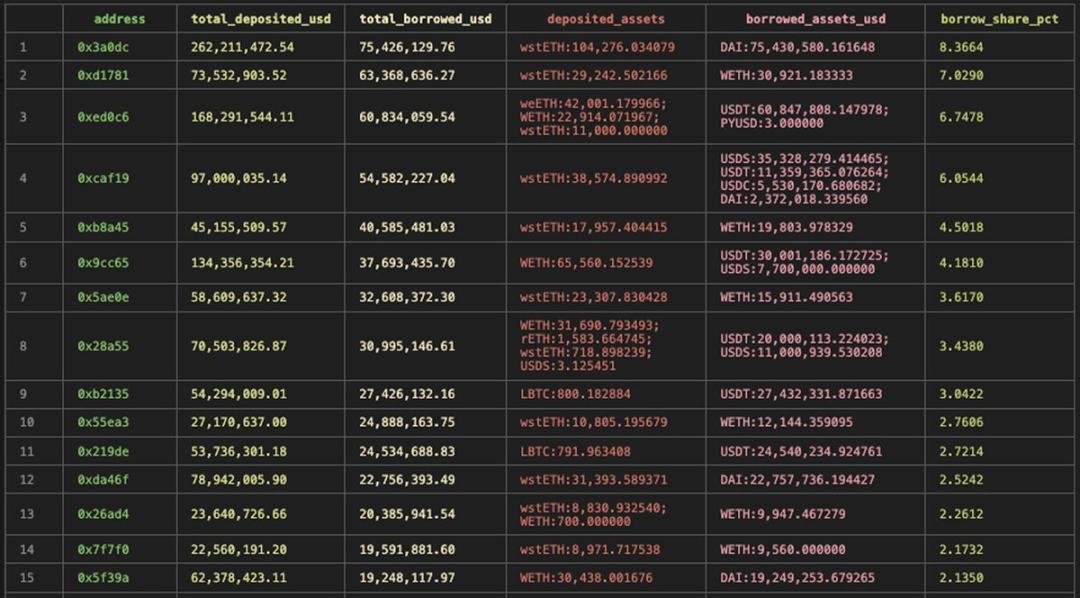
Top 15 borrowers on Ethereum Aave v3
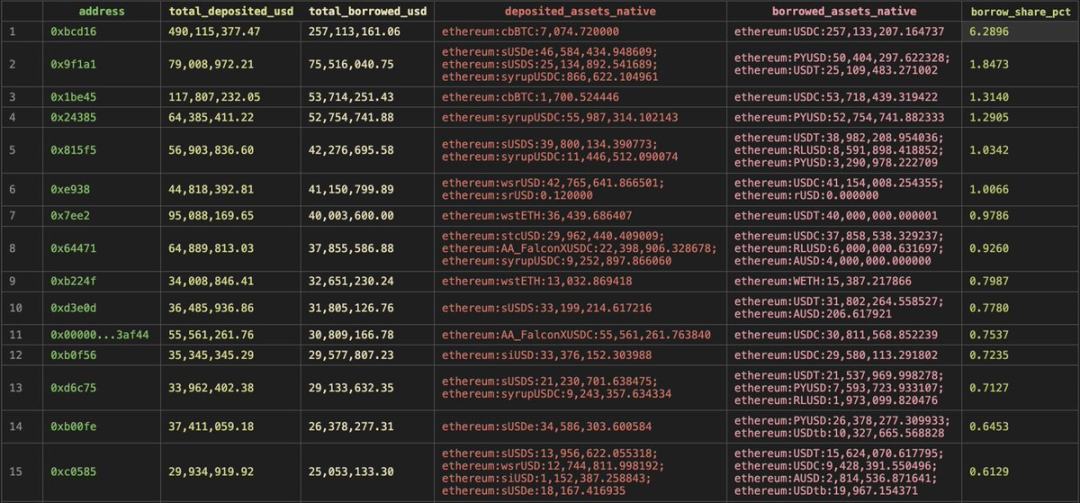
Top 15 borrowers on Morpho
The core scenarios driving borrowing demand can be divided into three categories:
- Cyclical borrowing. By borrowing related assets and operating them in cycles, users maximize the yield of interest-generating assets. Currently, in Ethereum Aave v3, about 39% of borrowing demand is used to amplify ETH staking rewards, with Fluid, Etherfi, and Lido as major participants; the demand for sUSDe cyclical borrowing is about 11.6%. On Morpho, at least 27% of borrowing is directly used for protocol USD cyclical strategies to earn yields on assets like sUSDS, syrupUSDC, and sUSDe; about 5% is used for ETH-related strategies.
- Spread trading and leverage. About 45% of Aave borrowing demand falls into this category: users use non-stable assets like BTC and ETH as collateral to borrow stablecoins, then invest those funds in other channels to earn spreads and improve capital efficiency. For example, the largest borrower on Morpho (accounting for 6.5%) borrows USDC and deposits it into Sky's savings products. Another major scenario is leveraging on spot trades (top borrowers on Aave such as 0x54d25, xed0c6, 0x28a55, 0x741aa all adopt this strategy), or borrowing stablecoins for other uses while maintaining exposure to collateral. Currently, on Morpho, approximately 40% of interest income comes from loans collateralized by cbBTC (excluding the largest borrowers), with a significant portion of funds coming from Coinbase users.
- Other minor demands. This includes borrowing non-stable assets against stablecoins to short sell, or investment strategies based on other trading pairs.
It can be seen that nearly half of borrowing activities are essentially leveraging other sources of yield. This raises two core questions: where do these interests actually come from? After exhausting existing strategies, what alternative solutions are available?
Public Chain Network Staking Rewards
Staking yields from native assets of public chains can be divided into two categories: network inflation rewards and MEV gains (priority fees + bribes).
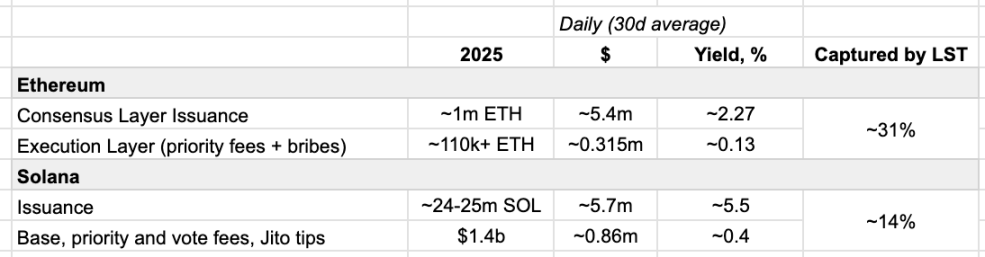
Data Source: Dune, Helius, Blockworks
Staking rewards on Ethereum primarily come from network inflation, with a maximum daily inflation amount of about 2,700 ETH, totaling about 1 million ETH in 2025; Solana has an annual inflation amount of about 24 to 25 million SOL. The advantage of such rewards lies in their stability, although the principal price is subject to significant fluctuations.
5%-20% of staking rewards (5%-30% on Solana) come from on-chain activities (priority fees and MEV), and this proportion has been continuously declining since Ethereum's merge. The reason being: MEV gains are roughly half from arbitrage and half from front-running; the latter has significantly decreased due to the popularization of anti-MEV tools like OFA and solvers (currently about 90% of transactions are privately routed); the former was once monopolized by non-neutral searchers and block builders but is now highly reliant on market conditions and fiercely competitive.
Funding Rates
Ethena has innovated the on-chain perpetual contract funding fee revenue model, achieving approximately $240 million in fee revenue by 2025 (with 90% derived from funding fees), while total revenue is around $300 million. The unique value of these earnings lies in:
- Introducing a new revenue source for DeFi in a tokenized and composable manner;
- Earnings are easy to capture;
- Providing sustainability, even with significant market-related fluctuations (16% yield in 2021, 0.6% in 2022, about 9% in 2023, and about 13% in 2024).
This makes it an ideal underlying asset for fixed rates, interest rate swaps, and other derivatives, with relevant products already emerging on Pendle.
Although its scalability still needs to be verified, the open interest in BTC perpetual contracts expected in 2025 is between $35 billion and $65 billion, and ETH perpetual contracts are about $20 billion to $40 billion. By early 2026, total open interest in perpetual contracts across the market is about $75 billion, with Ethena currently holding around 1.8% market share.
Transaction Fees
Various token exchanges have always been one of the core activities on the blockchain, providing infrastructure for traders and extracting fees, making it a stable profit path. In 2025, transaction fee revenue for automated market maker (AMM) liquidity providers is about $4.2 billion, of which 62% comes from Uniswap, Meteora, and Raydium.
However, capturing this type of revenue through structured products is not easy:
- Liquidity providers (LPs) often face losses: funding pools are susceptible to malicious order flow shocks, and concentrated liquidity providers are particularly prone to losses, typically involving only professional players; the market acceptance of Uniswap LP management products is also not high.
- Limited composability: there are few scenarios where LP positions can be used as collateral.
- Revenue is concentrated in a few assets: a large portion of transaction fees comes from niche assets, making it difficult to fit typical yielding products. In 2025, about 25% of Ethereum's transaction volume comes from ETH-stablecoin trading pairs (currently about 60%), while 41% comes from USD trading pairs; on Solana, 50% of transaction volume derives from SOL-USD trading pairs, with meme coins accounting for 30%, and stablecoin trading pairs only making up 5% (currently approximately 62:12:17).
- The competition between AMMs and PMMs continues: the scalability of AMMs is still contentious. Although most front-end trading volumes are routed via solver networks, only about 11% complete through professional market makers (PMMs), with the remainder still AMMs. In 2025, Solana's dedicated AMM market share is 30%, which has now risen to 60%, dominating SOL-USD trading pairs, achieving a peak market share of 86%.
Nonetheless, there are still some strategic trading vaults on Gauntlet, and the main research object of this article, Sky, also holds some AMM liquidity provider positions.
With the popularity of DeFi perpetual contracts, its market making vaults (HLP, LLP, etc.) can be seen as alternatives to Uniswap LP management products. The scale of LP revenues is moderate (around $130 million), while JLP contributes an additional approximately $670 million. Risk managers are closely monitoring this field, with risk characteristics summarized as: "HLP, LLP, Giga vaults, OLP and other products have a maximum drawdown of 5%-9%, with consecutive months of floating losses; daily yields align with market making characteristics, mostly yielding marginal profits, some being flat, occasionally encountering significant losses; after risk-adjusted performance, yields show excellent performance, but the distribution is uneven and path-dependent."
Risk Transfer Revenue
There are three main approaches to managing risk: retention, mitigation, and transfer. Currently, most participants primarily choose to retain risks and use advanced risk mitigation tools. However, channels for transferring volatility or protocol risks (technical, economic, governance risks) are still very limited, with the related premium revenue being minimal, which might represent an undeveloped blue ocean.
Decentralized options are not a novel concept; there have been many attempts in the DeFi space, including option AMMs, perpetual options, option vaults (DOVs), etc., yet most products have not withstood the test of time. Some teams continue to build in this space, and more tokenizable volatility yield products are expected to emerge in the future.
From the perspective of market opportunity, competition between CeFi options and perpetual contracts is fierce. In 2025, CeFi options open interest is between $30 billion and $50 billion, while current on-chain options open interest is about $1.8 billion (primarily from Derive). Options premiums, just like funding fees, are sustainable, but capturing and packaging them is extremely challenging. Notably, as risk managers' asset allocation becomes more refined and competition intensifies, vaults may incorporate options into allocations to maintain their competitive edge.
Insurance underwriting premium income is still very small, with most coming from established projects like Nexus Mutual. In 2025, this platform generated over $5.5 million for insurance sellers, with risk exposure primarily concentrated in on-chain products like Fasanara, Infinifi, and Dialectic. In the current low-yield environment, on-chain risk pricing is incredibly complex, and the insurance sector remains in its early stages. As revenue sources diversify and protocol maturity improves, demand may see growth. Aave's Umbrella insurance, reserve funds extracted from fees, and other indirect mechanisms can alleviate the risk of insolvency for a single protocol, but they are difficult to fit into structured products.
Real World Assets (RWA)
This article aims to analyze on-chain yield sources, thus providing only a rough estimate of RWA for market reference. According to rwa.xyz data, the total value of RWA has grown from about $5.6 billion in 2025 to the current $27 billion, with U.S. Treasury bonds making up the largest share (around 41%), and private credit about 25%. By applying conventional yield rates to the average scale of various assets in 2025, and accounting for yield-generating major commodities and real estate, the estimated annual total yield from RWA is about $600 million to $900 million.
In summary, the total on-chain yield scale in 2025 is about $8 billion, but the distribution of yield sources is uneven, and some yields, even if obtainable, are challenging to capture stably (e.g., AMM fees, volatility yields), with limited opportunities for safe yields. However, as DeFi continues to innovate and crypto-native opportunities emerge, more mechanisms for capturing on-chain fees and yields are expected to appear in the future.
Back to Sky
Let us return to the main topic, analyzing Sky's performance in 2025 and its current layout to explore how it integrates various yield sources to form a coherent and stable strategy.
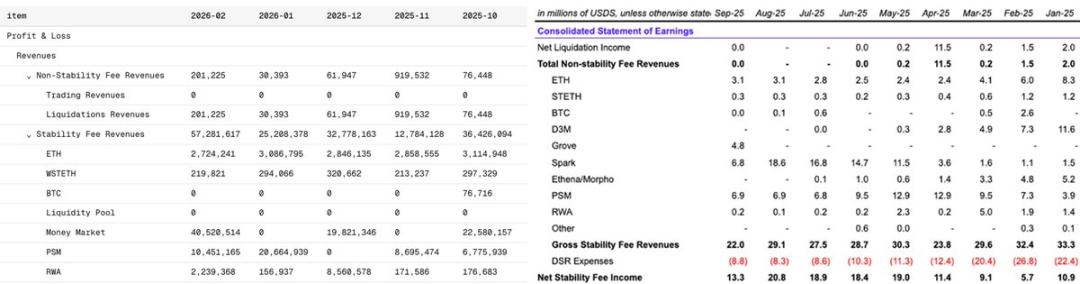
Sky 2025-2026 early financial report, Data source: Dune, Sky Forum
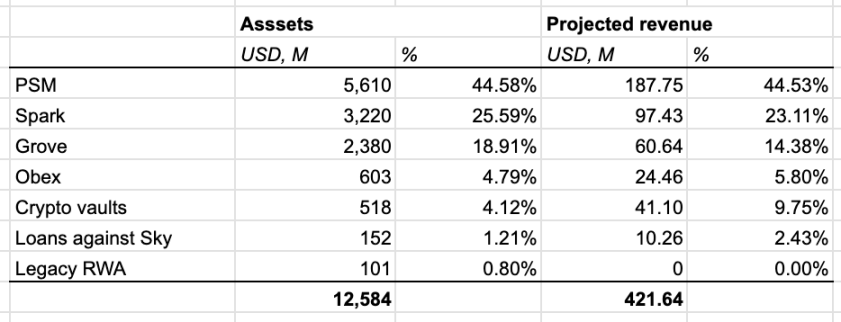
Simplified asset overview and expected revenue structure, Data source: Sky official
Currently, about 55% of Sky's revenue comes from its direct lending activities (PSM, crypto vaults, traditional RWA, SKY token collateralized lending), while the remaining 45% comes from unsecured credit lines issued to its associated ecosystem.
PSM (Peg Stability Module) remains the largest source of revenue, contributing about 44% of income. By 2025, approximately 27% of total income from PSM will come from USDC deposits at Coinbase.
Revenue from crypto vaults is moderate, primarily driven by ETH and WSETH collateral assets.
Excluding PSM, traditional RWA's direct exposure is continuously decreasing, primarily accruing revenue through newly launched ecosystem partner Grove Finance. Of its cumulative income, 47% comes from Janus Henderson JAAA (cash-like instruments and mortgage notes), 16.7% from Janus Henderson JTRSY (U.S. short-term treasury bonds), and 15.2% from BlackRock BUIDL-I (cash-like instruments).
Obex is a newly added credit line partner, with approximately $600 million currently allocated to syrupUSD, and plans to become a core configuration platform for structured income products in the future.
Revenue and asset proportions from Spark have been steadily growing since April 2025, surpassing the d3m credit model to become a core allocation channel, contributing 20%-65% of revenue. Spark serves both as an asset manager and a risk manager:
- Operating its own lending protocol Sparklend (a forked version of Aave v3);
- Within the risk framework, flexibly allocating yield opportunities above borrowing costs (SSR + 0.3%).
So, where does the revenue flowing into Spark actually come from?
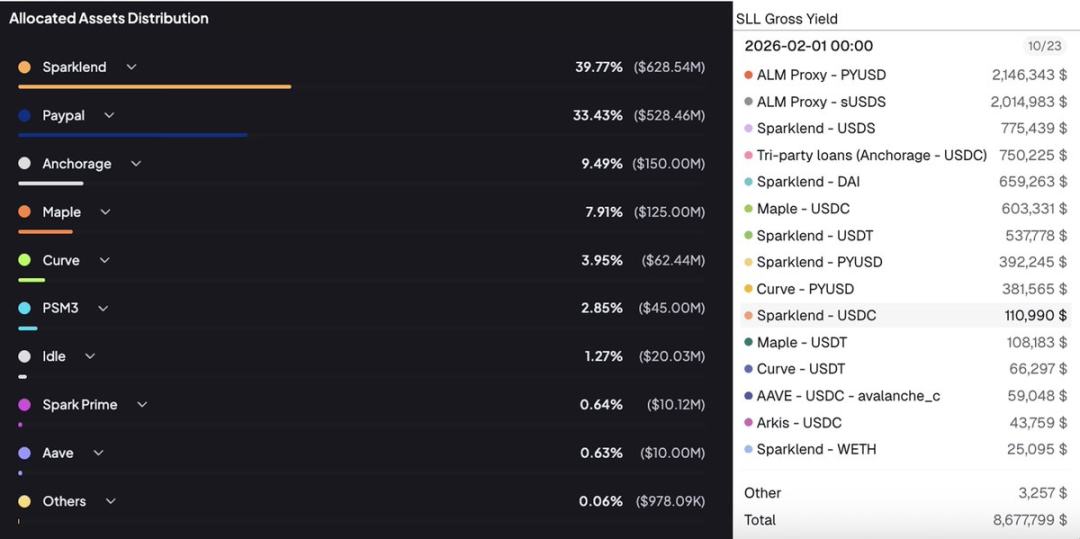
Data Source: Dune, Spark Official
Sparklend borrowing represents the largest asset of Spark's liquidity layer, contributing 37% of total gross revenue in February 2026 (excluding distribution rewards), consistent with levels from the third and fourth quarters (33.4%, 37.8%). Why do users borrow from Sparklend?
Top 15 borrowers on Sparklend
With only WSETH as an income-generating token usable as collateral, the primary use case involves classic cyclical strategies, accounting for approximately 50% of total borrowing, and serves as the main source of reserve income, with major participants including Ipor, Threehouse, Mellow, and Summerfi.
The remainder largely consists of stablecoin borrowing. Only the interest rate model for USDT is independent of SSR, set based on capital utilization rates, which may explain why it has become the second-largest lending asset (about 25%). Why are users willing to borrow other stablecoins at rates higher than the market average? The reason remains unclear. For instance, the leading borrowing address on Spark is related to 7 Siblings, accounting for at least 15% of total borrowings (holding several hundred idle ETH). Their recent operations include leveraging ETH and SKY, as well as participating in SKY staking; the reinvestment of funds and revenue sharing within the ecosystem, along with SPK mining, might be their primary motives. The second-largest borrower continues to buy SKY over time using a time-weighted average price (TWAP) and stake it.
More than half of the income comes from allocations to other revenue sources, with specific allocations dynamically adjusting based on current market yield conditions. For example, in the third and fourth quarters, substantial revenue came from Morpho, Maple, and Ethena; currently, daily income stems from Maple (10.6%), Anchorage (11.2%), and PayPal deposit yields (30%).
So, how does Maple generate income? About 28% of funds are lent to institutional borrowers at an annualized rate of 6%-9% (collateralized by blue-chip assets like BTC, XRP, SOL), with the remaining funds reallocated to yield-generating assets, a third of which flows back into the USDS savings product while the rest targets Aave, PYUSD, Superstate, and syrupUSD liquidity pools.
What about Anchorage? It provides BTC collateralized loans to institutions at rates below 6.5%.
What about Morpho and Ethena? Their yield logic has been detailed earlier.
Lastly, let’s summarize Sky's financial situation: total revenue of $338 million in 2025, with $194 million paid to savings users. The current savings pool of $6.7 billion USDS has a payout rate of 3.75%, resulting in daily distributions of about $688,000, with daily earnings of around $1.17 million. Based on the current projected income structure, the ratio of on-chain to off-chain sources in Spark’s earnings is approximately 50:50, while about 70% of Sky's total revenue comes from off-chain sources. What does this imply for the entire market?
Regardless of where the yields are generated, there have emerged sustainable yield sources on-chain, with lower dependence on market activity and leverage needs, exhibiting weaker correlations with traditional on-chain yield sources, thus providing a stable funding haven for individuals and protocols. For Sky, its diversified and flexible allocation strategy allows it to quickly adjust when on-chain risk appetites rise. Additionally, as USDS becomes the largest real-time yield-generating stablecoin, the behaviors of leading borrowers indicate that Sky indirectly supports other protocols in maintaining yield levels.
Some argue that traditional finance is devouring DeFi, as many tokenized RWAs have access restrictions, making it difficult for ordinary users to participate. However, even if yields originate off-chain, they ultimately flow back onto-chain for distribution. This trend is crucial as it brings liquidity and diverse yields to DeFi, enabling permissionless protocols to benefit. Furthermore, this might drive the realization and scalability of next-generation yield derivatives like fixed rates, interest rate swaps, risk layering, and structured products. Is the true DeFi revival on the horizon?
免责声明:本文章仅代表作者个人观点,不代表本平台的立场和观点。本文章仅供信息分享,不构成对任何人的任何投资建议。用户与作者之间的任何争议,与本平台无关。如网页中刊载的文章或图片涉及侵权,请提供相关的权利证明和身份证明发送邮件到support@aicoin.com,本平台相关工作人员将会进行核查。


