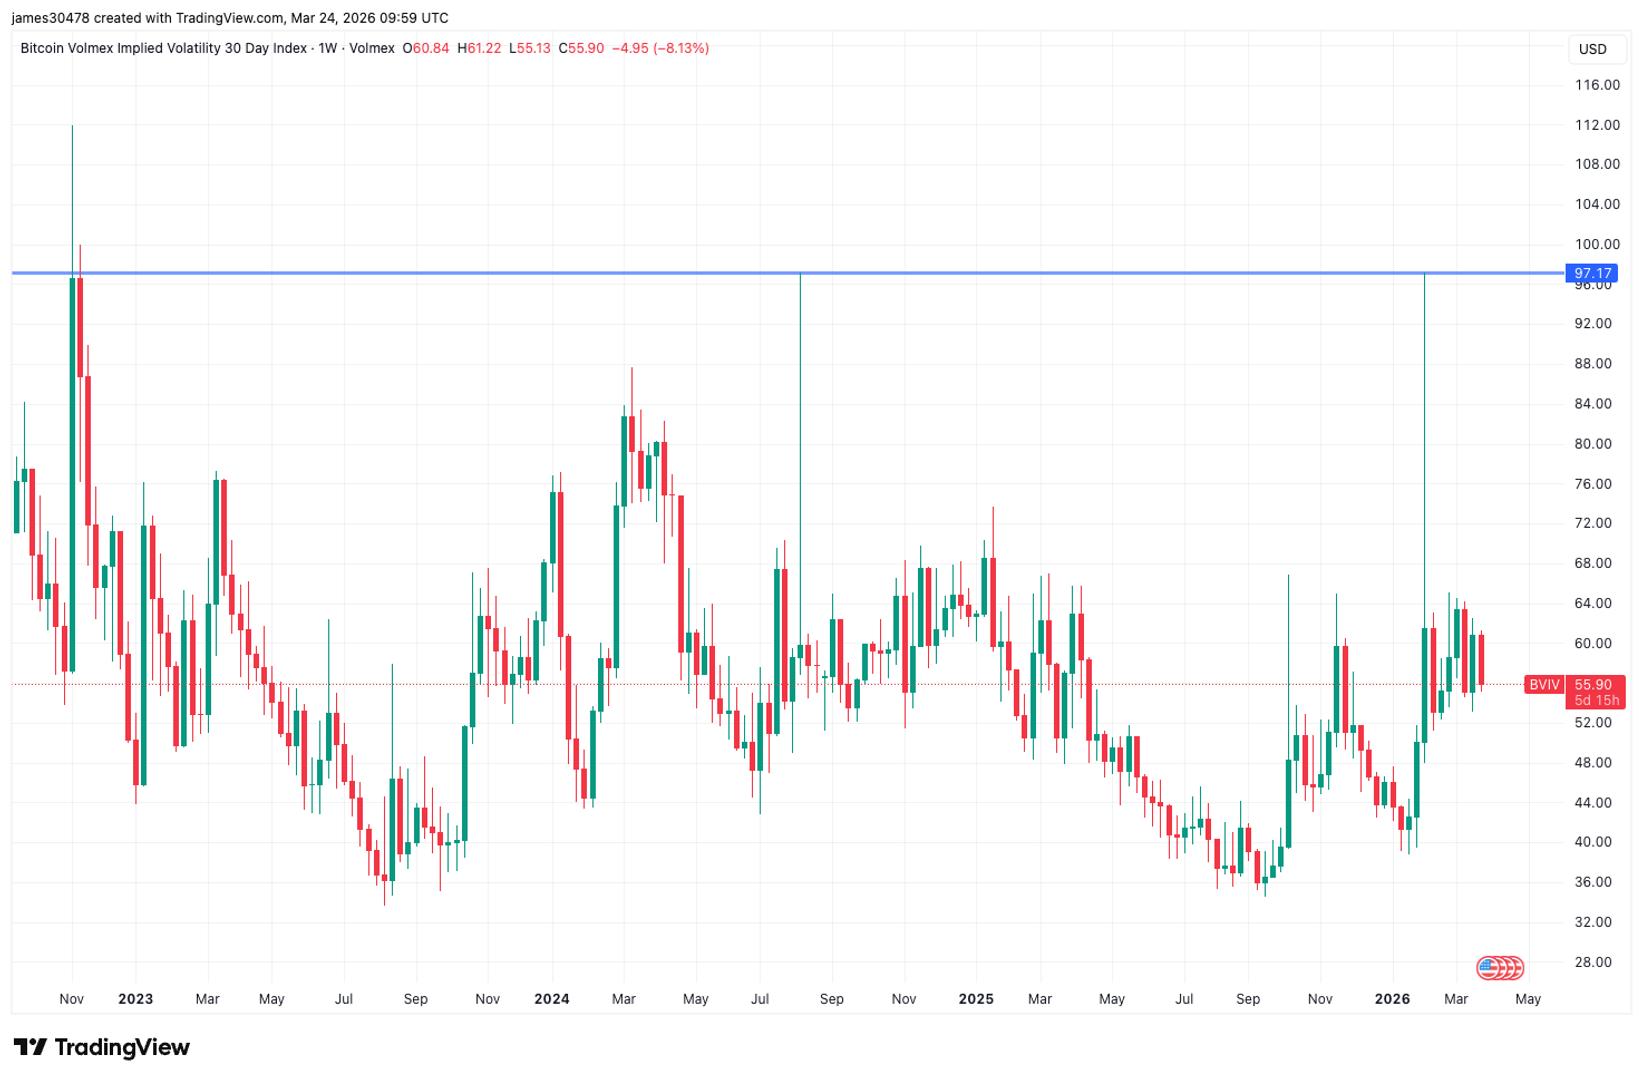
What to know : DVOL and BVIV reached levels consistent with previous cycle lows, reflecting elevated implied volatility and peak fear typically seen at market bottoms. Bitcoin volatility peaked in February, while the VIX only surged weeks later and remains below prior crisis highs, indicating traditional markets may still be adjusting.
Some worry bitcoin could still see a deeper sell-off, but one key indicator suggests the bottom may already be behind us.
That indicator is the 30-day implied volatility, which is an options-based measure of expected price turbulence over four weeks.
The widely-tracked 30-day implied volatility indices like Deribit's DVOL and Volmex's BVIV surged to 90% in early February when bitcoin crashed to almost $60,000. Historically, similar spikes in volatility have coincided with peak panic and capitulation, marking price bottoms.
VIX-like contrary signal
Bitcoin's market structure has increasingly mirrored Wall Street since the introduction of spot BTC ETFs in the U.S. in early 2024.
In this context, implied volatility has emerged as a “fear gauge” and a contrary indicator similar to the VIX, a real-time indicator measuring expected 30-day volatility of the S&P 500: It typically trends downward in stable markets but spikes sharply during moments of extreme fear that mark major market bottoms.
This dynamic was on evident early last month when bitcoin tanked. The resulting panic demand for options, mostly puts, drove DVOL and BVIV skyward to 90% and above in a manner consistent with prior capitulation events, such as August 2024, when prices tanked to and bottomed near $50,000.
The same thing in November 2022 when FTX collapsed, resulting in peak fear, sending implied volatility to 90%. At that time, bitcoin bottomed out below $20,000.
So, if history is a guide, the bitcoin downtrend that began in October at highs above $126,000 has already ended.
Some might argue that one indicator doesn’t prove much and that’s logical. But what makes it noteworthy is it's established role in traditional markets as a contrary indicator.
A super high VIX, well above its long-term average, is generally considered a strong contrarian buy signal for long-term investors, as it represents peak market fear and "panic".
In fact, many Wall Street strategies use the VIX as a "background indicator" to trigger systematic equity purchases. For instance, quantitative mean reversion funds use models where a ViX deviating higher significantly from its long-term average triggers an automated increase in equity leverage.
Speaking of the VIX, it reached a one-year high of 35% on March 9, nearly a month after the explosion in bitcoin volatility,. The VIX has been elevated throughout 2026 but has held below prior dislocation peaks above 60, seen during Liberation Day in April 2025.
免责声明:本文章仅代表作者个人观点,不代表本平台的立场和观点。本文章仅供信息分享,不构成对任何人的任何投资建议。用户与作者之间的任何争议,与本平台无关。如网页中刊载的文章或图片涉及侵权,请提供相关的权利证明和身份证明发送邮件到support@aicoin.com,本平台相关工作人员将会进行核查。


