Author: CryptoPunk
Many cryptocurrency traders have experienced the same kind of disappointment: it looks like stable profit in backtesting, but once in the real market, they find that returns quickly shrink, even turning from profit to loss. The problem often does not lie in "wrong direction," but in underestimated trading costs, particularly slippage.
In a cryptocurrency market with faster bull-bear switches, more severe volatility, and more fragmented order books, slippage is not an insignificant decimal point, but a real threshold that determines whether a strategy can survive. A deviation of 2 bps or 3 bps in a high-turnover strategy can eat up all of the theoretical alpha.
This article is based on long-term backtesting of BTC/USDT and ETH/USDT, attempting to answer a very practical question: to what extent does slippage erode strategy returns, and which strategies are most likely to fail due to slippage.
1. Introduction: Why Slippage Is Always Underestimated
Traders underestimate slippage for three main reasons.
First, many backtests by default use closing prices, opening prices, or even mid-prices for execution, which is inherently optimistic. Second, many people only account for transaction fees, ignoring slippage, and even less consider the bilateral slippage of opening and closing positions. Third, many people assume slippage is a fixed value, but actual market slippage varies with volatility, trading volume, order size, and liquidity conditions.
This is why many strategies look good in Excel or backtesting frameworks but distort once they hit the live market. Profits are not that substantial, but costs are much higher than expected.
2. Research Method: BTC/ETH Backtesting Design
This study keeps the strategy and slippage framework from the current project unchanged, only expanding the time range and result outputs.
- Assets: `BTCUSDT`, `ETHUSDT`
- Data: Binance Vision public spot `1m` Kline
- Sample Interval: `2020-01-01` to `2025-12-31`
- Running Date: `2026-03-15`
- Notes: At the actual check on `2026-03-15`, Binance Vision's public spot `1m` data returned `404` after `2026-01`, thus this article uses the latest available date `2025-12-31` as the sample endpoint.
- Execution Rules: Signals are generated at the close of the current bar, executed at the open of the next bar.
To make the results easier to replicate, the core execution parameters used in this article are as follows:
| Parameter | Setting |
|---|---|
| Initial Capital | `100,000 USDT` |
| Default Fee Rate | `0.05%` per side, approximately `5 bps` |
| Round-trip Fee | Approximately `10 bps`, excluding slippage |
| Order Mode | Place orders based on account equity proportion |
| Default Single Order Size | `15%` of account equity |
| Leverage | `1x` |
| Allow Two-way Transactions | Allowed |
The strategies are divided into three categories:
- Low-frequency: `20/50` moving average trend following, `1H`
- Medium-frequency: `RSI + MA` filter, `15min`
- High-frequency approximation: short cycle mean reversion, `5min`
The slippage models include:
- Fixed bps: `1 / 3 / 5 / 10 / 20 bps`
- Volatility-related slippage
- Volume impact slippage
- Asymmetric bilateral slippage
- Extreme market conditions penalty
The core conclusions of this article are mainly based on the reference scenario of "`extreme_volume_impact` + fees," as it is more akin to the situation of "amplified volatility + bilateral costs" in real trading.
3. Backtest Results: First, Look at the Most Important Groups
If you only look at gross profits, many strategies still have a story to tell; but once you include transaction fees and slippage, the story quickly ends.
The most typical example is the `BTC` high-frequency mean reversion:
- Excluding costs, the net profit is `84,534`
- After accounting for fees only, the net profit changes to `-99,168`
- Including slippage, the net profit further deteriorates to `-99,896`
- This strategy executed a total of `36,008` trades, with fees at `66,456`, and slippage costs at `46,966`
In other words, the problem is not even that "slippage is slightly high," but that the strategy's single trade advantage is simply not substantial enough; costs add up completely to wipe it out.
On the other hand, the `ETH` low-frequency trend strategy is among the few in this sample that can still retain positive returns after costs:
- Excluding costs, the net profit is `48,948`
- After accounting for fees, the net profit is `23,664`
- Including slippage, the net profit remains `13,463`
This indicates that slippage does not make all strategies worse; rather, it filters which strategies have substantial advantages and which just "look profitable in backtesting."
To visualize cost erosion more clearly, let’s first look at a core results summary table. The "fees + slippage" in the table below uses the reference scenario `extreme_volume_impact`.
| Asset | Strategy | Gross Profit Net | Net Profit Only Counting Fees | Net Profit Counting Fees + Slippage | Fee Cost | Slippage Cost | Number of Trades |
|---|---|---|---|---|---|---|---|
| BTC | Low-Frequency Trend | 10,557 | -8,617 | -14,898 | 19,009 | 7,118 | 1,268 |
| BTC | Medium-Frequency RSI+MA | 169 | 94 | 60 | 75 | 35 | 5 |
| BTC | High-Frequency Mean Reversion | 84,534 | -99,168 | -99,896 | 66,456 | 46,966 | 36,008 |
| ETH | Low-Frequency Trend | 48,948 | 23,664 | 13,463 | 22,322 | 10,238 | 1,238 |
| ETH | Medium-Frequency RSI+MA | 5 | -175 | -260 | 180 | 84 | 12 |
| ETH | High-Frequency Mean Reversion | -29,338 | -99,665 | -99,934 | 39,020 | 60,551 | 31,421 |
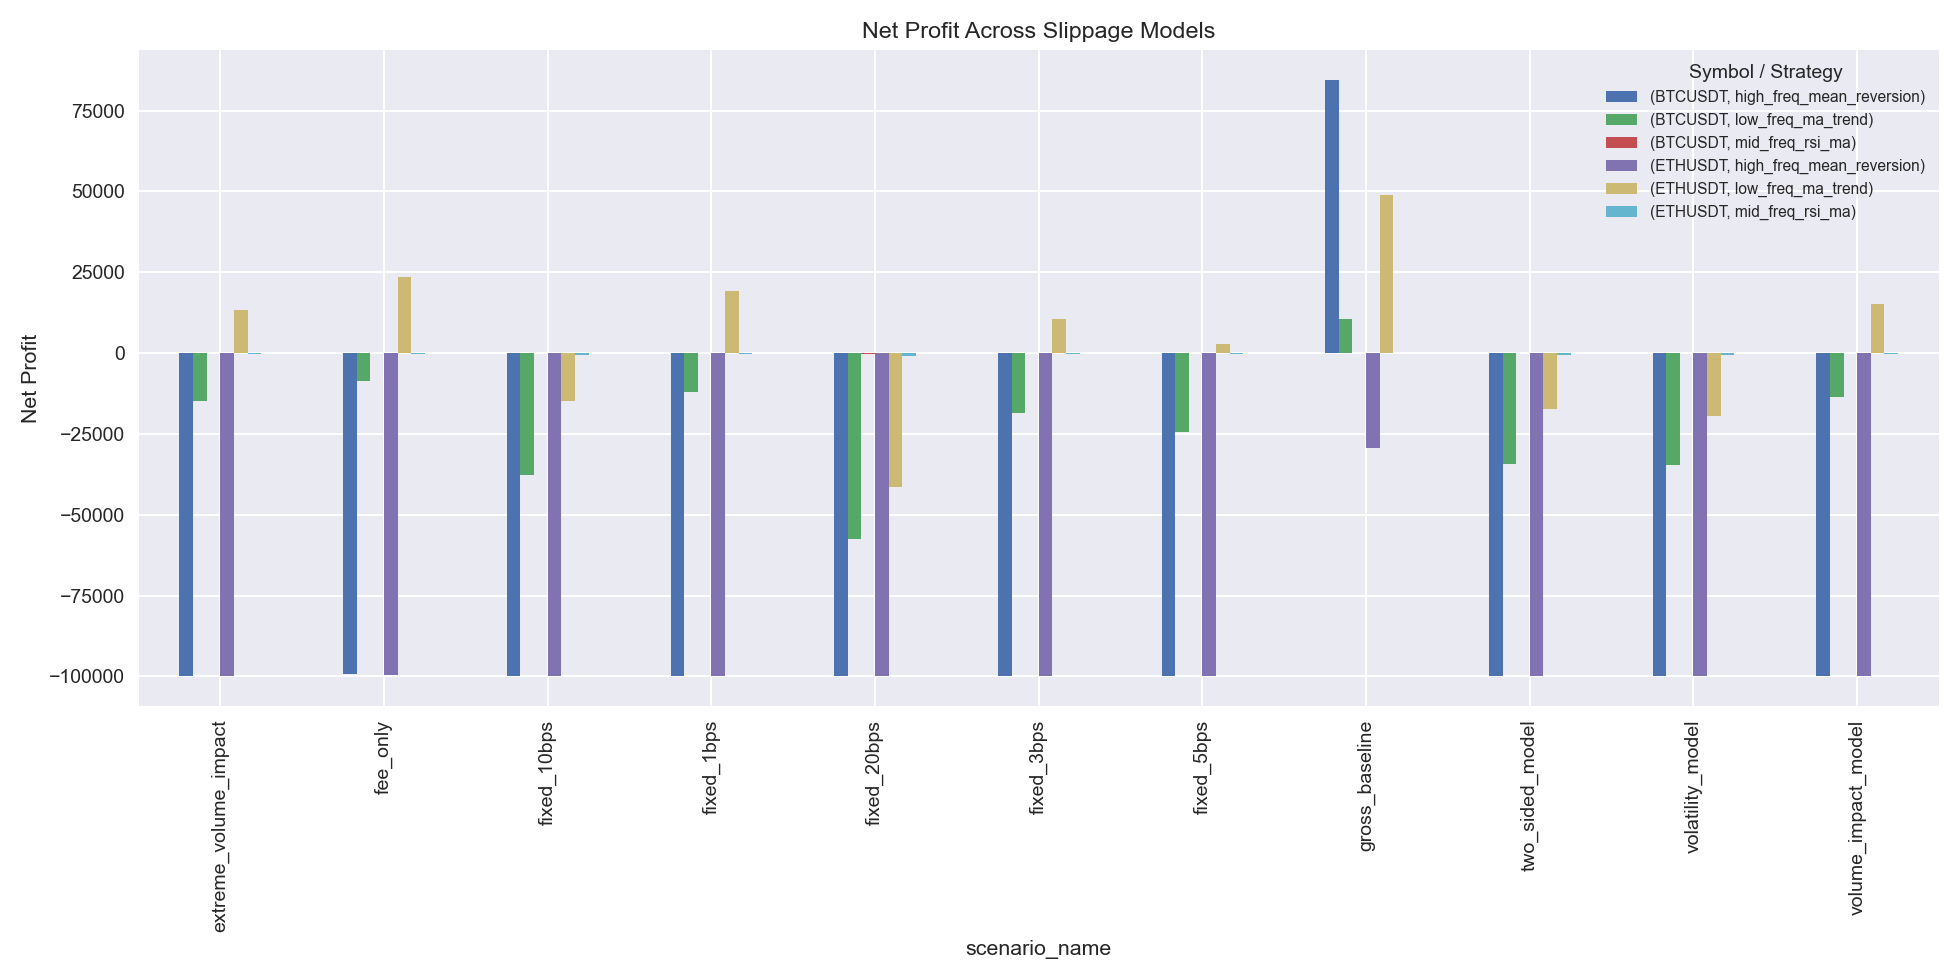
This image compares the net profit performance under different slippage models. Fixed bps is merely a starting point for cost pressure; when slippage begins to correlate with volatility, volume impact, and extreme market conditions, strategy returns will significantly decline. For high-frequency strategies, once the model upgrades from "fixed slippage" to "dynamic slippage," profits often do not just thin out but disappear completely.
From the comparison of returns across different slippage models, it can be seen that fixed bps is just the most conservative starting point; once slippage begins to correlate with volatility, volume impact, and extreme market conditions, many strategies that barely survive will soon fall below the breakeven line.
4. Erosion of Returns by Slippage
The most frightening aspect of slippage is not just "reducing returns a little," but that it often knocks a strategy directly from the profit zone into the loss zone.
In this experiment, `54` cases of "positive gross profit but negative net profit" were identified; just comparing this one dimension of models, there are `40` such combinations.
The most typical failure cases include:
- `BTC` low-frequency trend: gross profit `10,557`, turns to `-8,617` after counting fees, and becomes `-14,898` after adding slippage
- `ETH` medium-frequency RSI+MA: gross profit only `4.53`, becomes negative with fees added, and further loses money with slippage included
- `BTC` high-frequency mean reversion: looks obviously profitable on paper, but costs reduce it to nearly zero
This is also why "profitable in backtesting but losing in reality" is so common in the cryptocurrency market. The problem with many strategies is not that the directional logic is wrong, but that they are built on the assumption of "trading costs are almost nonexistent" from the very beginning.

The image above compares the net values of `BTC` high-frequency mean reversion strategies. The blue line represents the net value in backtesting excluding costs, while the green line shows the real net value after adding fees and slippage. The former appears as a curve that can compound continuously, while the latter is almost ground down near zero due to continuous friction.
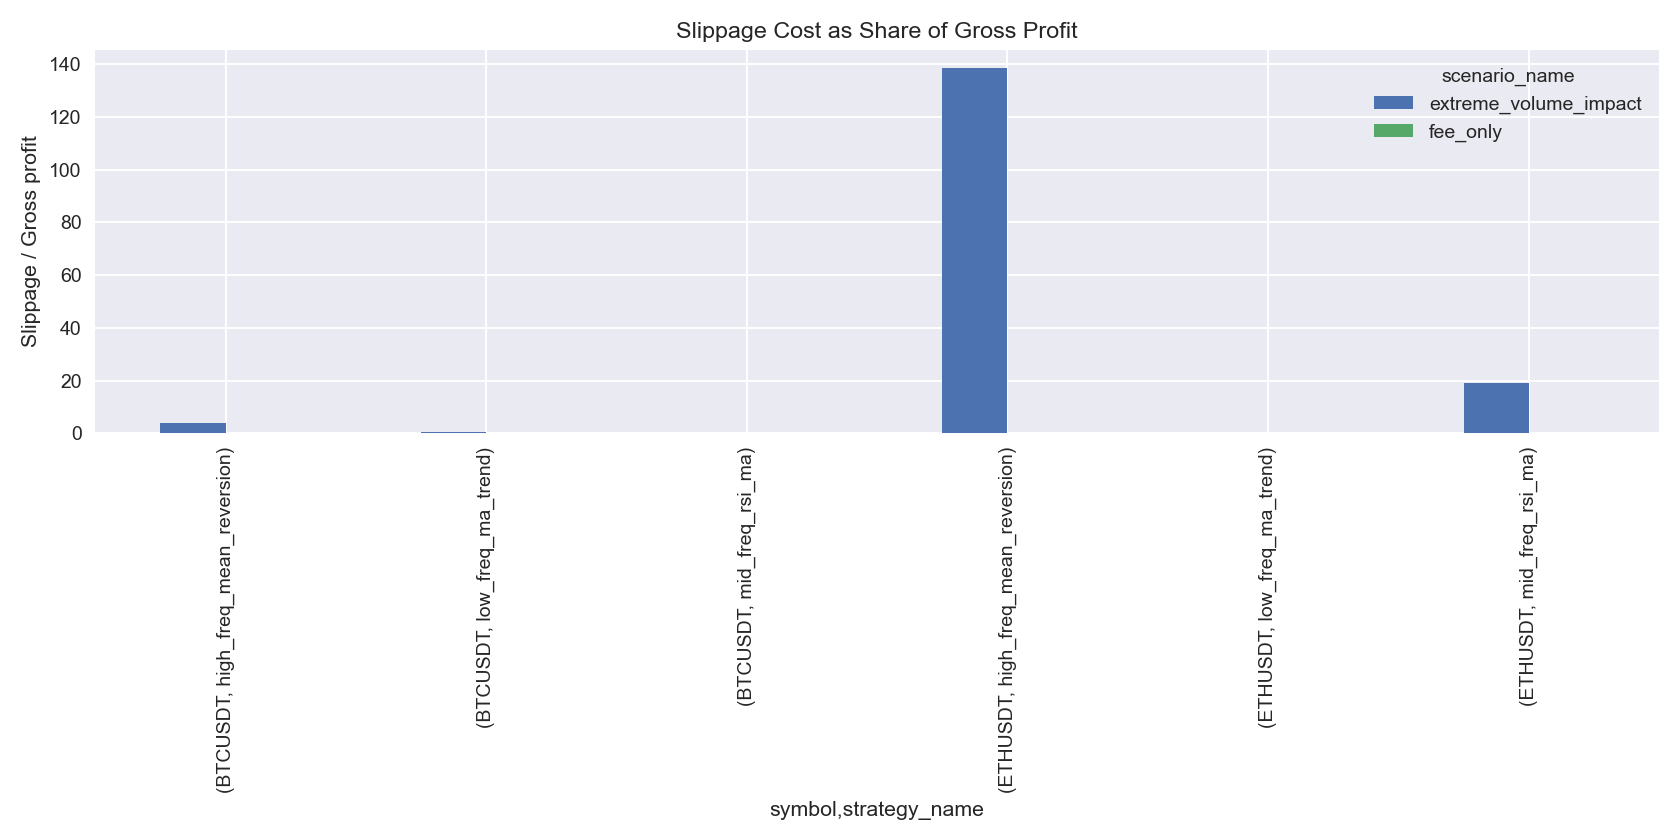
The cost structure also highlights the issues. Taking the reference slippage model as an example:
- In `BTC` high-frequency strategies, slippage costs are equivalent to `347%` of gross profits
- Transaction fee costs are equivalent to `491%` of gross profits
- In `BTC` low-frequency trends, slippage costs account for about `63%` of gross profits
- In `ETH` low-frequency trends, slippage costs account for about `22%` of gross profits
This means that low-frequency strategies are more about "profits being compressed," while high-frequency strategies are more about "profits being directly swallowed."
When viewing returns, Sharpe ratios, and maximum drawdowns together, the impact of costs on strategy portrayals will become more apparent:
| Asset | Strategy | Scenario | Net Profit | Sharpe | Maximum Drawdown |
|---|---|---|---|---|---|
| BTC | Low-Frequency Trend | No Costs | 10,557 | 0.23 | -13.99% |
| BTC | Low-Frequency Trend | Fees + Slippage | -14,898 | -0.25 | -24.32% |
| BTC | High-Frequency Mean Reversion | No Costs | 84,534 | 1.22 | -7.33% |
| BTC | High-Frequency Mean Reversion | Fees + Slippage | -99,896 | -13.10 | -99.90% |
| ETH | Low-Frequency Trend | No Costs | 48,948 | 0.62 | -22.08% |
| ETH | Low-Frequency Trend | Fees + Slippage | 13,463 | 0.24 | -25.22% |
| ETH | High-Frequency Mean Reversion | No Costs | -29,338 | -0.47 | -36.72% |
| ETH | High-Frequency Mean Reversion | Fees + Slippage | -99,934 | -11.35 | -99.93% |
5. Why High-Frequency Strategies Are Most Easily Killed by Slippage
High-frequency strategies are most easily killed by slippage not because they necessarily have poor directional judgment, but because their profit structure is too thin.
High-frequency strategies typically share three common characteristics:
- Thin single trade profit
- Extremely high number of trades
- Highly sensitive to transaction price
In this backtest, the average cumulative slippage costs under the reference slippage model for three types of strategies are as follows:
- High-frequency: `53,758`
- Low-frequency: `8,678`
- Medium-frequency: `59`
In other words, the main impact of slippage is highly concentrated in high-turnover strategies.
From the trading frequency dimension, the average profiles of the three types of strategies under the reference slippage model are as follows:
| Frequency | Average Net Profit | Average Cumulative Slippage Cost | Average Realized Slippage | Average Number of Trades |
|---|---|---|---|---|
| High-frequency | -99,915 | 53,758 | 5.65 bps | 33,714 |
| Low-frequency | -718 | 8,678 | 2.08 bps | 1,253 |
| Medium-frequency | -100 | 59 | 2.32 bps | 9 |
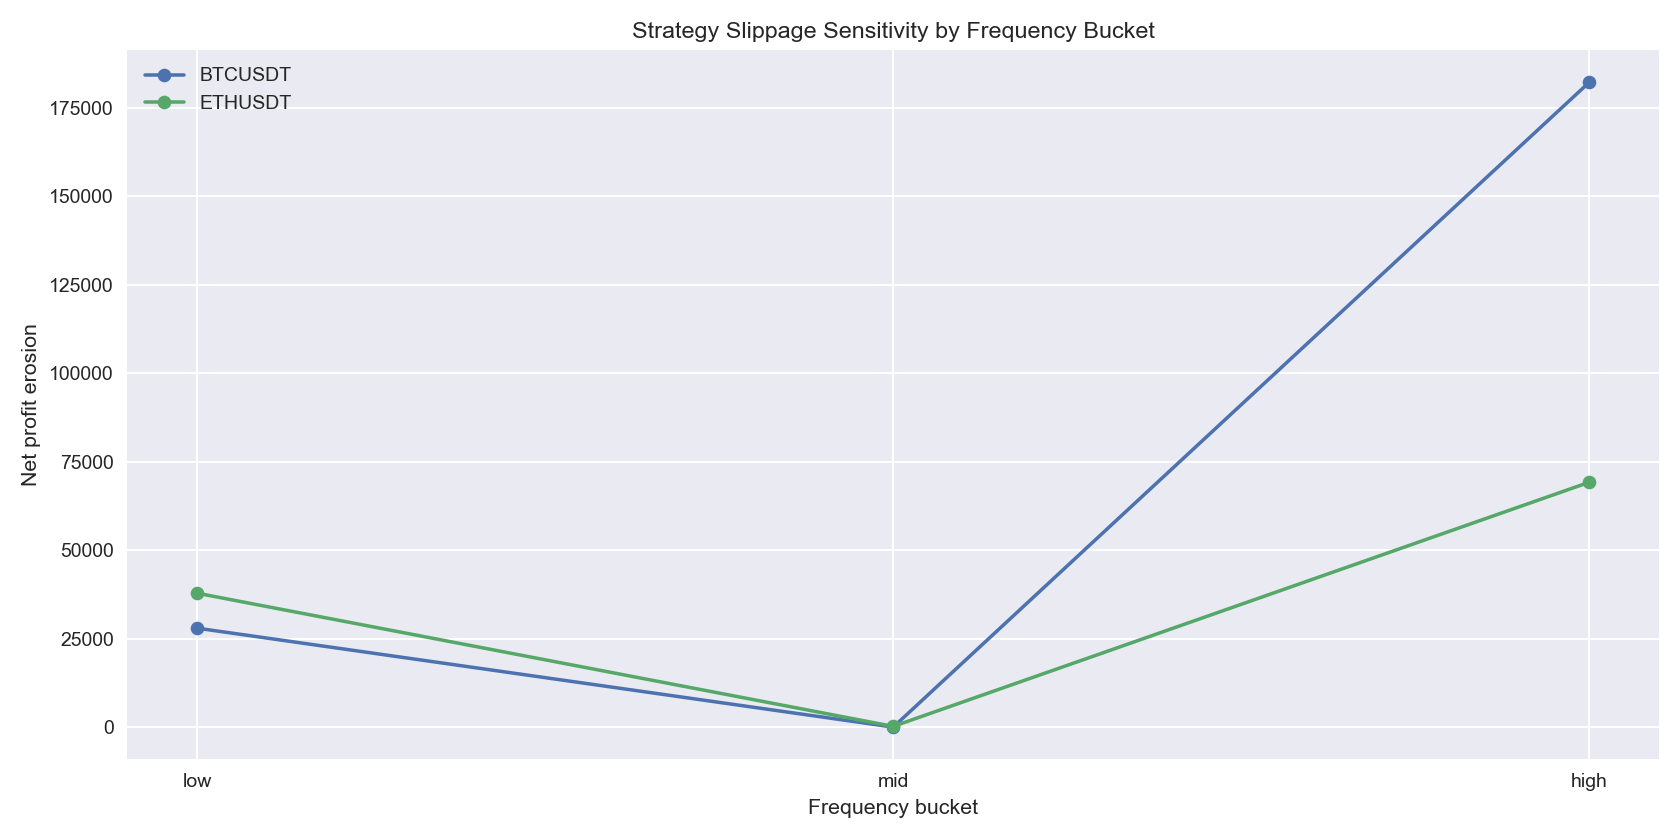
This image illustrates the "net profit erosion" of strategies with different frequencies. High-frequency strategies show a cliff-like jump compared to medium and low frequencies, indicating that in the cryptocurrency market, slippage's impact is highly concentrated in high-turnover strategies. Many high-frequency systems do not fail to make money, but simply do not make enough to overcome the ongoing friction from frequent trading.
More importantly, the relationship between slippage and trading frequency is not a simple linear one; it tends to exhibit "accelerated erosion" under high volatility and large orders.
Taking the high-frequency strategies under the reference model as an example, the average single trade slippage cost in high volatility states compared to low volatility states is magnified by:
- `BTC`: `2.33x`
- `ETH`: `3.99x`
As order sizes increase, this erosion becomes more pronounced:
- Average realized slippage of `BTC` high-frequency strategies increases from `2.24 bps` to `5.70 bps`
- Average realized slippage of `ETH` high-frequency strategies increases from `3.40 bps` to `16.34 bps`
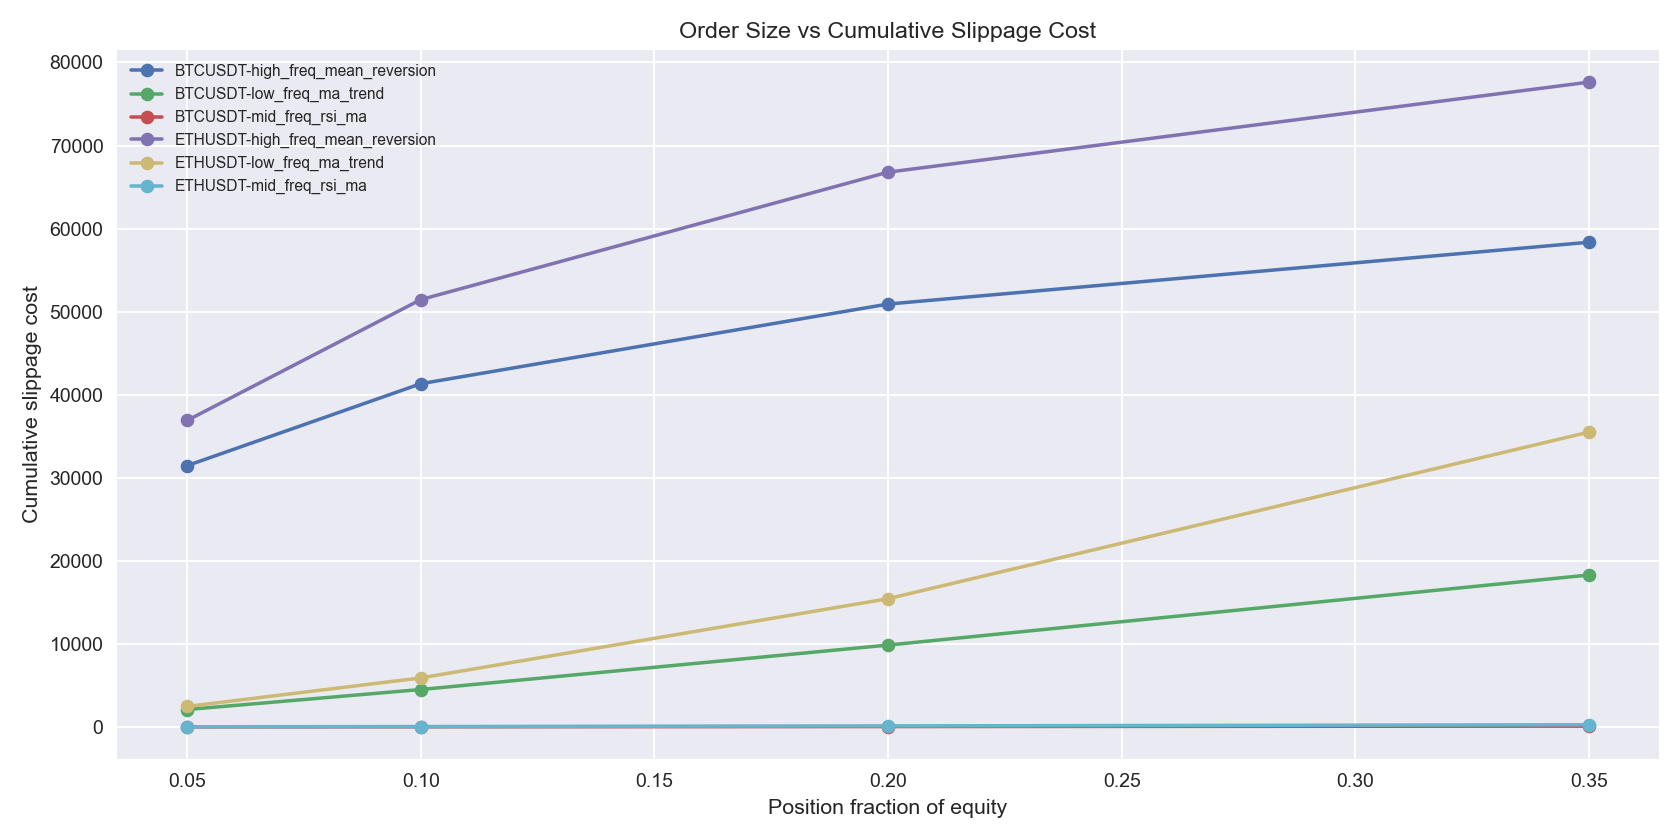
Illustration: This image shows the cumulative slippage losses under different order sizes. The curve is not a smooth line, but closer to a convex uplift. Especially for ETH high-frequency strategies, as the position increases from 5% to 35%, slippage worsens very quickly.
This image is very important. It illustrates a reality that many traders overlook during backtesting: position sizes do not merely expand linearly; slippage often expands in a convex manner. A strategy that works under small capital does not imply it will still be valid when scaled up.
6. Differences Between BTC and ETH
Many traders intuitively think that BTC is "more expensive," so slippage should be higher. But looking at the real backtesting results, the situation is more nuanced.
If we examine total slippage losses, under the reference slippage model:
- `BTC` average cumulative slippage cost: `18,039`
- `ETH` average cumulative slippage cost: `23,624`
If we look at realized slippage bps per unit transaction, the cost pressure for ETH is more apparent:
- `BTC` average realized slippage: `2.57 bps`
- `ETH` average realized slippage: `4.13 bps`
Breaking it down by strategy, ETH has higher slippage bps across each strategy type compared to BTC:
- High-frequency: `BTC 3.53 bps` vs `ETH 7.76 bps`
- Low-frequency: `BTC 1.87 bps` vs `ETH 2.29 bps`
- Medium-frequency: `BTC 2.31 bps` vs `ETH 2.34 bps`
Looking at BTC and ETH in the same table makes it easier to understand the differences:
| Dimension | BTC | ETH |
|---|---|---|
| Average Net Profit in Reference Scenario | -38,245 | -28,910 |
| Average Cumulative Slippage Cost | 18,039 | 23,624 |
| Average Realized Slippage | 2.57 bps | 4.13 bps |
| High-Frequency Realized Slippage | 3.53 bps | 7.76 bps |
| Low-Frequency Realized Slippage | 1.87 bps | 2.29 bps |
| Medium-Frequency Realized Slippage | 2.31 bps | 2.34 bps |
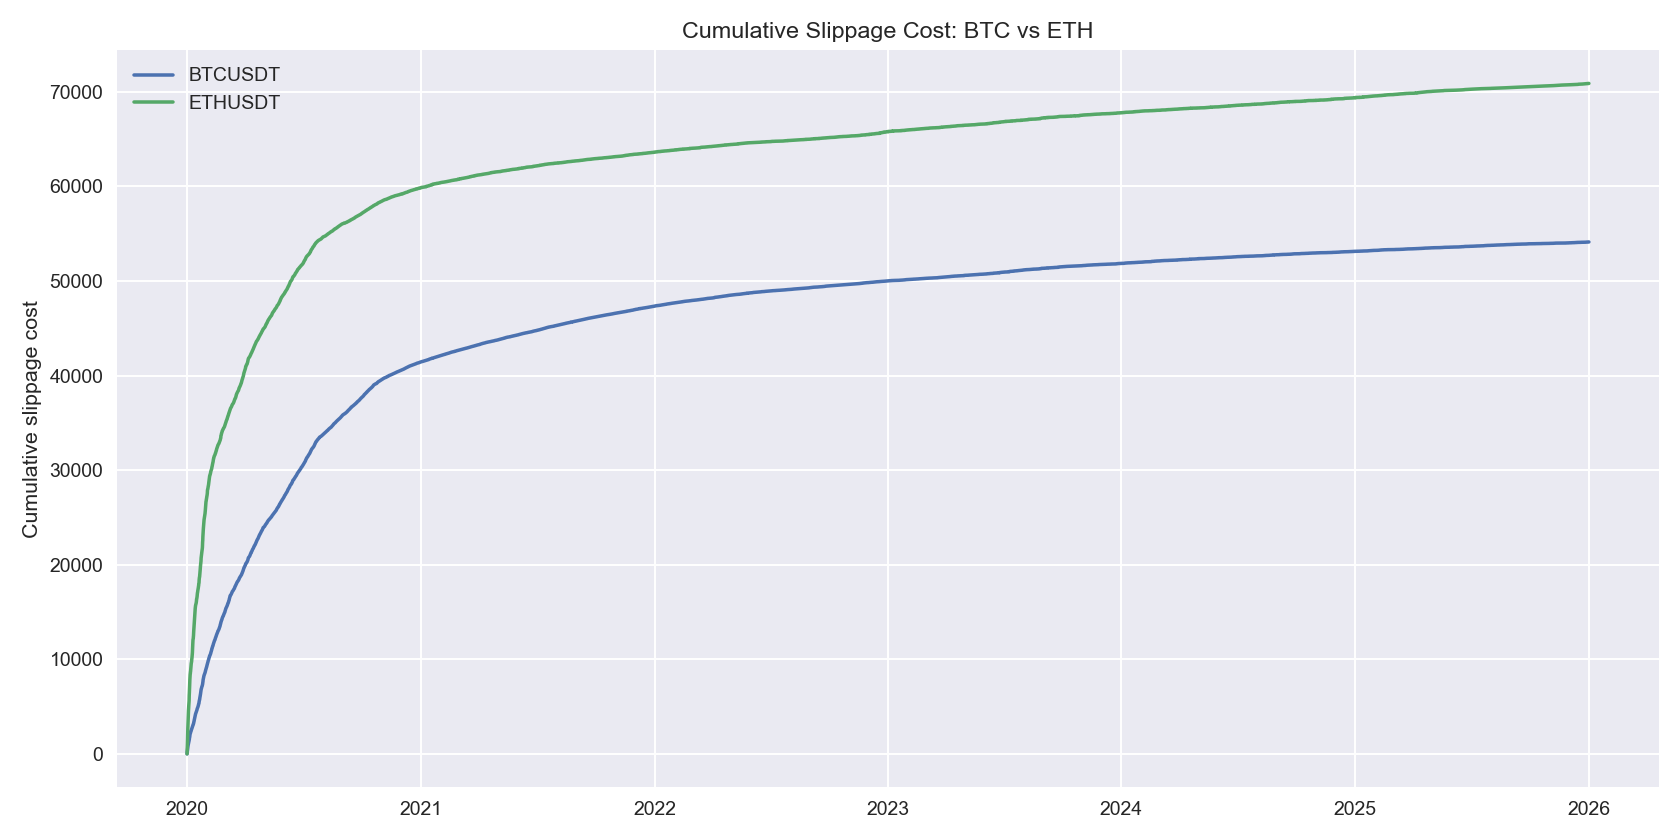
Illustration: This image looks at cumulative slippage costs in absolute dollar terms. The total slippage losses for ETH in this sample are higher than for BTC, indicating that even if not all periods are "harder" to trade than BTC, in terms of long-term execution costs, ETH is more sensitive to liquidity friction.
The implication behind this is straightforward: BTC may not always be worse in absolute trading volume and strategy turnover, but from the perspective of "unit liquidity costs," ETH is more susceptible to slippage erosion, especially in high-frequency and high-volatility scenarios.
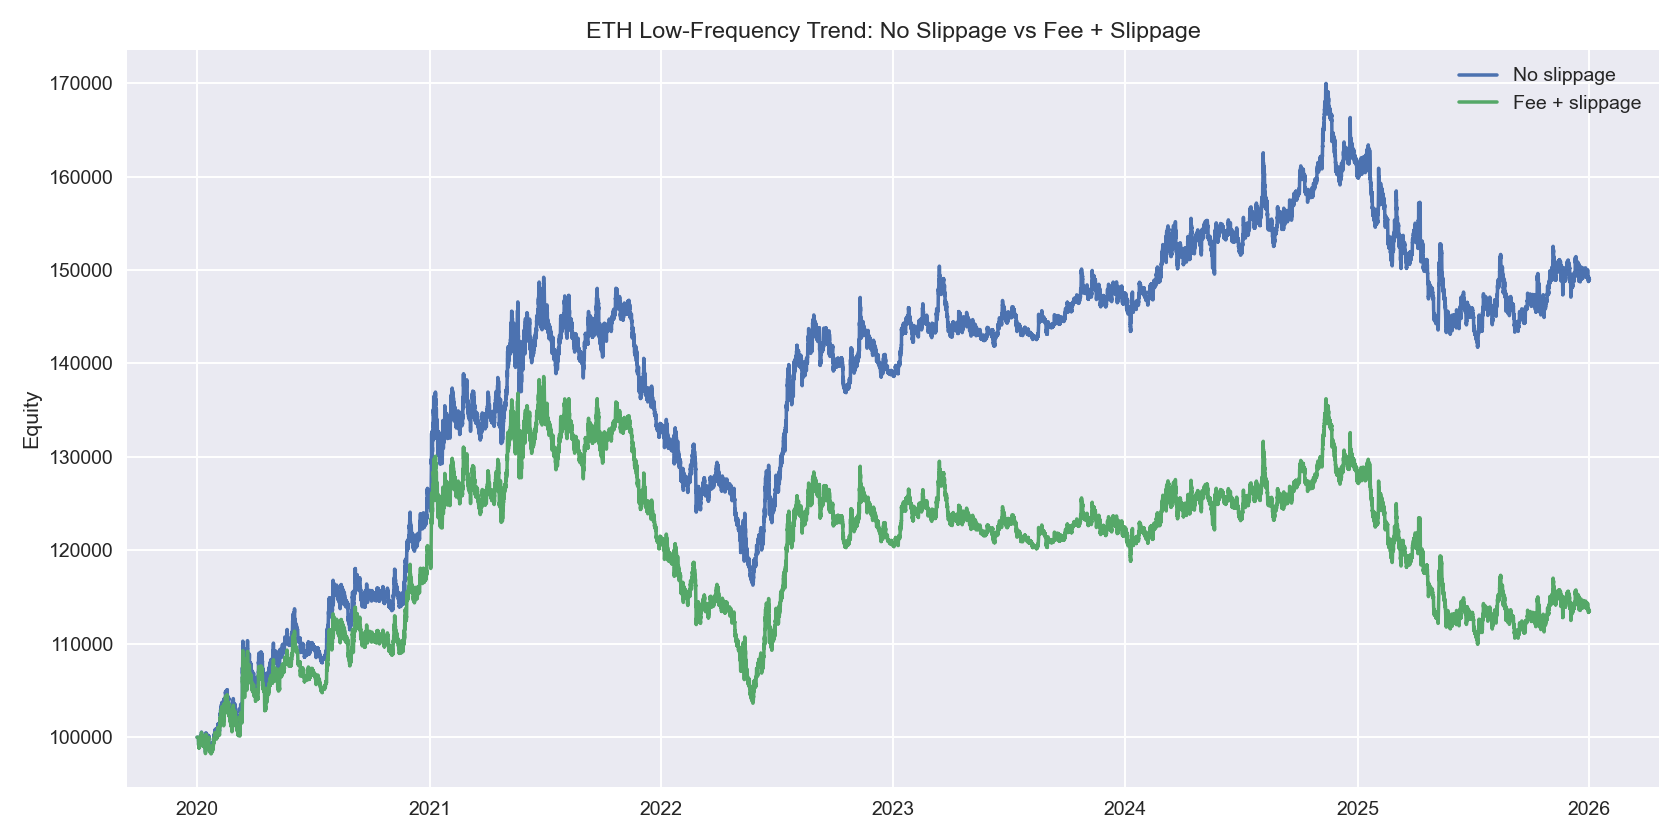
Illustration: This image provides a relatively positive reference. The ETH low-frequency trend strategy performs stronger without slippage; after incorporating fees and slippage, the profit is significantly compressed but still retains positive returns. This indicates that slippage does not render all strategies ineffective but distinguishes which strategies have sufficiently thick advantages and which are merely based on ideal execution assumptions.
This is why although the `ETH` low-frequency trend strategy can still profit, its returns have clearly been compressed compared to the no slippage version. It shows that ETH is not untradeable, but requires a safe buffer for execution costs.
7. Conclusion: Slippage Is Not A Minor Error, But The Life-and-Death Line of Strategies
The conclusions of this backtest are quite clear.
First, slippage is not a dispensable parameter in backtesting; it is a key variable that determines whether a strategy is realistically tradable. Second, many strategies show profits in backtesting but yield losses in reality, not because the strategies suddenly fail, but because paper backtesting assumes overly ideal execution conditions. Third, high-frequency strategies are most easily killed by slippage because they are essentially exchanging extreme high turnover for extremely thin single trade advantages. Fourth, ETH experiences overall higher unit slippage pressure compared to BTC, especially in scenarios of high volatility and high turnover. Fifth, as order sizes increase, slippage erosion is often not linearly increasing but resembles convex amplification.
For cryptocurrency traders, the real question to ask is not "how much can this strategy make in backtesting," but rather:
- After bilateral fees, how much is left?
- After reasonable slippage, how much is left?
- Can it survive on high-volatility days and in periods of low liquidity?
- Will it turn from profitable to losing as the capital scales up?
If these questions are not answered, the so-called high-return backtests are likely hiding the most critical cost assumptions.
免责声明:本文章仅代表作者个人观点,不代表本平台的立场和观点。本文章仅供信息分享,不构成对任何人的任何投资建议。用户与作者之间的任何争议,与本平台无关。如网页中刊载的文章或图片涉及侵权,请提供相关的权利证明和身份证明发送邮件到support@aicoin.com,本平台相关工作人员将会进行核查。


