Author: Hubble AI
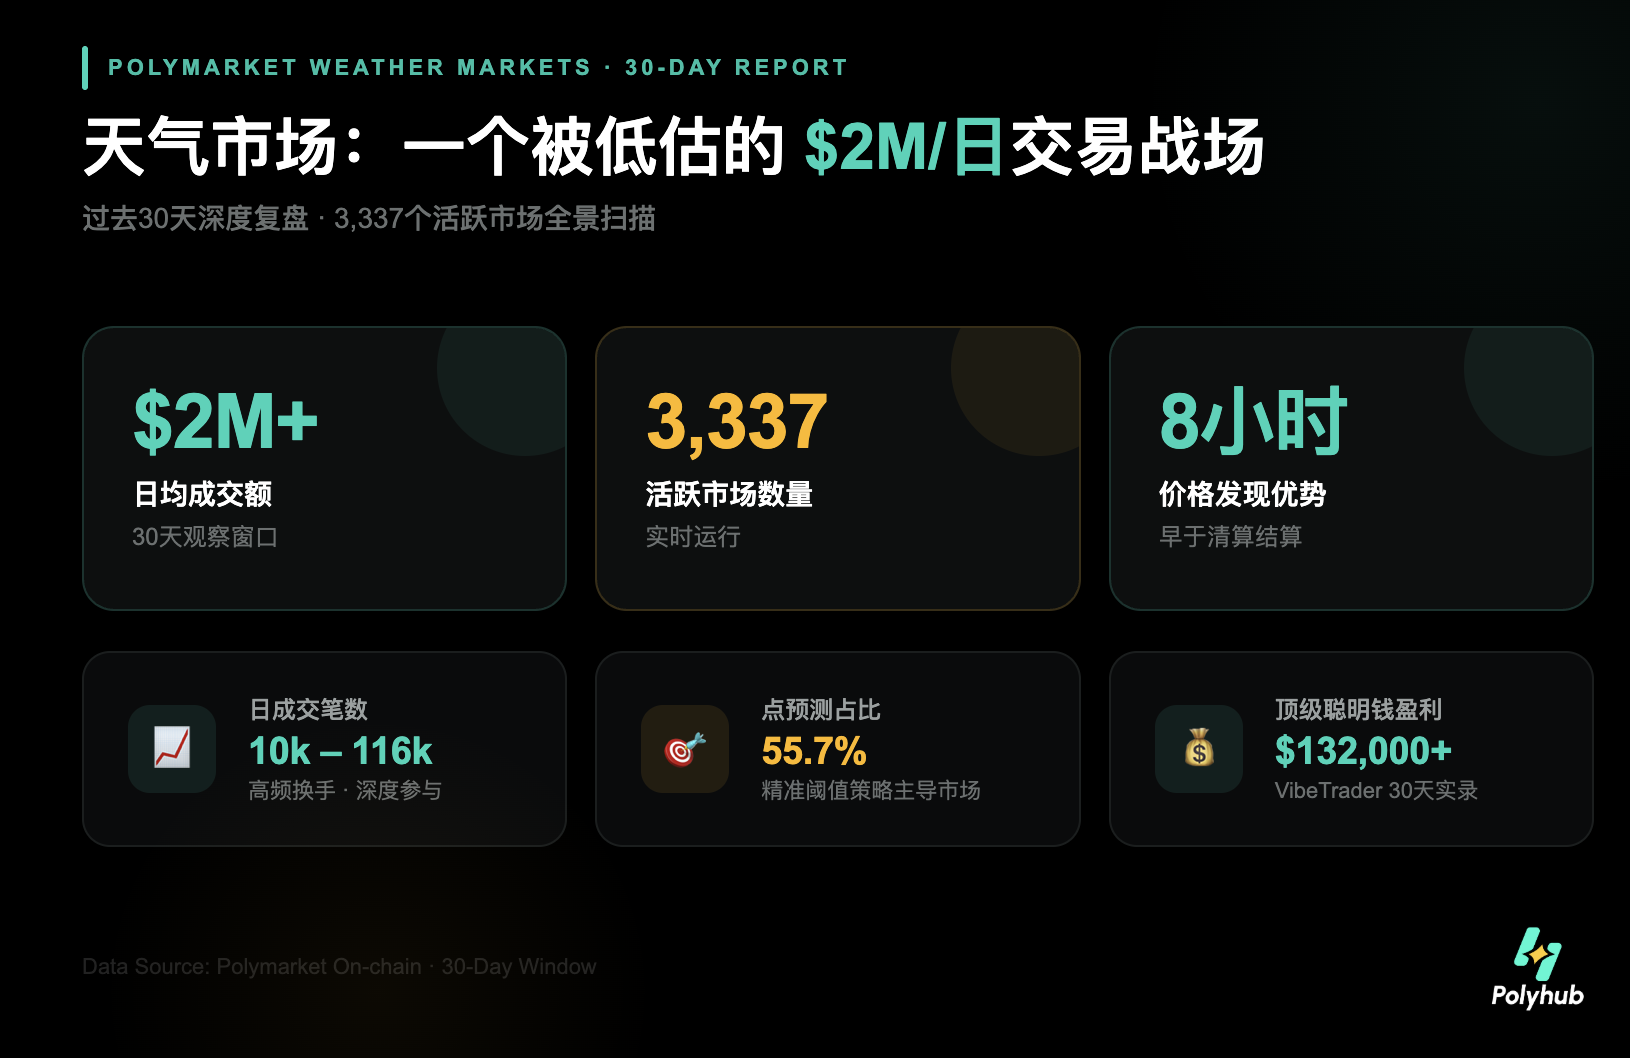
If you still think that Polymarket's weather predictions are just a little game of "guessing rain or shine," then you have missed a professional trading battlefield with an average daily transaction volume of $2M.
In fact, we have all underestimated the evolution speed of this track. In the recent observation window of 30 days, the weather market has grown from a so-called "niche play" into an independent sub-track with ample liquidity, frequent trading, and extremely precise pricing.
Article Overview
To unravel the wealth code behind the weather track, we will penetrate the market's surface from the following four dimensions:
- Where is the money?: Reveal the true ecosystem of an average daily transaction of $2M and understand why top cities have become the core of liquidity.
- Essence of the game: Discover why the weather market is essentially a "short-term options" market, and why 55.7% of transactions are for "point predictions."
- Arbitrage space: Review the London case from January 28 and understand why, despite temperature reaching the standard, there are still 8 hours of "bargains" in the order book.
- Master template: Track the smart money address VibeTrader that made over $132,000 in profits and replicate his "narrow range encirclement" strategy.
1. From "Niche" to an Independent Track of $2M Daily Average
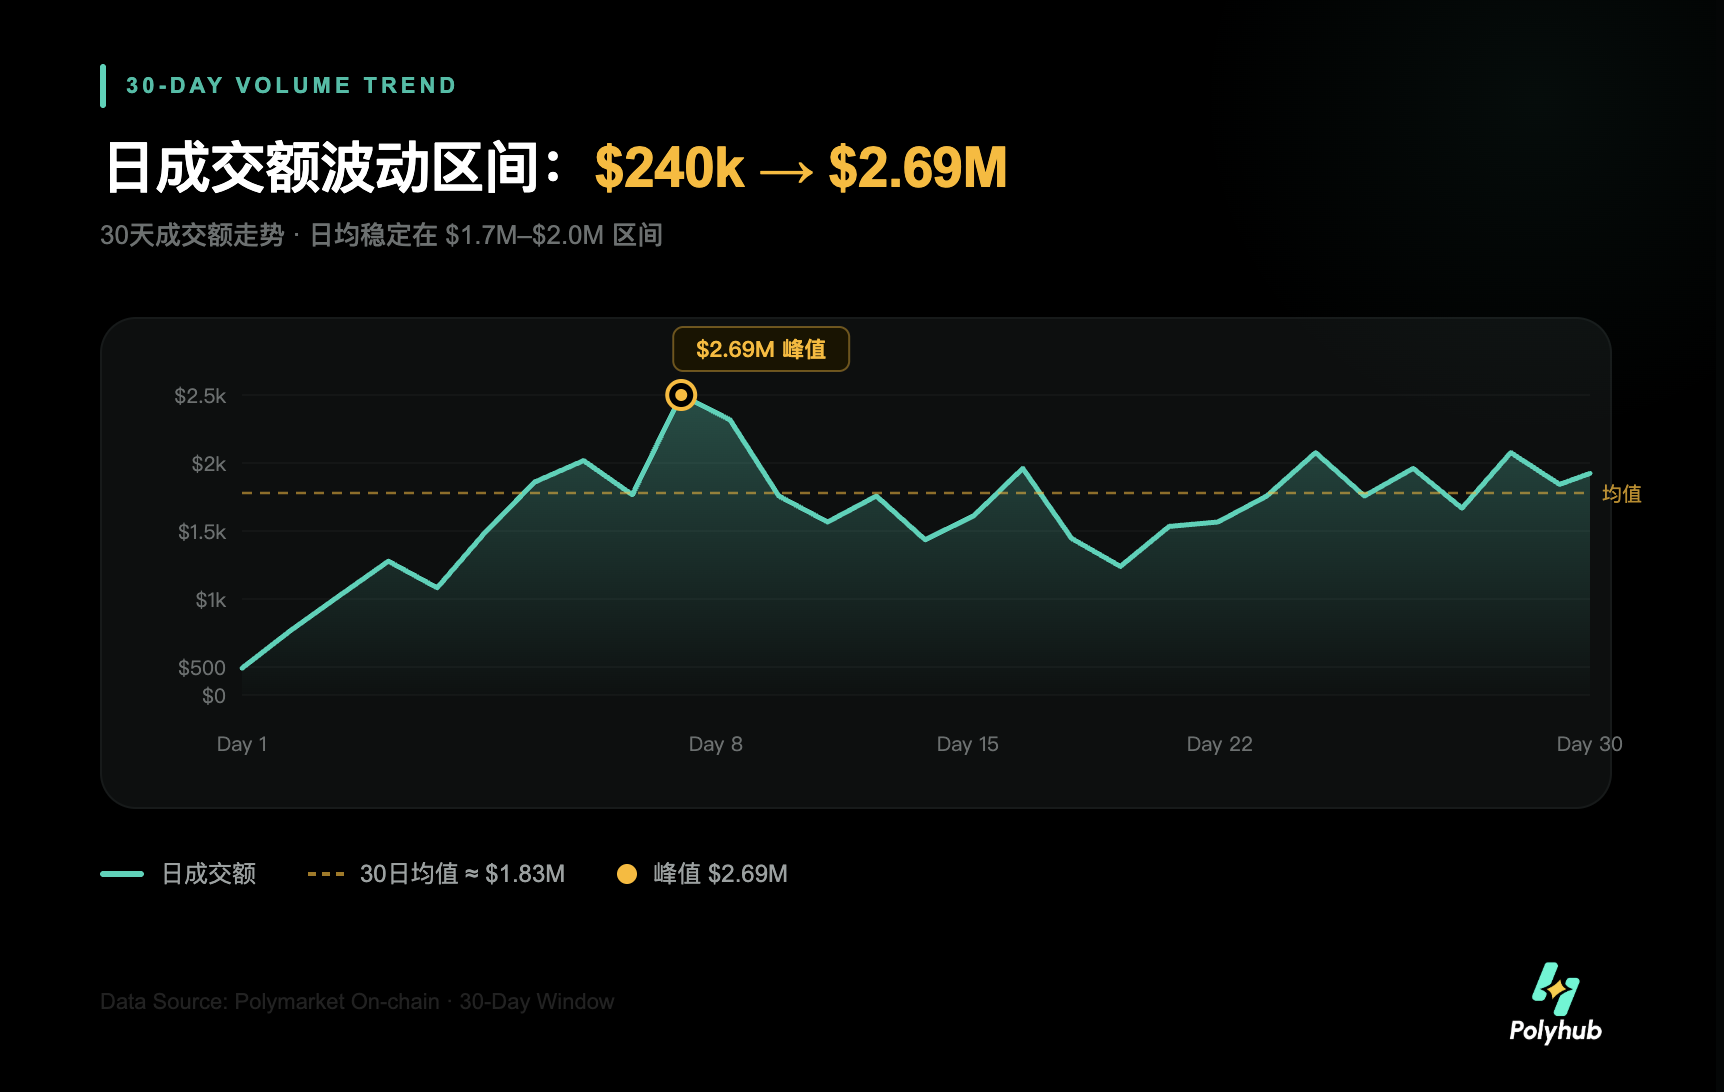
Data does not lie. Over the past month, the daily transaction volume in the weather market has fluctuated dramatically between $240k and $2.69M, and the average daily transaction volume has steadily crossed the barrier of $1.7M - $2.0M. This means that on any given trading day, there are a total of 3,337 active weather prediction markets running in real time.
Even more interesting is the trading frequency. The number of daily transactions remains between 10k and 116k, indicating that this track not only has a total amount of funds but also excellent turnover rates and participation depth.
2. This is Actually a "Short-Term Options" Market
If you observe the microstructure of these markets closely, you will find they remarkably concentrate geographically. The three major cities: London (37%), New York (19%), and Seoul (17%) account for 73% of the total transaction volume of the entire track. However, within these cities, liquidity exhibits a "moderate long tail" characteristic: the top 20 contracts only account for 24.4% of the total transaction volume.
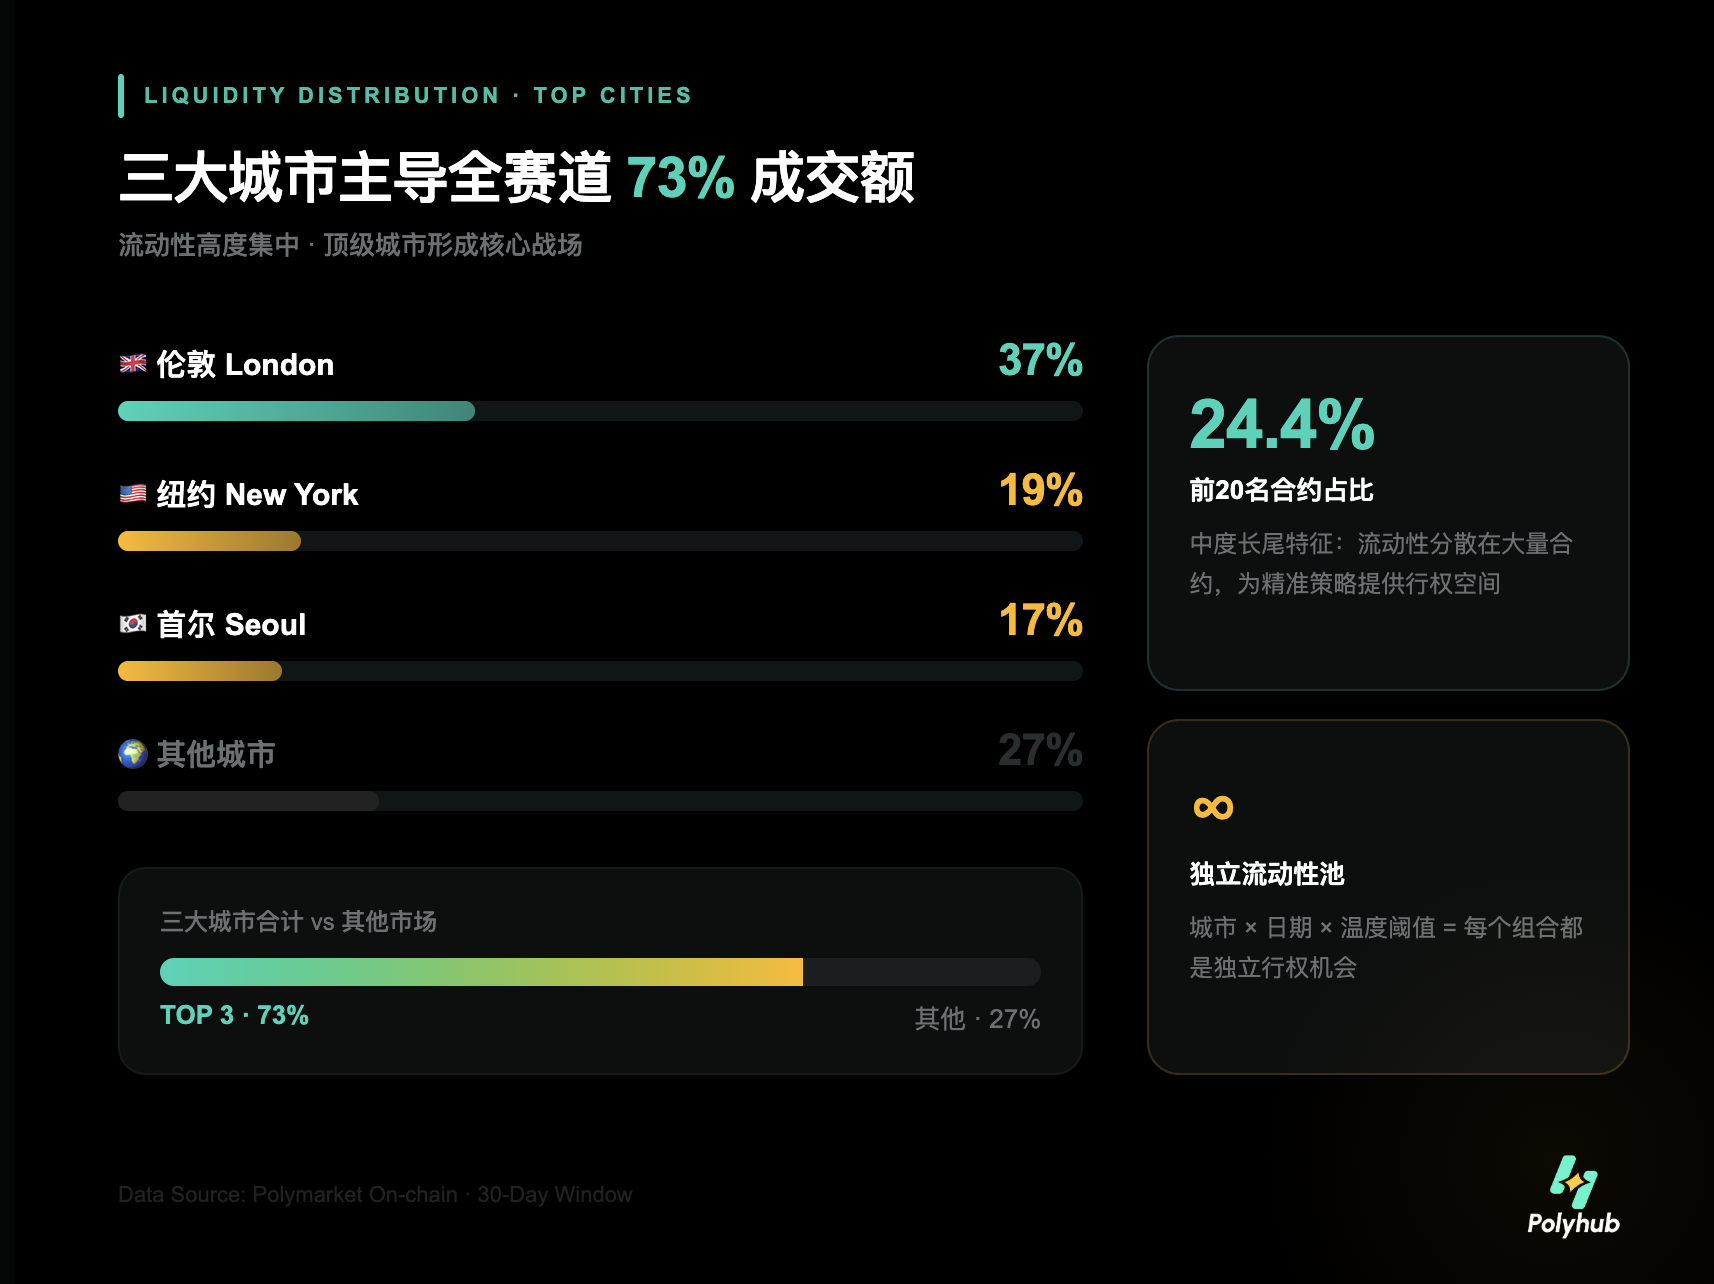
This structure resembles a short-term options market. Every combination of "city x target date x temperature threshold" is, in fact, an independent liquidity pool. This fragmented threshold setup provides trading participants with information advantages the precise space to "exercise."
3. Extreme Precision in Betting: Why is there Great Opportunity in a 0.79% Price Spread?
In the weather track, relying on "guesswork" is no longer feasible. Studies show that this is a higher-level market dominated by precise algorithms and point-to-point games:
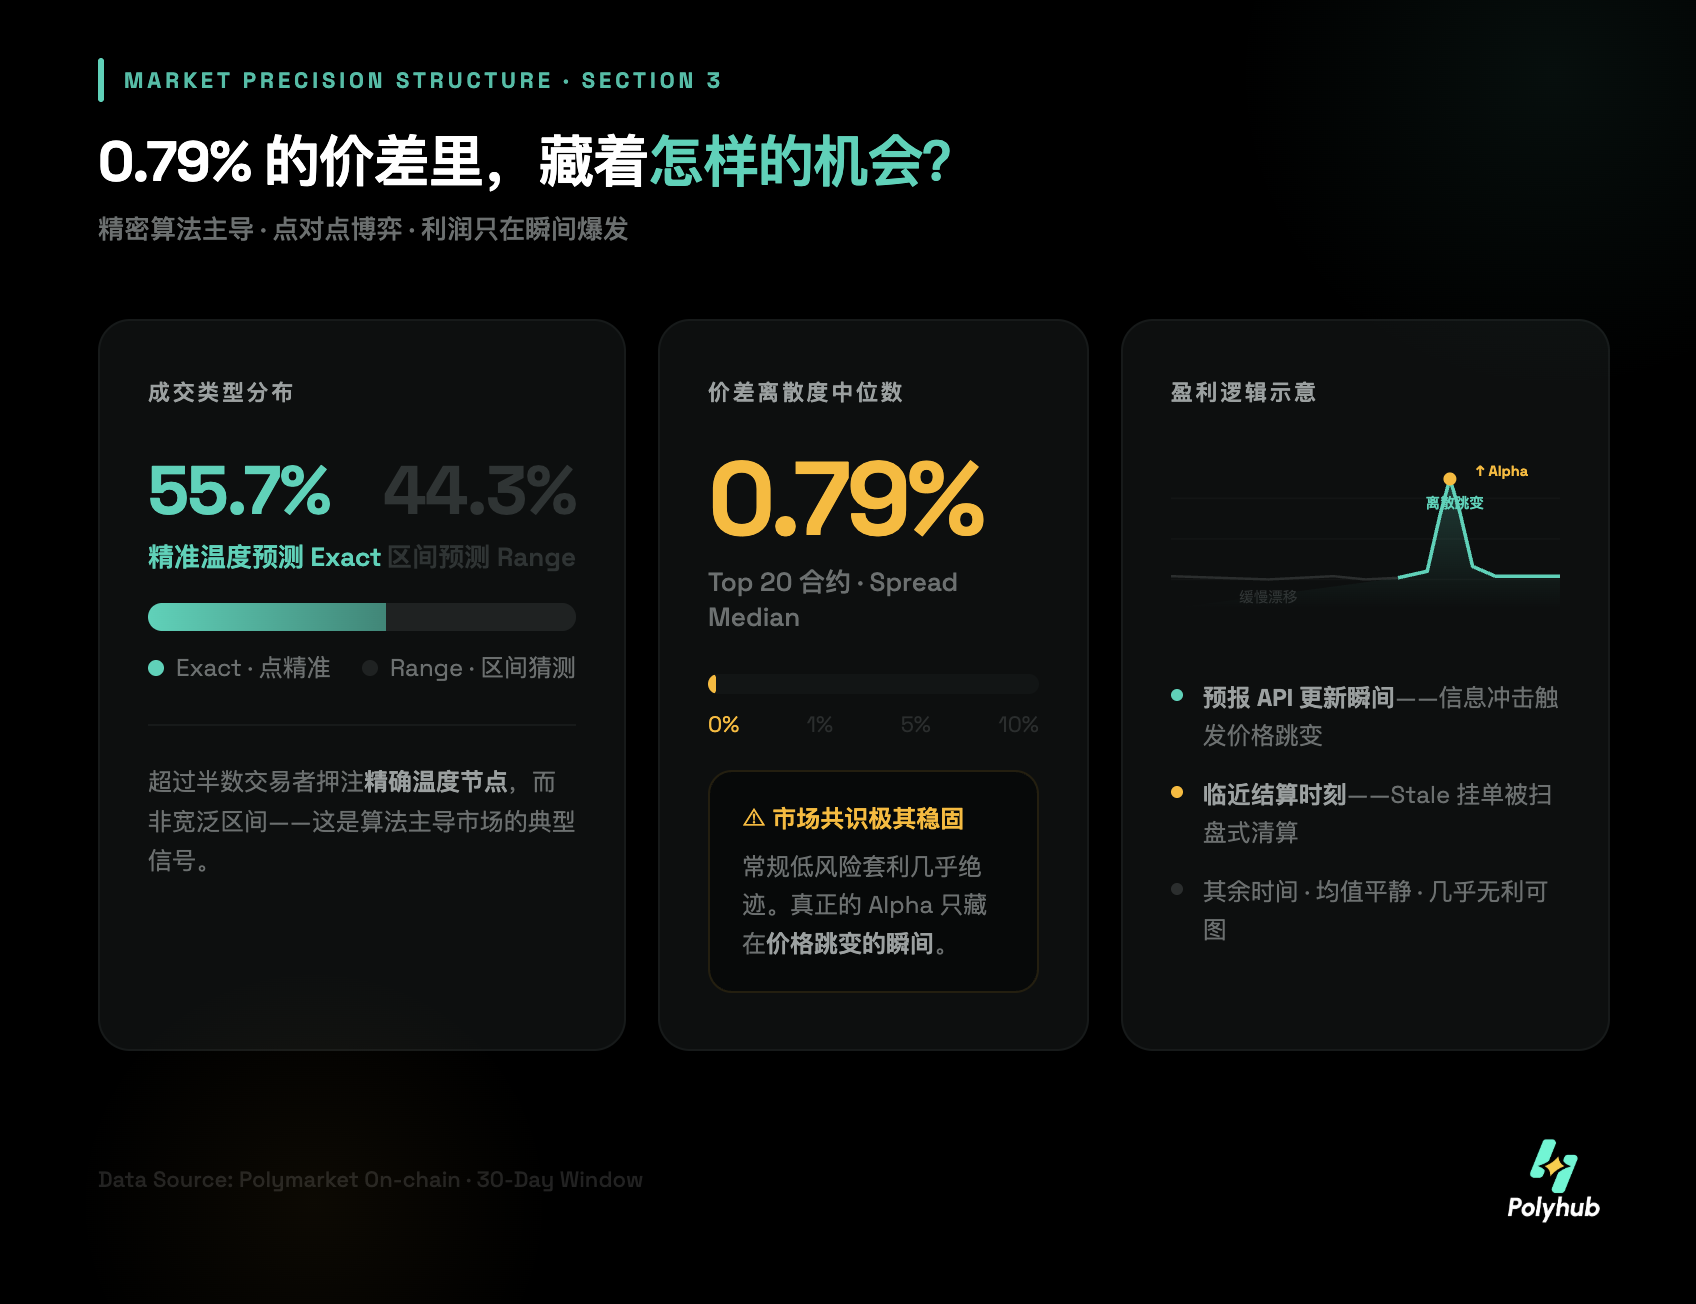
- From "Ambiguous" to "Precise": Over 55.7% of trades are locked into "precise temperature predictions" (Exact), rather than muddling through large ranges.
- Disappearing Arbitrage Space: The median dispersion of price spreads among Top 20 contracts is just 0.79%, indicating that market consensus is extremely solid, and conventional low-risk pick-up opportunities are virtually extinct.
- Profits Only Erupt Instantly: Don't focus on the calm average line. The profit logic of the weather market lies not in "slow drift," but in "discrete jumps."
- Window of Opportunity is Everything: When the forecast API updates or moments before settlement, prices see dramatic jumps; this is the true moment for experienced players to enter and harvest.
4. Capture the "Zombie Dividend" in the Order Book
This is the most exciting discovery for traders in this research: The speed of information diffusion is far faster than the speed of capital liquidation. This phenomenon of "quotes moving first, deals following" reveals the true source of Alpha.
On Polymarket, price discovery is often first reflected in the implied probabilities displayed on the UI interface, but the actual price sequences may experience disconnections lasting several hours due to the lag in execution mechanisms.
Taking January 28's London maximum temperature market as an example. At 3:00 PM that day, the maximum temperature in London had already solidly reached 10°C. This should have been an information shock sufficient to prompt the market to instantaneously reprice, but interestingly, although the UI probability had changed, the actual transaction price in the order book still hovered between 0.50-0.65, stubbornly holding for a full 8 hours. This is because under the CLOB structure, a large number of limit orders that were not promptly canceled formed what is known as "stale liquidity." It wasn't until around 10:50 PM approaching settlement that arbitrage funds initiated a "sweeping execution," rapidly consuming incorrectly priced orders of various levels, causing the price to collapse from 0.90 down to nearly 0.
5. Master Template: Analyzing VibeTrader's "Encirclement Strategy"
We analyzed the leading smart money address VibeTrader, which made over $132,000 in profits through PolyHub, summarizing a replicable practical path:
- First Step: Narrow Range Encirclement (Early Game): He never bets on single points but builds "encirclement positions" early on. For example, simultaneously buying adjacent levels of 31°C and 32°C.
- Second Step: Dynamic Pruning (Mid Game): As the forecast API data converges, he sells out the unlikely "waste positions" like pruning branches, keeping only the one or two levels with the highest final probabilities.
- Third Step: End Game Sweeping (End Game): Utilize the coarse characteristics of the weather market price ladder to clean up erroneous orders in the order book just before settlement, aiming for the last convexity profits.
6. Trader's Practical Guide: How to Find Your Edge?
- Focus on "Information Lag": Don't be scared off by the UI curves. If the forecast shows that the temperature has reached the standard, look for those old orders in the order book at price levels of 0.5-0.6 that haven't been canceled; that is your profit.
- Algorithm Game: Read the weather forecast API to calculate real-time distribution and look for Underpriced Bins (undervalued temperature ranges) that are mispriced relative to market prices.
- Avoid "Thick Order Traps": The weather market does not have deep liquidity, and large orders can easily cause significant price dispersion. Learn to position like VibeTrader with batches and multiple levels.
The weather market has proven itself no longer a game for the marginalized but rather a gold mine with extremely precise pricing yet leaving room for execution lag.
免责声明:本文章仅代表作者个人观点,不代表本平台的立场和观点。本文章仅供信息分享,不构成对任何人的任何投资建议。用户与作者之间的任何争议,与本平台无关。如网页中刊载的文章或图片涉及侵权,请提供相关的权利证明和身份证明发送邮件到support@aicoin.com,本平台相关工作人员将会进行核查。


