Bitcoin Trend Analysis
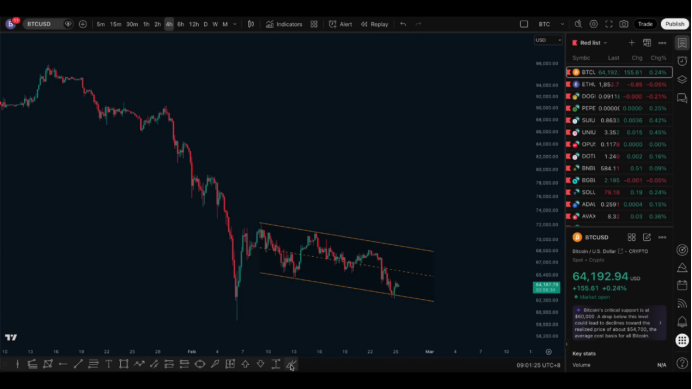
Yesterday, the price of Bitcoin dropped as low as around 62,500, which tested the lower boundary of the downward channel. After the test was completed, the price experienced a small rebound.
However, it is important to note -
For the one-sided decline from 68,500, I personally do not believe this is just a normal pullback within the channel, but tend to judge that: a new downward trend has already begun in the long cycle, and this segment belongs to the initial drop of the new trend.
Therefore, what we focus on next is:
If the price rebounds after touching the lower boundary of the channel, where are the short positions worth paying attention to above.
According to the retracement of this one-sided decline, we pay close attention to the 0.5-0.618 retracement range, corresponding to a price of about 65,600-66,400. In fact, this area can directly refer to the previous phase's low point position - the low point of the previous "decline - rebound - further decline."
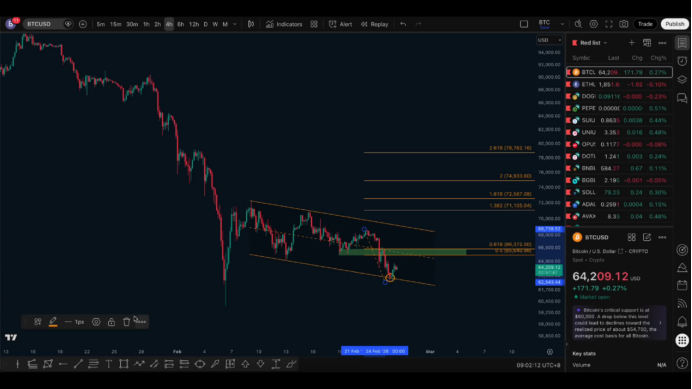
This position can be seen as a resistance level above, and it is also a potential selling area for the next stage.
If the price rebounds into this range, it is advisable to prioritize placing short orders at high positions within the range, with the target looking at breaking the previous low. Currently, the previous low is around 60,000, so the short-term bearish targets are:
First look for a break at 60,000
Then look for Bitcoin starting with 5
Upper Limit Resistance
If the price strongly breaks through the 65,600-66,400 range, then there remains an extreme resistance level above - approximately around 68,500.
From the past consolidation decline, it can be clearly seen:
The high points of the waves are gradually moving downwards
The previous second-high point also corresponds to the 0.5-0.618 retracement of the previous decline
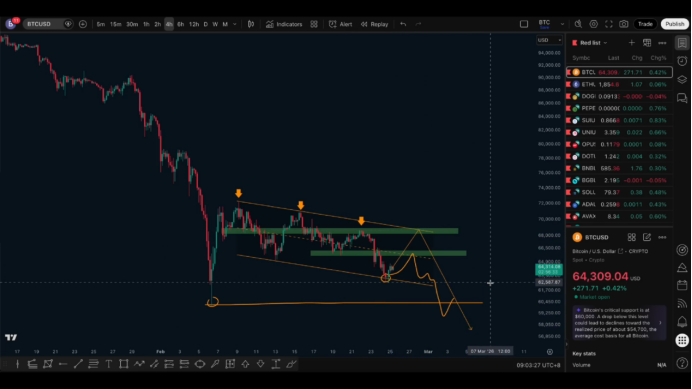
In a one-sided declining market, retracement of 0.5-0.618 is usually considered a temporary selling area, which is a classic bearish structure.
More importantly, this area has multiple historical occurrences:
Support and resistance interchange
Multiple structural resonances
Therefore, even if the price further rebounds to a higher resistance area, the overall thinking remains predominantly bearish.
Trading Thought Summary
My current execution framework is:
First Resistance Level: 65,600-66,400
If it encounters resistance and drops here → Consider placing shorts
Defensive reference upper second resistance level
Second Resistance Level: Around 68,500 (extreme pressure)
If the first resistance is effectively broken → Patiently wait for the second resistance area to find opportunities again
Defensive reference can refer to the previous phase high point (above the region of 70,000)
The currently preferred scenario:
Price slightly rebounds → Encounter resistance at the first resistance → Continue to decline.
Ethereum Trend Analysis
Compared to Bitcoin, Ethereum's overall performance is relatively weak.
From the structure, we can see:
The range of fluctuations has converged from wide to narrow
The high points have not formed effective breaks
The overall price focus continues to move downwards
Highs are constantly lowering
This indicates:
Bearish strength is increasing
Bullish momentum is weakening
Selling pressure above is continuously increasing
Ultimately, the price has broken below the key support levels.
Key Structure of Ethereum
During the last two retests of the lower support:
The first rebound was relatively strong
The second rebound was significantly weaker
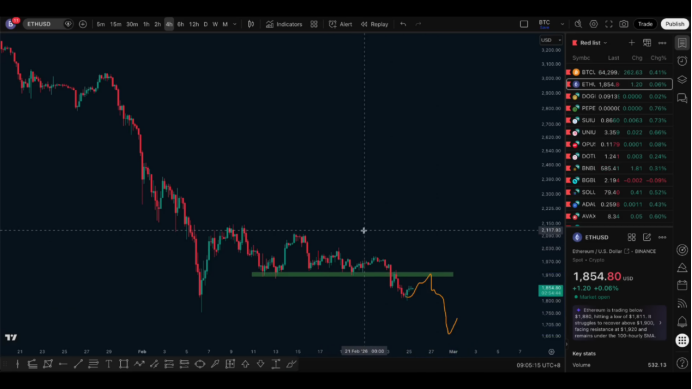
This is a typical signal of weakness.
Once key support is effectively broken, according to structural logic:
The former support level is likely to convert into resistance in the future.
Thus, if the price rebounds back to the upper resistance area, it is highly likely to encounter resistance and drop again, and a new round of downward trend is expected to continue.
Ethereum Trading Thoughts
If placing shorts near the upper resistance:
Defense level can refer to previous high points (just above 2,000)
There is also a second resistance area above (historical area where support and resistance have interchanged multiple times)
The overall structure is similar to Bitcoin, but Ethereum's performance is weaker, so in the short term, I personally tend to prioritize focusing on short opportunities in Ethereum.
Currently, the first resistance area above is already a relatively clear and effective pressure zone, and it is also a selling area worth focusing on.
Follow me, join the community,let's progress together.

免责声明:本文章仅代表作者个人观点,不代表本平台的立场和观点。本文章仅供信息分享,不构成对任何人的任何投资建议。用户与作者之间的任何争议,与本平台无关。如网页中刊载的文章或图片涉及侵权,请提供相关的权利证明和身份证明发送邮件到support@aicoin.com,本平台相关工作人员将会进行核查。


