一、短线思路回顾
在昨天的视频中我已经强调过:日内短线不建议在高位追多。
当前这个位置,虽然底部已经形成了一个反转结构,颈线完成破位,关键阻力被突破之后,行情也确实走出了一段放量上涨。但即便如此,这一波拉升之后,依然不建议在高位阶段盲目追多。
原因很简单:如果你在这里追多,防守位至少要放在下方多重底部的颈线支撑附近,风险收益比并不理想。
而且我们昨天也讲过,短期存在向下回调的可能。复杂调整行情本身就比较难做,因为这类结构通常是不规则震荡,节奏反复。
�� 相对稳妥的思路是:
价格回落后,低位博弈反弹多
价格冲高后,高位博弈回落空
以高抛低吸为主
尽量避免两种常见错误:
❌ 涨上去追多
❌ 跌下去追空
二、昨日交易回顾
基于上述判断,昨天高位区域我们是有参与一笔比特币短空的,目前早间已经顺利出局。
整体逻辑没有变化:
短期:看一笔回调
中期:看一段反弹上涨
长期:仍关注新的下跌趋势机会
但这里有一个关键变量——下方支撑能否守住。
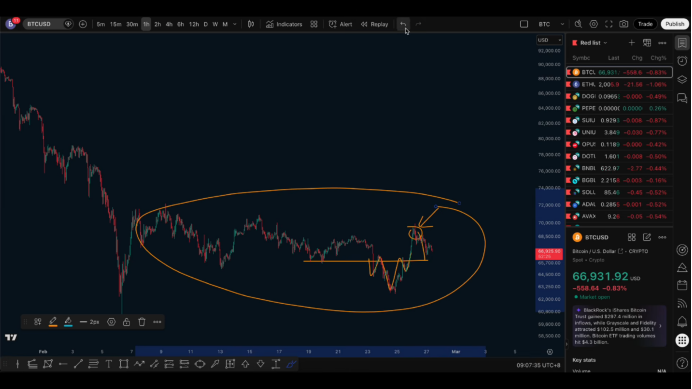
三、比特币关键位置
当前最核心的支撑区在:
�� 65,000–66,000 区间
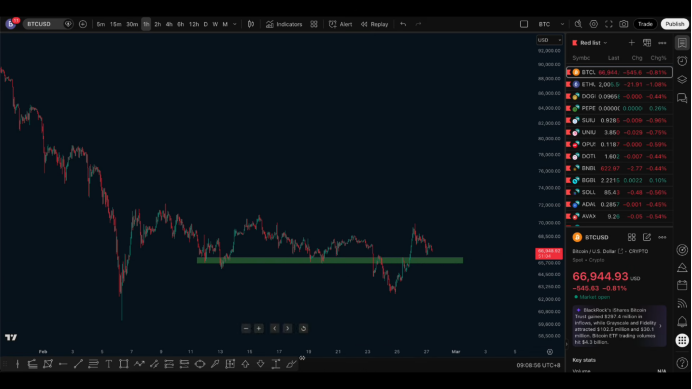
这个位置之所以关键,是因为:
这里曾经是重要支撑
跌破之后,两次回测形成有效压力
属于典型的支撑与阻力互换区域
前天行情在这里构建了多重底部并向上突破,随后出现回调。
✅ 接下来市场的核心观察点就是:
这一轮回调下来,该支撑能不能撑住。
四、两种可能路径
情况一:支撑守住(偏强)
如果65,000–66,000区域能够有效承接,形成不断抬高的波段低点,那么市场有机会走出:
➡️ 二段上涨
➡️ 上破前高
➡️ 去拿上方流动性
这种结构在技术上是成立的。
情况二:支撑失守(转弱)
如果后续出现新的低点,并且再次形成下破,那么市场大概率会进入:
➡️ 更低高点
➡️ 空头趋势延续
这一点需要保持警惕。
五、以太坊结构同步解读
以太坊的结构与比特币高度类似。
这一段放量拉升之后,高位同样不适合追多。昨天我们在会员体系中也参与了以太坊高位短空。
目前来看,这一轮下跌大概率还没有完全到位。
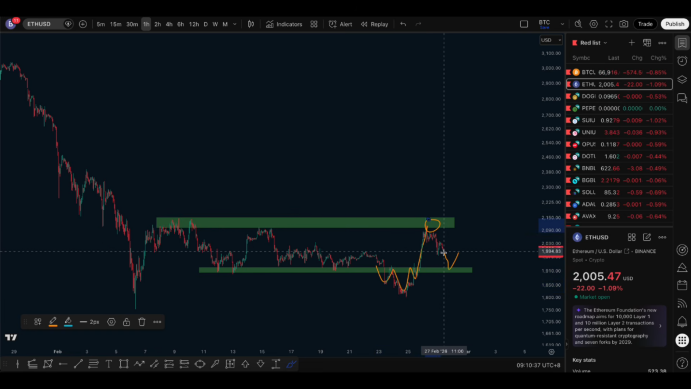
�� 以太坊关键支撑:
1,900–1,920 区间
这里同样是:
前期支撑
跌破后的压力测试区
多空转换关键位
六、以太坊后续关注
短期更大的概率是:
➡️ 继续向下回撤
➡️ 测试1,900附近支撑
接下来重点观察:
如果1,900附近企稳 → 有望再走一波反弹
如果有效跌破 → 结构会明显转弱
七、关于前期“诱空”的复盘
前面那一段快速下破,其实事后看属于一次诱空行为。当时我个人也一度判断为趋势延续,但最终市场给出的答案是震荡结构。
这也再次说明:
⚠️ 当前市场仍处在复杂震荡阶段
⚠️ 单边思维很容易被来回打脸
而且从时间维度看:
前一轮盘整接近1个半月
当前调整时间还不到1个月
从周期上讲,震荡可能还没有完全走完。
八、当前最务实的交易策略
现阶段我的核心观点不变:
✅ 短期:看持续震荡调整
✅ 操作:以短线高抛低吸为主
✅ 错过位置:宁可等待,不要追价
记住一个简单原则:
没赶上高位空 → 等低位多
没赶上低位多 → 等高位空
两边都没等到 → 就继续等
耐心,本身就是交易的一部分。
九、趋势级别的大胆预判
如果后续市场能够有效上破前高,那么大概率意味着这一段调整接近尾声,市场有望进入新的上涨段。
但如果迟迟不能上破,反而走出新的低点,那么下一阶段我们就要开始更多考虑:
➡️ 更低高点
➡️ 空头趋势延续
关注我,加入社区,一起进步。

免责声明:本文章仅代表作者个人观点,不代表本平台的立场和观点。本文章仅供信息分享,不构成对任何人的任何投资建议。用户与作者之间的任何争议,与本平台无关。如网页中刊载的文章或图片涉及侵权,请提供相关的权利证明和身份证明发送邮件到support@aicoin.com,本平台相关工作人员将会进行核查。


