Hello everyone, I am Qinglan.
In today’s class, we will not talk abstractly, but instead directly discuss the market data and news. Many students often ask me how to interpret market movements and what to do during pullbacks. In fact, the answers are all written in the candlestick charts and hidden in the details of the news. Come, follow my rhythm, and let’s break it down step by step.
1. In-Depth Market Context and Technical Analysis
We’ll start by looking at the fastest 15-minute chart. In the past 48 candlesticks, Bitcoin has gone through a textbook-like “building a tall building from flat ground.” From around 63000 last night to a sudden surge up to 66300 this morning, the intensity of this movement can be accurately described as “pulling out a spring onion from dry ground.”
If you look at the moving averages, it was previously a bearish arrangement with prices being suppressed, but late at night, the MA5 and MA10 quickly crossed above the MA20, forming a standard short-term bullish pattern. What does this indicate? It indicates that market momentum was ignited in an instant. Coupled with MACD's golden cross and the expanding red bars, along with RSI spiking to the overbought zone at 79, all point to one fact: short-term sentiment is enthusiastic, and there is a strong willingness to accumulate funds.
However, for those of us who trade, especially when looking at short-term, the most taboo thing is being “one-track-minded.” You can see that in the recent candlesticks, from the high of 66200, it fell back to 65300, and the MA5 started to curve downwards, about to create a dead cross with the MA10; MACD also gave a short-term death cross signal, the green bars began to show, and RSI rapidly dropped to 54. This signal couldn’t be clearer: the recent main bullish wave (15 minutes) has entered a “consolidation period”, and the market needs to catch its breath and digest this wave of rapid profit-taking.
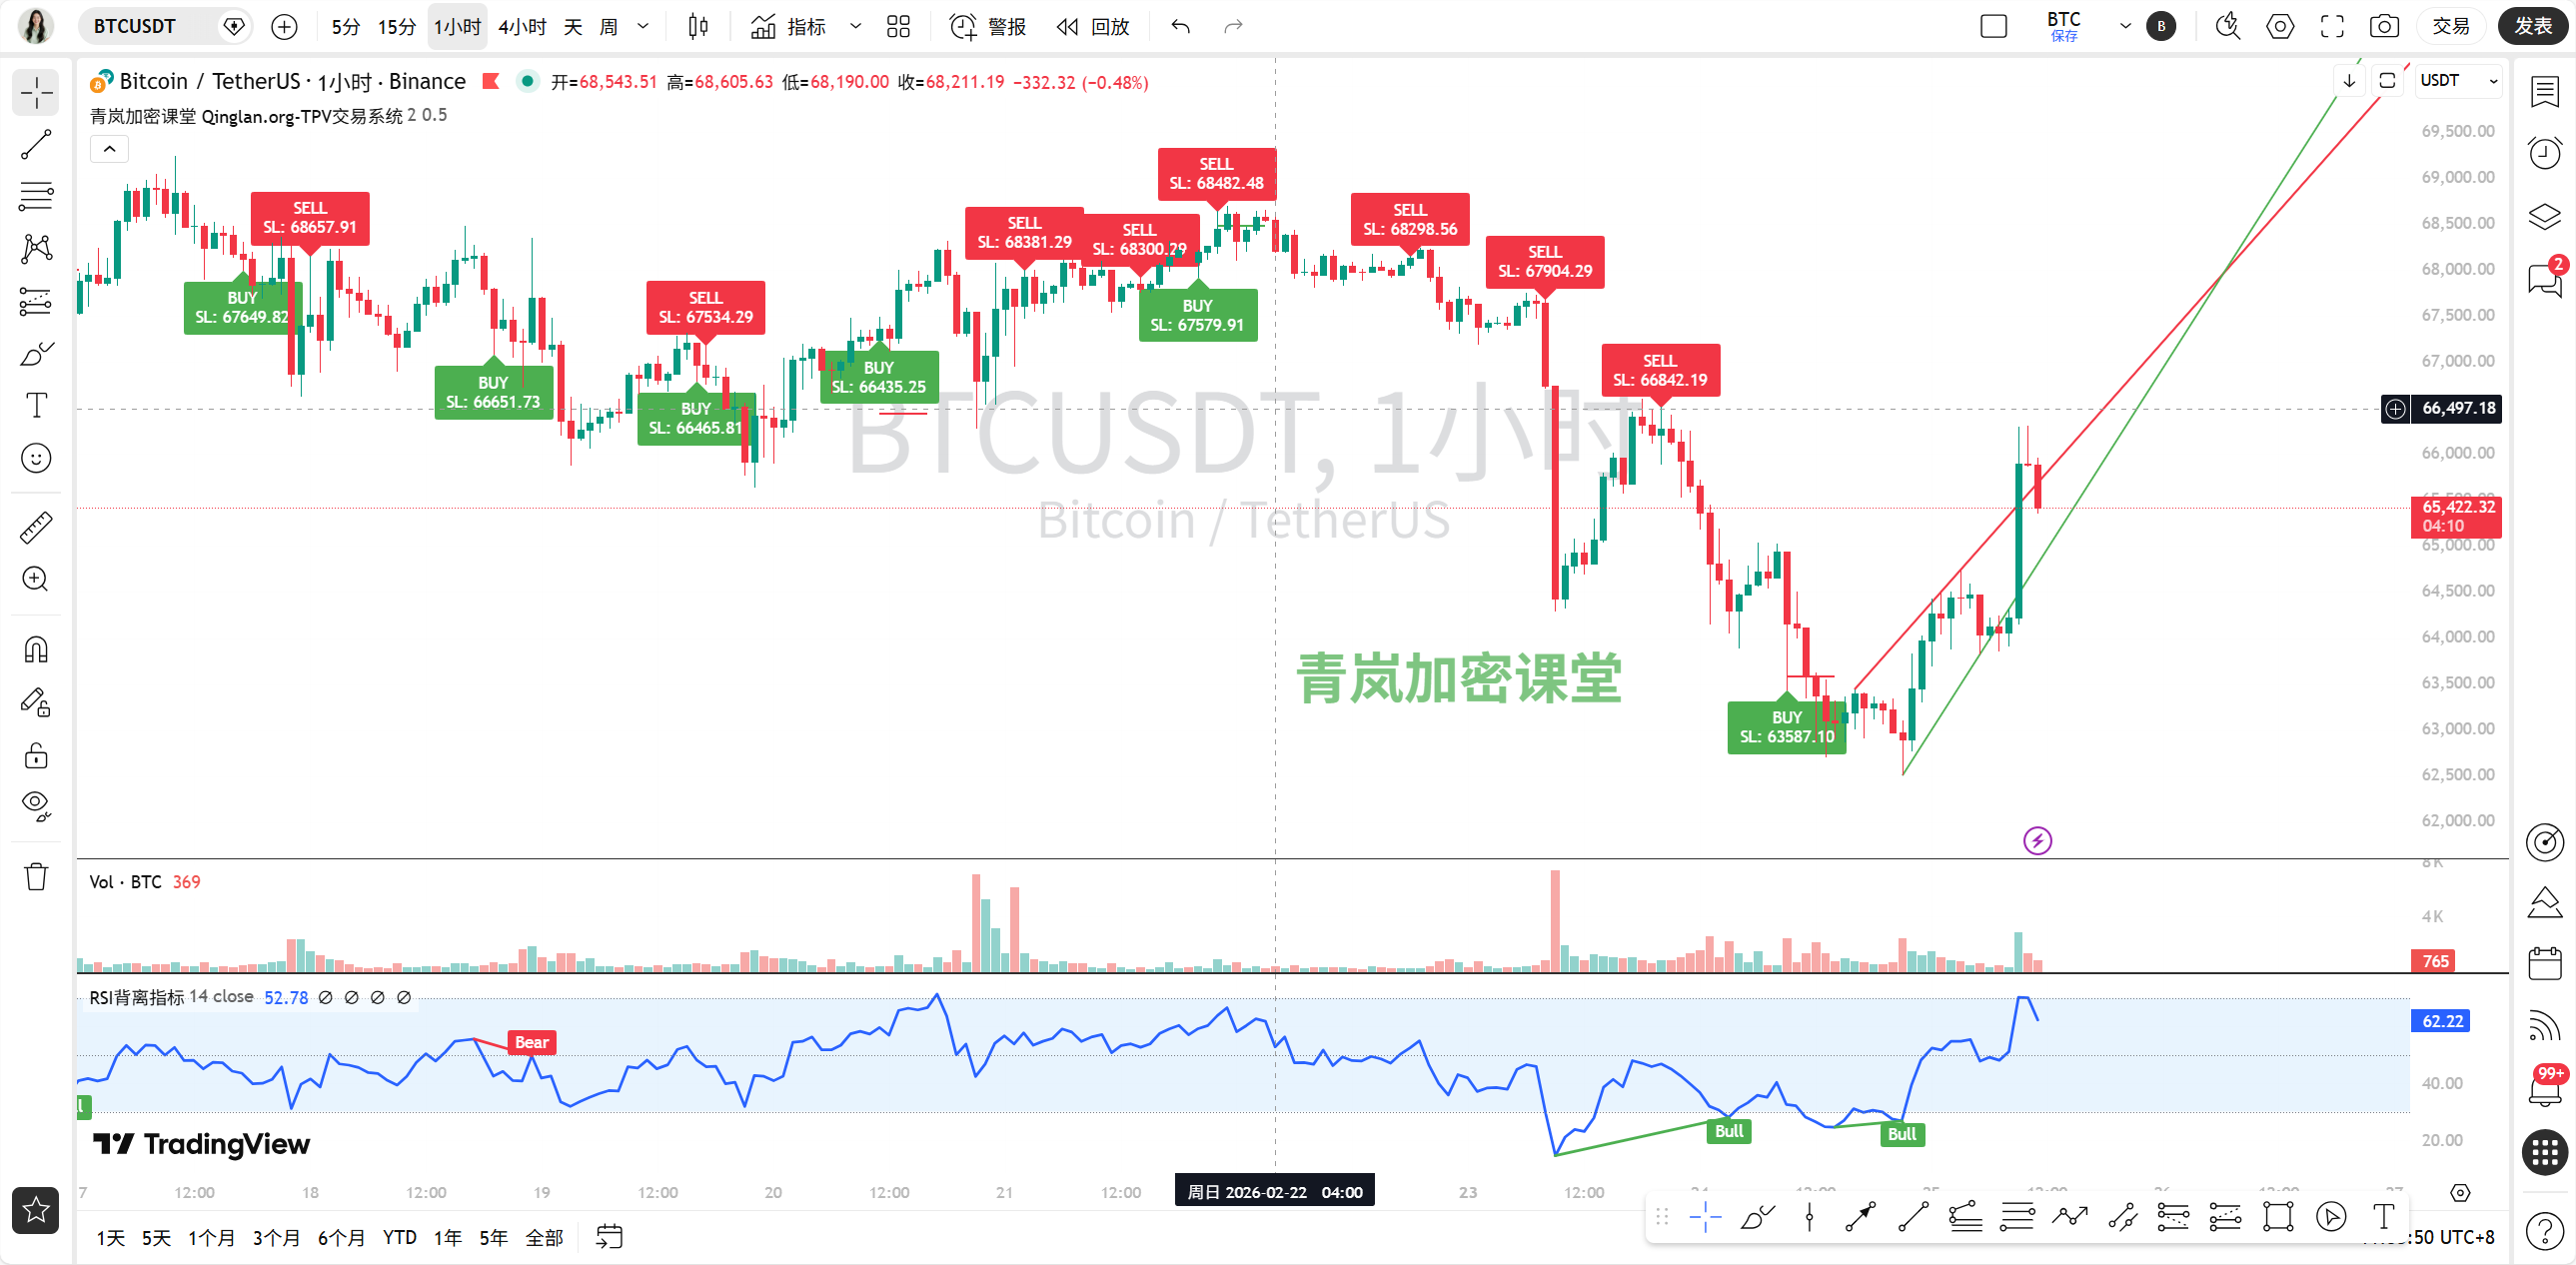
When we extend the timeframe to the 1-hour chart, the context becomes clearer. These 48 candlesticks record a complete “V” type reversal. The crash on February 23, with RSI dropping to 14, represented extreme panic in a “long-killing long” situation. However, such extreme fear often nurtures the seeds of a rebound. Last night's rally changed the MA from a bearish arrangement to a bullish arrangement, as MA5 and MA10 crossed above MA20, creating a very pretty "golden cross on water". Although the red bars on MACD above the zero axis have shortened, it still indicates a healthy golden cross state. Therefore, the 1-hour level tells us that the market has successfully climbed out of the downtrend and is entering a medium-term rebound cycle, currently just undergoing a normal consolidation process during the rebound.
Looking at the 4-hour chart, this relates to our judgment of the nature of this rebound. Previously, the fall from 70,000 down to 63,000 was a typical descending channel. However, the recent candlesticks, particularly last night's surge, show that the most crucial signal lies in MACD— the DIF line has begun to accelerate upwards, the green bars turned red and continued to expand. This is a very strong bottom divergence signal, indicating that the downward momentum has been exhausted, and the bulls' strength on the 4-hour level is like a “spark that can start a prairie fire.” While we cannot say that the medium-term downtrend has been completely reversed at this point, there is no doubt that it is constructing a phase bottom, brewing a strong rebound.
Finally, looking at the 1-day chart, we cannot lose sight of the big picture. The moving averages at the daily level are still in a bearish arrangement, and MACD remains below the zero axis. What does this indicate? It indicates that we are still in the stage of consolidating the bottom within a bearish market structure. However, please pay attention to the continued shortening of the MACD green bars and the upward hook of the DIF line, which represent the slowing down of the speed and intensity of the decline. The market has a strong intrinsic rebound demand. Thus, for long-term traders, we are in a phase of “the bear market is not over, but perhaps the darkest hour has passed.”
2. Combined Analysis of News Events
This time, the integration of news with technical analysis can be described as “perfect.”
First, AI narratives (such as “Cathie Wood refutes the AI apocalypse theory,” “Elon Musk x AI cooperating with the Pentagon”) served as the “igniter” for this rebound. These news significantly boosted market confidence in technological innovation and directly stimulated the performance of risk assets. The violent bullish candlestick on our 15-minute chart is a direct response to this optimistic sentiment.
Secondly, the market performance itself has become news. Statements like “Bitcoin strongly recovered, breaking through 66,000, soaring 3% in 15 minutes,” and “4-hour liquidations of 1.06 billion dollars, shorts suffered heavy losses” confirm the strength of the technical perspective and create a “price rise—short squeeze—accelerated rise” positive feedback loop, commonly referred to as a squeeze trend.
However, we cannot only look at the positives. We also need to observe potential risk signals: “Institutions greatly reduced holdings of Bitcoin ETF in Q4” and Vitalik’s ETH liquidation, which indicates that “smart money” or early participants are divided at this position; they could become a suppressive force during the rebound process. Additionally, the tightening regulations (Supreme Court, Trump Act) and macroeconomic hawkishness (high interest rates) continually hang over the market like the sword of Damocles, determining the altitude and sustainability of the rebound.
3. Comprehensive Judgment and Trading Recommendations
Alright, combining technical analysis and news events, let’s “diagnose” the market and develop corresponding trading strategies.
Short-term (15 minutes): In the pullback phase.
Support: 64000-64500 area, this is the dividing line of short-term strength and weakness.
Resistance: 66000-66300, the previous high resistance point.
Strategy: Short-term traders need to be patient. If the price retraces to the 64000-64500 area and shows signs of stabilization (like minor bottom divergences or low volume doji candles), they can consider lightly entering long positions with targets at previous highs. Avoid blindly chasing shorts while the pullback hasn’t stabilized, as the medium-term trend is bullish, and one could easily get squeezed by a sudden surge.
Medium-term (1 hour/4 hours): In the rebound trend.
Support: From a 1-hour perspective, look for 64500-65000; core support on the 4-hour level is in the 63500-64000 range.
Resistance: The medium-term target is 67000-68000, which corresponds to the previous significant trading volume area.
Strategy: A golden opportunity for medium-term traders. If the 15-minute pullback can stabilize above 64500 or even 64000, and the MACD on the 1-hour/4-hour maintains an upward trend, this presents a great opportunity for positioning long positions on dips. A stop loss can be set below the key 4-hour support at 63000, with a target approaching 67000-68000. Remember, a pullback is not a decline, it’s an opportunity to get on board.
Long-term (1 day): In the stabilizing bottom phase.
Support: 62000-63000, this is the “Maginot Line” of the bull market, which must not fail.
Resistance: MA on the daily level (65900-67800) is the first hurdle, a true reversal needs to stabilize above 70000.
Strategy: For long-term investors, the major trend has not completely reversed, but it’s a zone for gradual positioning. If the price can retrace to the 62000-63000 area and gain support, it will be an excellent point for increasing positions or establishing new ones. If positions are already held, as long as 62000 holds, one can patiently hold and observe the market's bottoming process.
Summary of Trading Thoughts:
For the short term, wait for stabilization on pullbacks to go long; for the medium term, buy on dips; and for the long term, position gradually. Do not change your conviction due to one bullish candlestick, nor panic because of one bearish candlestick. What we need to do is find that “high probability” node within our own trading cycle and then strike decisively.
The Qinglan Crypto Classroom is starting! BTC from four cycles + dual perspectives on news events, taking you to step accurately in the coin circle rhythm.
More quantitative disassemblies of the impact of real-time news on market sentiment have been updated in my Qinglan Crypto Classroom: www.qinglan.org
Qinglan's Trading Maxim:
The market never lacks opportunities; what it lacks is a clear mind during pullbacks and the courage to pull the trigger when the momentum kicks in. Stick to your system; the bigger the storm, the more valuable the fish.
I am Qinglan, see you in the next class.
免责声明:本文章仅代表作者个人观点,不代表本平台的立场和观点。本文章仅供信息分享,不构成对任何人的任何投资建议。用户与作者之间的任何争议,与本平台无关。如网页中刊载的文章或图片涉及侵权,请提供相关的权利证明和身份证明发送邮件到support@aicoin.com,本平台相关工作人员将会进行核查。


