XRP enters the weekend quoted below $1.45, and the weekly Bollinger Bands are beginning to open up while the price leans against the lower boundary at $1.32, as visible on the TradingView chart. That combination does not guarantee a breakdown, but it does show pressure building at a critical level. Considering that it is a weekly time frame, this kind of structure rarely resolves with a minor move.
XRP’s bearish grip: Why the 20-week MA remains "unclimbable wall"
The bigger issue is context as the 20-week average, which forms the center of the Bollinger Bands, is sitting near $2 and still pointing lower. Since XRP topped above $3 in late 2025, every rally has failed beneath that line.
That is what keeps the generally "bearish" structure in play: lower highs, lower closes and no sustained reclamation of trend support at the 20-week MA.
HOT Stories Crypto Market Review: Shiba Inu Price Momentum Returns In New Uptrend, Is Ethereum (ETH) Stuck in the Mud? Bitcoin Isn't Giving Up on $70,000 Ripple Secures Major Partnership With Deutsche Bank, XRP Price Breaks Key Support, Binance’s CZ Reveals His Role In UAE’s Bitcoin Mining Milestone — Crypto News Digest
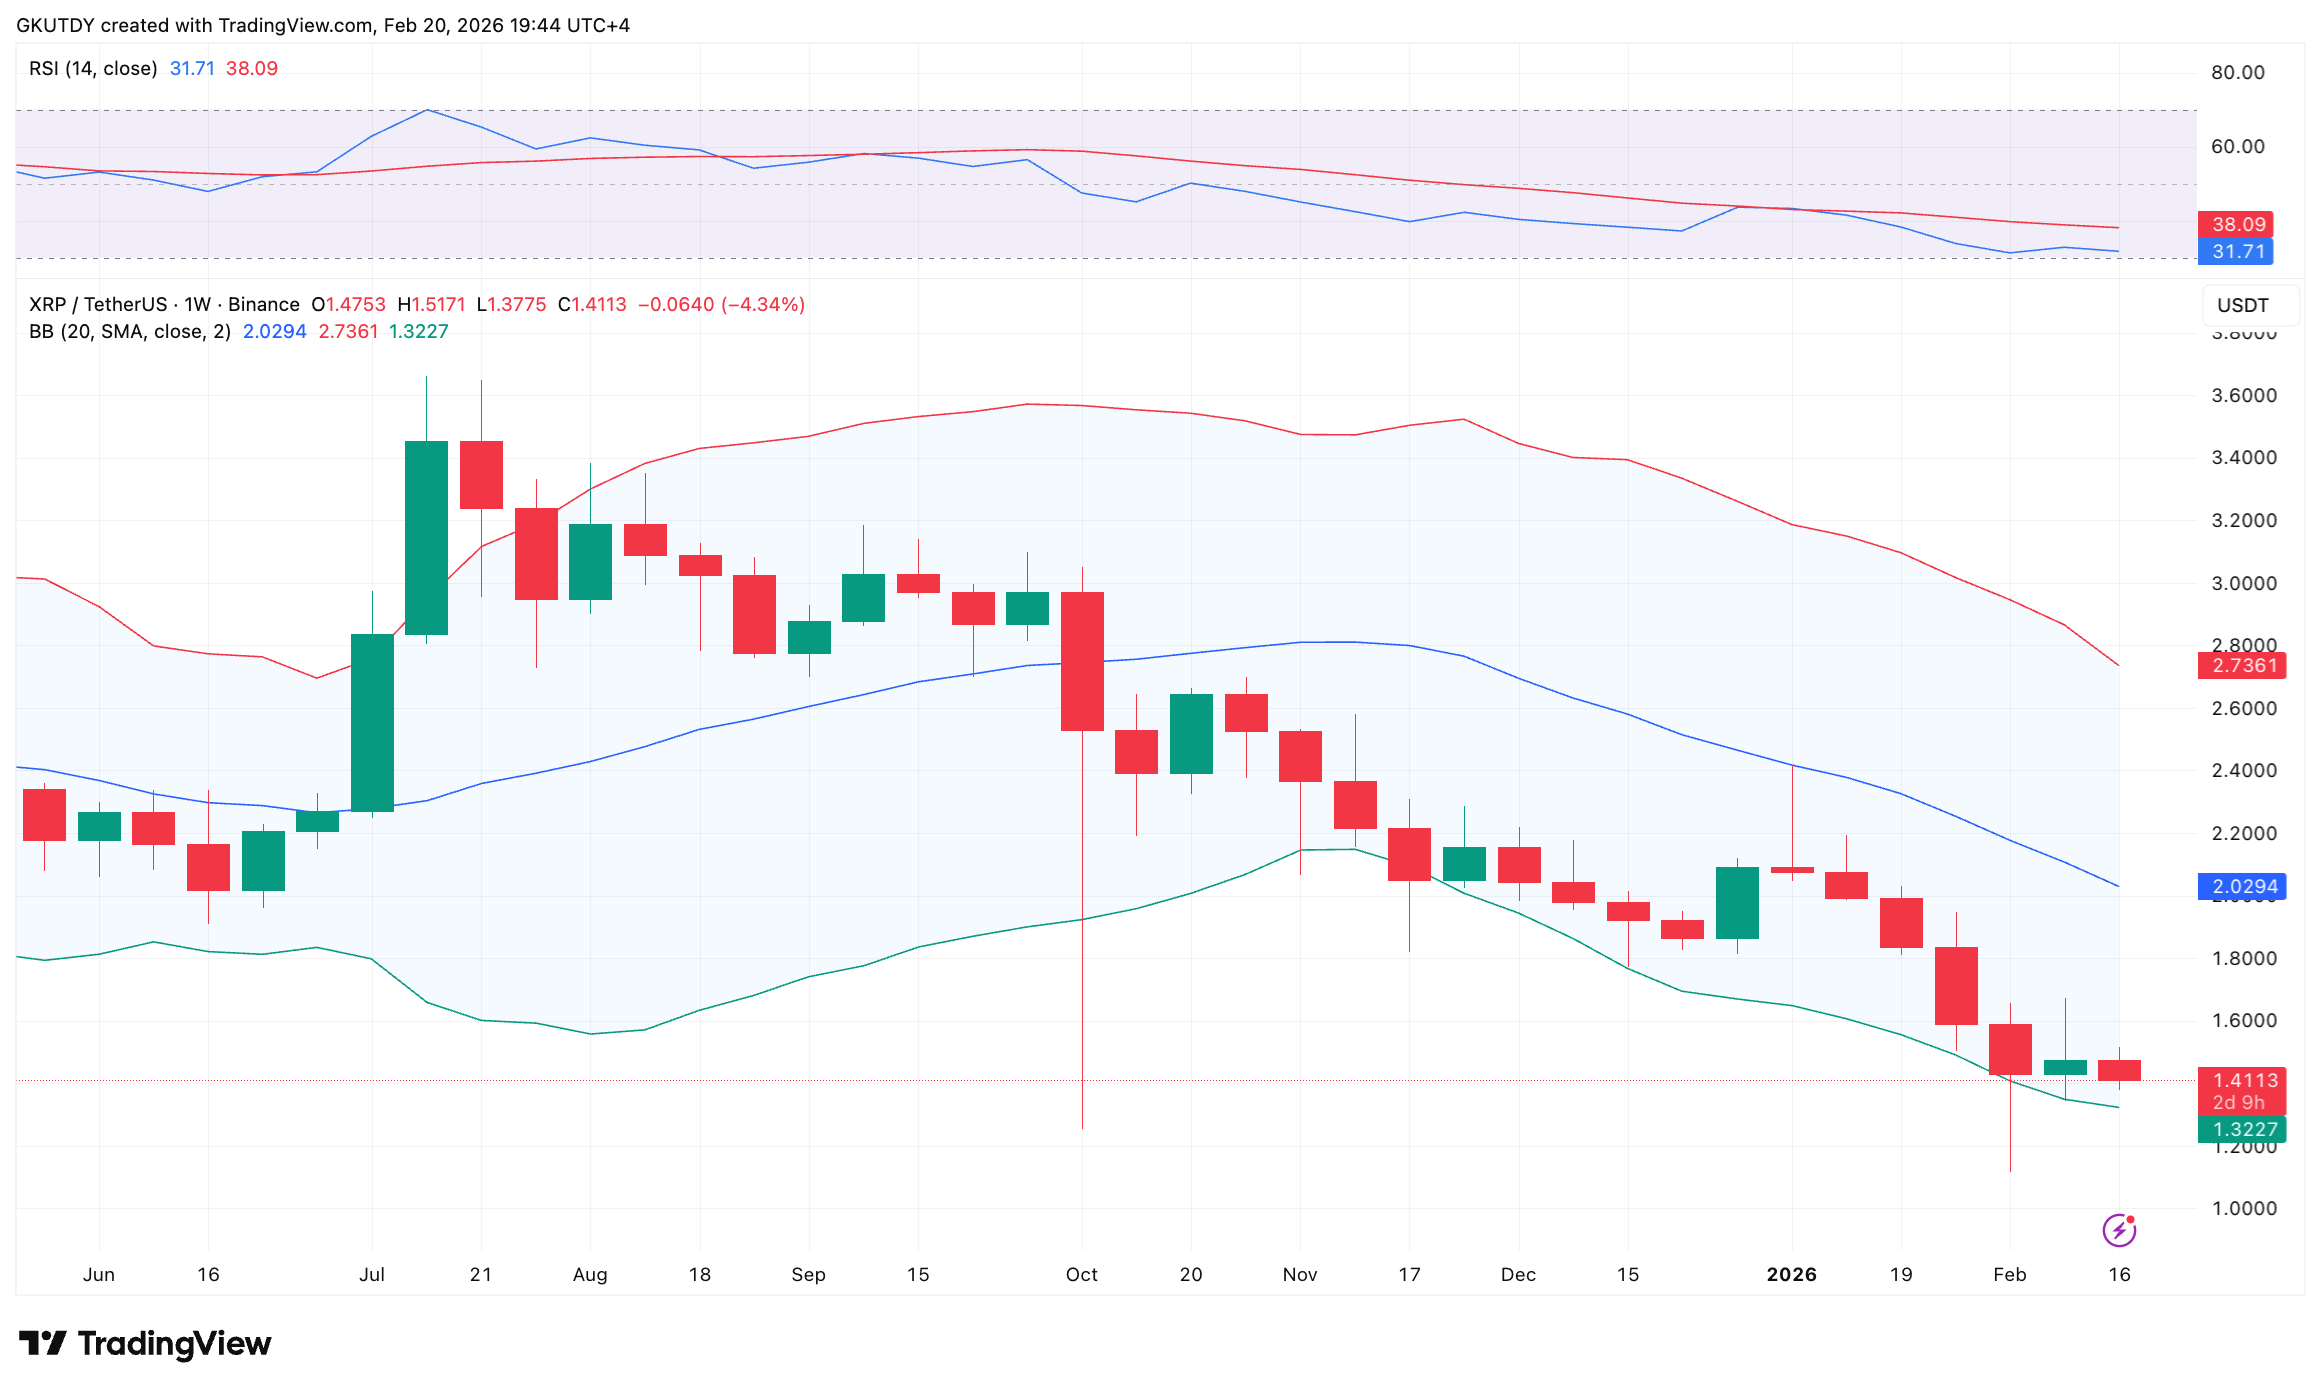
XRP/USD with Bollinger Bands by TradingView
The current setup is even more uncomfortable because of how the price is behaving at the lower band. Instead of bouncing aggressively after tagging it, the XRP price is printing smaller weekly candles close to the floor around $1.30. That suggests sellers are not exhausted, but the supply is still meeting demand at each attempt to stabilize.
You Might Also Like

Fri, 02/20/2026 - 13:20 Ripple Exec Reveals Launch of Tokenized Properties Trading on XRP LedgerByCaroline Amosun
Historically, when XRP has “walked” the lower band on a weekly chart, the next decisive move has not been small. Either buyers step in with conviction and force a reclaim of the midband, or the market extends lower before any real base forms.
This is where the $1.274 price point, 10% below, comes to light, as it is where the lower Bollinger Band on a daily chart is stretching at the time of writing.
免责声明:本文章仅代表作者个人观点,不代表本平台的立场和观点。本文章仅供信息分享,不构成对任何人的任何投资建议。用户与作者之间的任何争议,与本平台无关。如网页中刊载的文章或图片涉及侵权,请提供相关的权利证明和身份证明发送邮件到support@aicoin.com,本平台相关工作人员将会进行核查。


