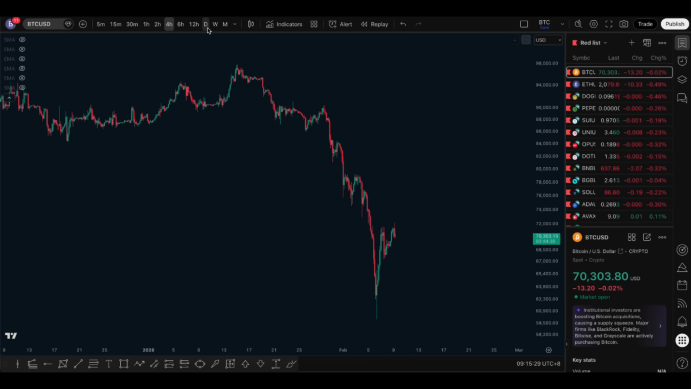
The current round of the long-term downtrend is not yet complete. Last week, the market experienced a significant decline, breaking below the important psychological level of 60,000.
Over the weekend, after consolidating at a high level, the market saw a rebound of over 10,000 points.
However, it is important to emphasize that this rebound does not indicate a trend reversal.
I. Core Viewpoint: This stage is not suitable for chasing highs to go long
In terms of short-term operations, my conclusion is very clear:
This position is not suitable for chasing highs to go long.
Although the current rebound appears to be strong, it is not appropriate to chase long positions at high levels after the rebound. Even if the market continues to rise afterward, this bullish trend is not part of my trading plan, and I do not recommend participation.
At this stage, only short opportunities at high levels should be considered.
II. Why can't we chase long positions at high levels?
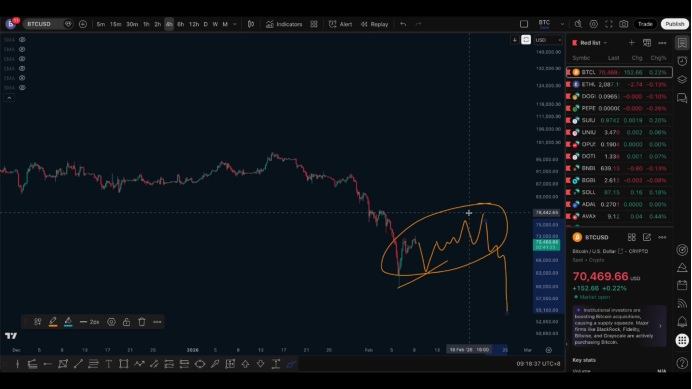
The reason is that this V-shaped rebound from the bottom is almost impossible to directly reverse the trend.
During the continuation of a strong bearish trend in the long term, a V-shaped rebound from a temporary low or bottom usually does not constitute a true bottom, nor does it signal a trend reversal.
It is highly likely that a new round of decline will follow.
There are two possible scenarios:
The first: Forming a higher temporary low, entering a consolidation or oscillation period.
The second: The previous low is effectively broken, and the bearish trend continues.
Regardless of which scenario occurs, neither supports chasing long positions at the current high levels.
III. From a historical structure perspective: After a V rebound, most still break lower
From a daily chart perspective, during previous adjustments, the market often breaks below the previous low after a V rebound at the bottom, and only then can conditions for reversal or bottoming be established.
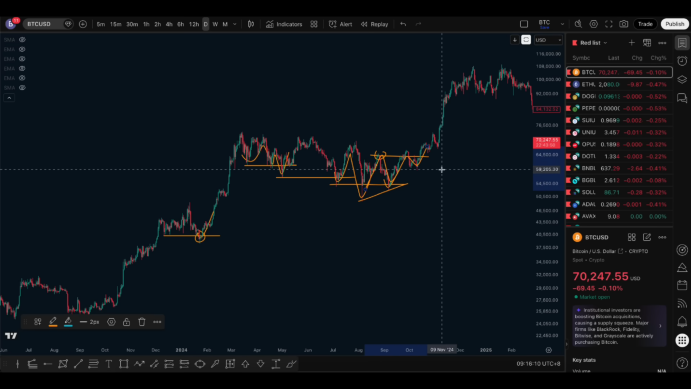
Only after breaking below the low and then recovering can the market have a real possibility of bottoming.
The current structure is similar to many historical adjustments—
It is also a V-shaped rebound from the bottom, and it is highly likely that it will still need to test the previous low.
IV. Regarding the two main expectations for the future
Next, we will mainly focus on two paths:
The first expectation
If in the new round of decline, the price breaks below the previous low and then shows a recovery action, there is a possibility of forming a temporary bottom between 60,000 and 50,000. It cannot be ruled out that this position could become the final bottom, but it cannot be confirmed at this time.
The second expectation
If the new round of decline does not break below the previous low but instead forms a higher swing low, then the market may enter a period of oscillating upward adjustment. However, this upward oscillation leans more towards a medium-term adjustment, and there still exists the possibility of a new round of decline afterward, which may be even stronger.
V. Rational expectations for rebound space
From historical experience, in the last bear market, the rebound magnitude was generally around 30%, with probabilities of exceeding 40% or even 50% being very low.
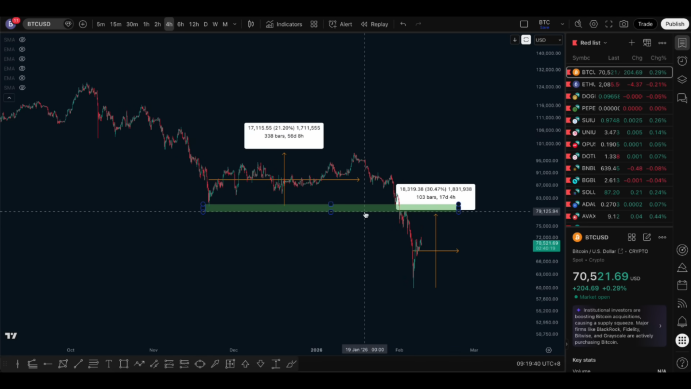
If a trend experiences a 50% retracement, it essentially constitutes a trend reversal.
Therefore, I personally believe that a 30% rebound is a relatively reasonable and somewhat extreme range.
If calculated based on a 30% retracement, the price would likely fall around 78,000, which coincidentally is the testing range of an important previous level, aligning with the logic of support and resistance switching at the daily chart level.
VI. Short-term trading thoughts: Only consider high-level shorts
The trading thought process at this stage is very clear:
Do not chase highs to go long.
Even if it rises another 3,000 or 4,000 points, do not participate.
Focus on short opportunities after a structure forms at high levels.
There are two ways to participate in shorts:
Left-side plan
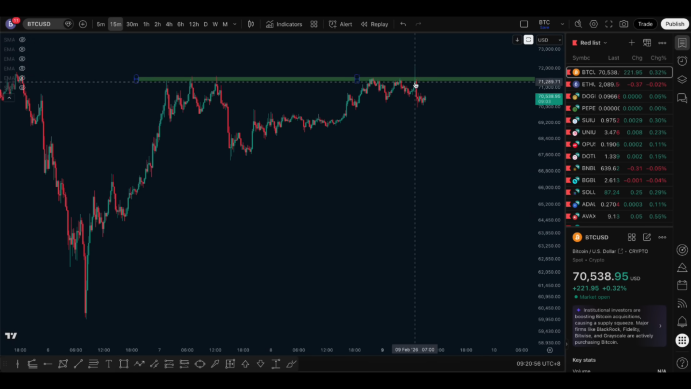
Focus on the 71,500 to 72,000 area. This is a key resistance level that has been tested multiple times previously, with 72,000 seen as a defensive point, attempting to short at high levels.
Right-side plan
Wait for a clear topping structure to appear on the hourly chart, and after a new downward trend emerges, wait for a rebound to participate in shorts, which is relatively more stable.
VII. Summary
Overall, the current market is still in a long-term bearish structure,
and this rebound resembles an adjustment after a decline rather than a trend reversal.
In terms of operations, focus on shorting at high levels, patiently waiting for structural confirmation,
and not chasing long positions at high levels is the most important discipline at this stage.
Follow me, join the community, and let's progress together.

免责声明:本文章仅代表作者个人观点,不代表本平台的立场和观点。本文章仅供信息分享,不构成对任何人的任何投资建议。用户与作者之间的任何争议,与本平台无关。如网页中刊载的文章或图片涉及侵权,请提供相关的权利证明和身份证明发送邮件到support@aicoin.com,本平台相关工作人员将会进行核查。


