Ethereum #Bitcoin #Ethereum Real-time Analysis #Bitcoin Real-time Analysis
Hello everyone, I am Lao Lü. The last article was essentially a correction, overturning the pinned article. Overall, our prediction was not wrong; the price has bottomed out after a rapid decline! So far, it looks very successful. Recently, there have been many conspiracy theories questioning why the price just happened to drop to exactly $60,000 before starting to rise. They believe the market is being manipulated too obviously. However, they forget one thing: no matter how skilled the manipulators are, it ultimately depends on technical analysis, as there have been many cases in history where retail investors have outsmarted the manipulators! It is fundamentally a contest of capital, so the idea of market manipulation is unfounded. There is also no malicious human intervention. Earlier, we predicted that the major bottom for Bitcoin would be $73,333 and for Ethereum, it would be $2,110. Both of these levels had decent rebounds, but the strength was very different and not strong at all, and the patterns were also incorrect. Therefore, in the last article, we decisively overturned the validity of these two support levels. On the morning of February 5th, around 8 AM, we warned about the risks early on. If you were fortunate enough to see it, congratulations, this bloodbath has little to do with you. If you didn’t pay attention to Lao Lü in time, that’s okay; there will be many opportunities ahead. Today, we will mainly analyze two questions: First, can we bottom fish now? Second, should we go long or short first?
For Bitcoin, we accurately predicted the cyclical major bottom at $60,000. Some people say, "Lao Lü, you are just guessing." If guessing could win, I might as well buy the lottery and not sit by the computer. There is a significant technical point here: a dual retracement test at the daily and weekly levels. We need to look back to May and June of last year when the price reached two peaks of $111,987 and $110,649. Connecting these two peaks gives us the level that the daily chart needs to retest for confirmation. On October 10th of last year, after a sharp drop to $101,482, there was a strong rebound, confirming the daily level bottom with a rise of $15,000. This indicates that at the daily level, it tends to follow this trend line for a retest confirmation. Continuing with this technical analysis, we push forward to 2024, confirming the high points: $73,856 and $72,021.7, which connect to form a massive daily level trend line resistance. On November 5th, 2024, a breakout will occur, and the subsequent decline at the daily level must retest this trend line. The timing is just right, as on February 6th, at 8 AM, it perfectly retested this trend line, which is exactly what we wrote in the title of the last article: the last support level for the daily bulls: $60,000. If you don’t understand what Lao Lü is talking about, I will explain it to you with graphical positions. Technical analysis is not about blind guessing. Just as we said about Ethereum's major bottom at $1,750, although the technical trends are different, there are still points that can be analyzed. Don’t worry; I will teach you this technical aspect in the Ethereum analysis below.
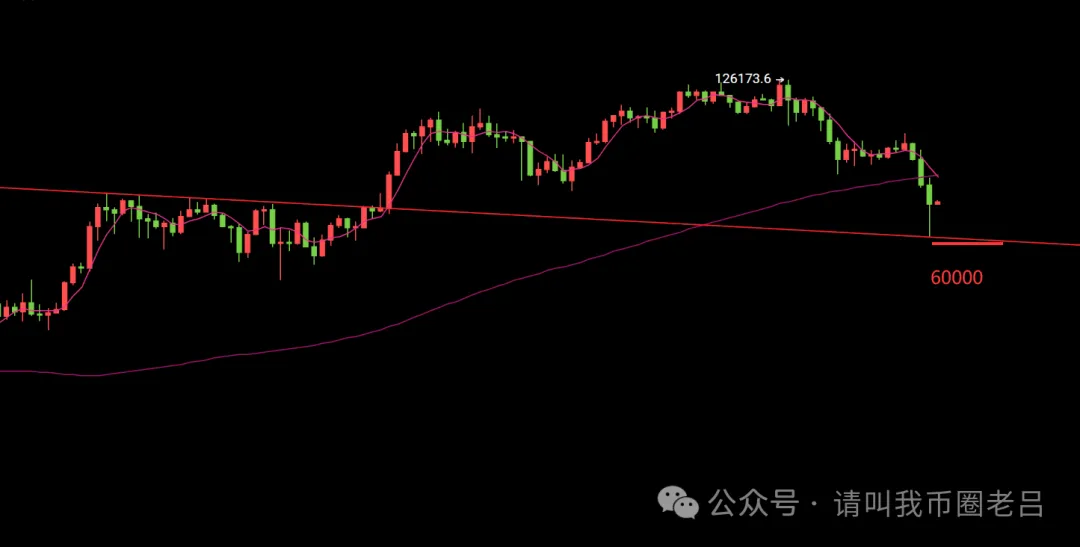
Bitcoin has bottomed at $60,000, and the rebound strength is quite good, over $12,000. This strength is already enough to stop the decline, and the bullish pattern has emerged. But why is it growing slowly? Because the entire market is afraid! Let me give you an example: one day, you were beaten up by your dad, and you were hurt all over. When you want to bounce back to life, doesn’t it take some time for your injuries to heal? Later, when your injuries are almost healed and you want to jump around again, your dad yells at you, and you have to behave for a few more days, even though he didn’t hit you this time. The time cycle is the next test. In the short term, we will stick to the strong watershed at 0.318, focusing mainly on long positions, with short positions as a slight supplement. The strong bullish position is at $67,500; this level must not be broken. If the price wants to continue rising, it must hold this strong position. Once the hourly level breaks below this strong position, the only place to go long will be at $62,555. So, remember these two key positions: $67,500 and $62,555. Regardless of what operation we perform, we must first clarify the risks. If you don’t even know the risk points, how can you control the market direction? The operation itself is about planning the illusion of market trends in advance; if it breaks, just exit and wait for a lower position. What does it mean to risk a little for a lot? It’s not about holding a position until it explodes, nor is it about competing with price trends, because those who were adamant about the bulls at the $100,000 mark can now only stand on the rooftop. Trading is a practice, and practice is about honing one’s character. If you still don’t understand the value of this statement, then in the next 10 or 20 years, the value of this statement will continue to rise.
Go long on Bitcoin near $67,555. If the hourly line rapidly breaks below, just hold your position and continue to wait for $62,555.
For Ethereum, before the big drop, we perfectly predicted the bottom support level at $1,750, mainly based on two technical points: one is that a large amount of buying at the daily level previously entered at this position. The other is the historical starting point of a significant bullish candle at the weekly level. This was explained in the previous article, and the specific analysis is in there, so I won’t repeat it here. Using this chapter on Ethereum, we address the first question: Has the price bottomed? Can we bottom fish? If I say the price will drop to $1,066, would you still dare to bottom fish? So, my answer has already been given; the long-term bottom fishing position has been provided. Of course, some may ask: "Lao Lü, I want to short first to see $1,066, and then bottom fish." That’s also fine; I appreciate your greed. But don’t rush; we will publish an article in advance when the price approaches the top, explaining where the top is and how to bottom fish, all in one go. This article will continue to be our new pinned article.
Currently, Ethereum's lowest point is $1,740. I believe it will not break new lows throughout February but will mainly continue to rebound. Retail investors are also human. They can’t be harvested like this. They also need to rise. Here, I want to share a trading technique for continuously going long. First, open the hourly chart for both cryptocurrencies. For Bitcoin, with a bottom at $59,909, look for the high point above. The first high point is $71,700, and the 0.382 retracement of this segment is at $67,320, where a significant rebound occurs. Still using $59,909 as the starting point, the current highest point is $72,276, and the 0.382 support below is at $67,555. This will be the new long position. However, if the price does not follow this technical point and continues to make new highs, reaching $73,000 or $74,000, still follow this plan, using $59,909 as the starting point and connecting to higher points to find 0.382. The new 0.382 will be the entry point for going long. Currently, I believe there is still at least $7,000 of upward space; the bulls just need to enter and exit. This segment on 0.382 technical teaching, if you understand it, congratulations, you are at least a beginner trader. If you completely don’t understand, congratulations, you have successfully enrolled.
Currently, Ethereum's high point is $2,151. According to this plan, the watershed position, which is 0.382, the entry price for going long is in the range of $1,995 to $2,000. The thought process is consistent with Bitcoin. If a large bearish candle breaks below $1,990, exit the long position manually. Don’t be stubborn; continue to wait for the next entry price for going long: $1,828. Under this daily level support of $1,750, we still focus on going long. We will consider all situations regarding price trends, regardless of how the market moves; we will be adept. Strategic planning is what manipulators fear the most.
Go long on Ethereum near $1,995. If the hourly line rapidly breaks below, just hold your position and continue to wait for $1,828.
Today: Written by Lao Lü on February 9, 2026, at 1:54 PM. Note that all strategies are effective once and cannot be reused! Check the text version and specific entry prices in the lower right corner of the image or video.
免责声明:本文章仅代表作者个人观点,不代表本平台的立场和观点。本文章仅供信息分享,不构成对任何人的任何投资建议。用户与作者之间的任何争议,与本平台无关。如网页中刊载的文章或图片涉及侵权,请提供相关的权利证明和身份证明发送邮件到support@aicoin.com,本平台相关工作人员将会进行核查。