One Hour Level Bitcoin Market Analysis
1. Trend Structure
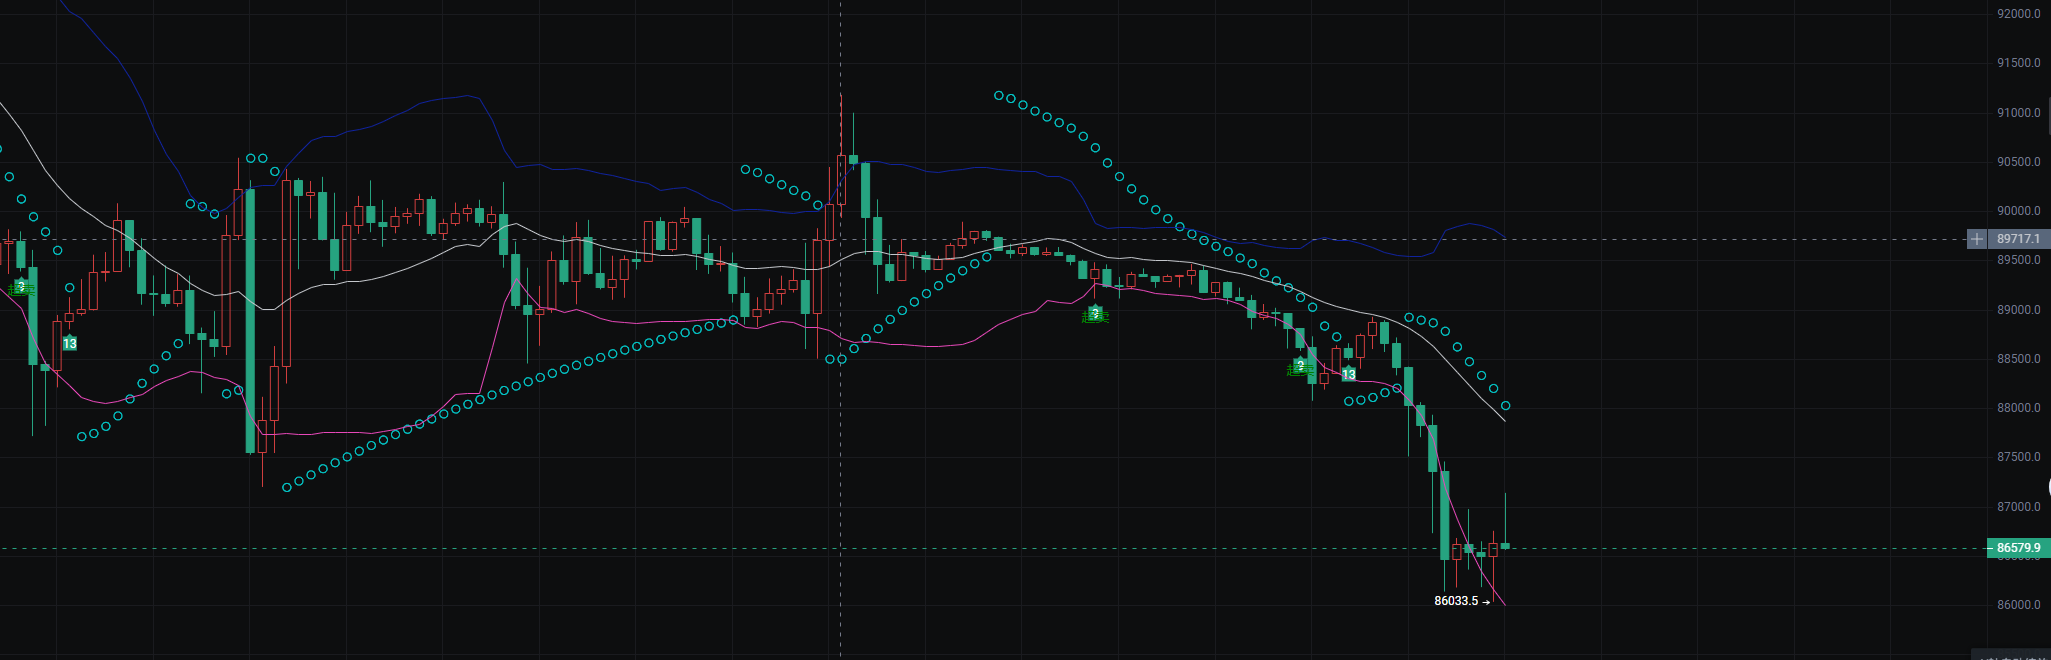
This is a trend from high-level consolidation to a breakdown and decline. Previously, the price oscillated in the 8900-9100 range, with a temporary balance between bulls and bears.
Subsequently, a series of large bearish candles appeared, causing the price to break through the lower edge of the consolidation range directly, entering a rapid decline phase, with the low probing down to 86033.5, where bearish forces dominate the market.
2. Key Indicators and Signals
Bollinger Bands: The price has fallen below the lower Bollinger Band, entering the oversold area, indicating that the short-term downward momentum has been excessively released, creating a demand for a technical rebound.
Moving Average System: Short-term moving averages (white, pink) are all turning downwards simultaneously, with the price operating below all moving averages, confirming the current bearish trend.
Stabilization Signal: A small bullish candle appeared after the low of 86033.5, which is a preliminary stop-loss signal, but further K-line confirmation is needed to determine if an effective rebound can form.
3. Support and Resistance
Support Level: 86033.5 is the current clear short-term low, with 86000 below being an important psychological support level.
Resistance Level: 87000 above is the first resistance level, while 89000 (the lower edge of the previous consolidation platform) is a stronger resistance area, where the price is likely to encounter resistance and retreat upon rebounding to these levels.
4. Subsequent Inference
If the rebound continues: An effective breakthrough of 87000 and stabilization above the short-term moving averages is needed to have a chance to challenge the 89000 resistance area.
If the decline continues: If the 86000 support is broken, the price may probe further down, and caution is needed regarding the continuation of the bearish trend.
One Hour Level Ethereum Market Analysis
1. Trend Structure
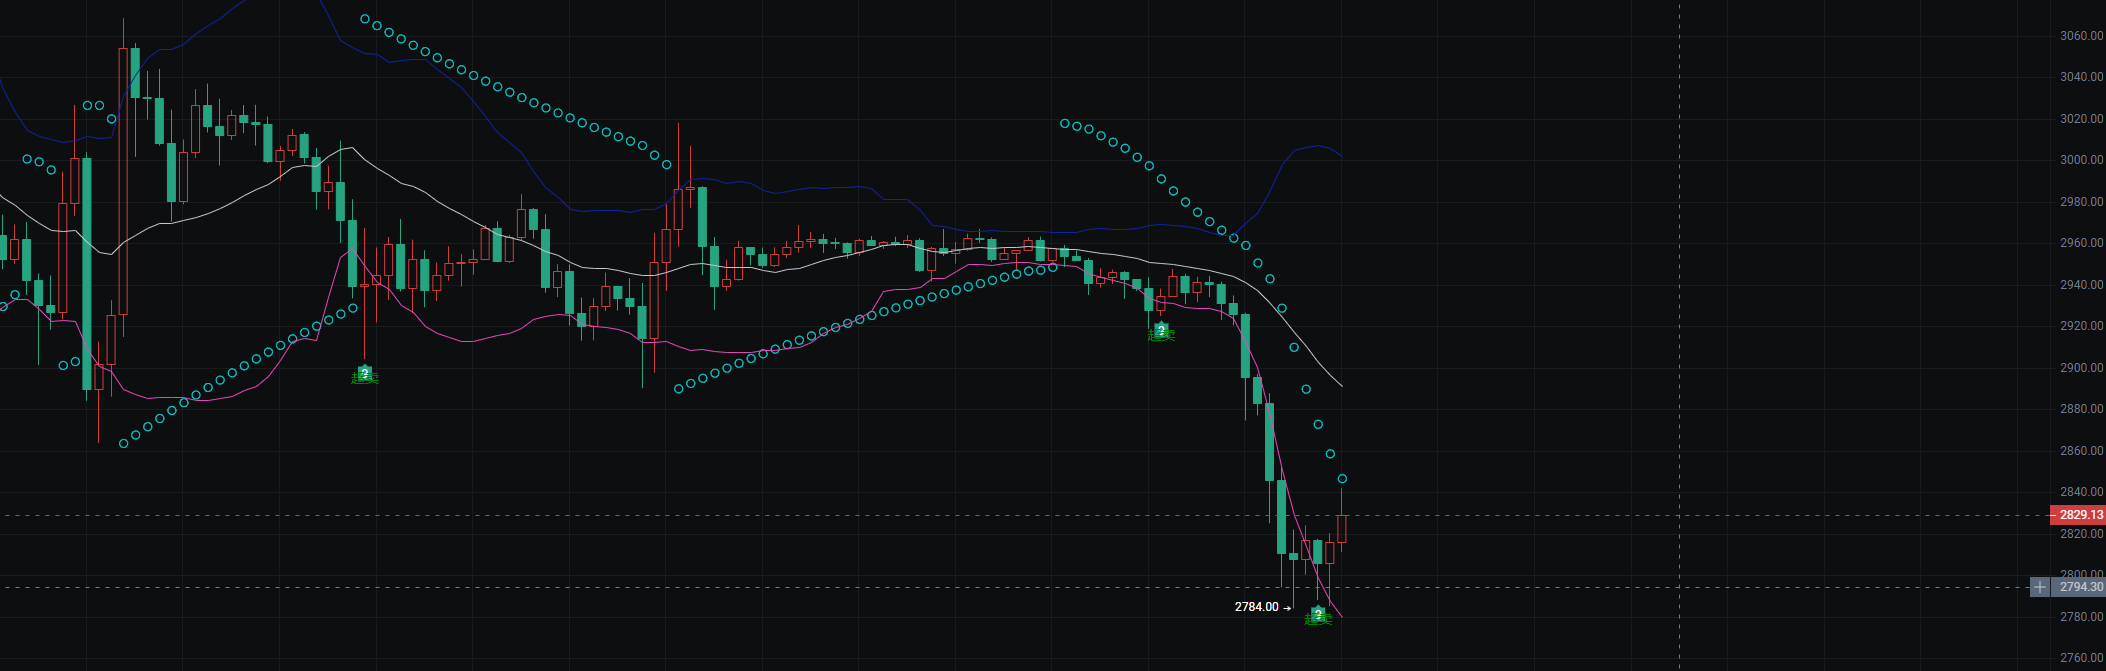
This is a trend from high-level consolidation to a breakdown and decline. Previously, the price oscillated in the 8900-9100 range, with a temporary balance between bulls and bears.
Subsequently, a series of large bearish candles appeared, causing the price to break through the lower edge of the consolidation range directly, entering a rapid decline phase, with the low probing down to 86033.5, where bearish forces dominate the market.
2. Key Indicators and Signals
Bollinger Bands: The price has fallen below the lower Bollinger Band, entering the oversold area, indicating that the short-term downward momentum has been excessively released, creating a demand for a technical rebound.
Moving Average System: Short-term moving averages (white, pink) are all turning downwards simultaneously, with the price operating below all moving averages, confirming the current bearish trend.
Stabilization Signal: A small bullish candle appeared after the low of 86033.5, which is a preliminary stop-loss signal, but further K-line confirmation is needed to determine if an effective rebound can form.
3. Support and Resistance
Support Level: 86033.5 is the current clear short-term low, with 86000 below being an important psychological support level.
Resistance Level: 87000 above is the first resistance level, while 89000 (the lower edge of the previous consolidation platform) is a stronger resistance area, where the price is likely to encounter resistance and retreat upon rebounding to these levels.
4. Subsequent Inference
If the rebound continues: An effective breakthrough of 87000 and stabilization above the short-term moving averages is needed to have a chance to challenge the 89000 resistance area.
If the decline continues: If the 86000 support is broken, the price may probe further down, and caution is needed regarding the continuation of the bearish trend.
Daily irregular internal channel shares more real-time trading strategies. If you have no direction in long-term operations or have been losing for a long time, contact the teacher in the Telegram channel—Bitcoin Bear https://t.me/BTDX9045
免责声明:本文章仅代表作者个人观点,不代表本平台的立场和观点。本文章仅供信息分享,不构成对任何人的任何投资建议。用户与作者之间的任何争议,与本平台无关。如网页中刊载的文章或图片涉及侵权,请提供相关的权利证明和身份证明发送邮件到support@aicoin.com,本平台相关工作人员将会进行核查。