1. 比特币整体趋势
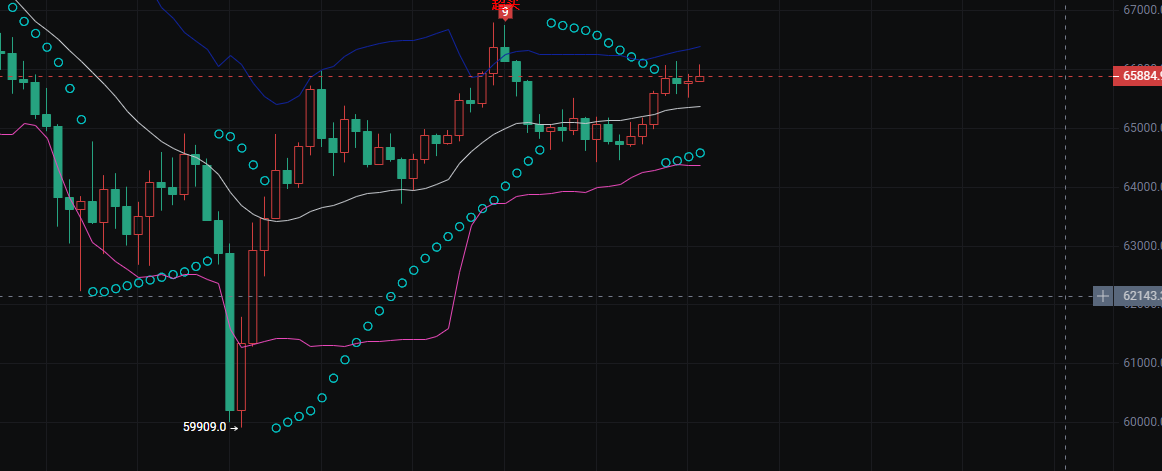
这是一段触底反弹后进入震荡整理的走势。
价格从最低点 59909.0 开始快速拉升,脱离了下跌趋势。
目前在 65000~66500 的区间内横盘震荡,多空力量暂时平衡。
2. 关键指标解读
布林带指标:
价格当前在布林带中轨(白色线)和上轨(蓝色线)之间运行,说明短期处于偏强区间。
布林带开口在前期反弹后有所收窄,意味着当前市场波动率下降,进入整理阶段。
支撑与阻力:
下方支撑:布林带中轨(约 65000 附近)和前期震荡低点,是短期关键支撑位。
上方阻力:前期反弹高点(约 66500 附近)和布林带上轨,是近期的压力位。
K 线形态:
最近的 K 线呈现小阴小阳交替,没有明确的方向突破信号。
这种形态通常是市场在选择方向前的蓄势阶段。
3. 后续走势推演
向上突破:如果价格能站稳 66500 上方,并带量突破前期高点,大概率会开启新一轮上涨,目标可看向上轨的延伸位置。
向下回落:如果跌破中轨支撑(65000),则可能回踩下方的趋势支撑线(粉色线),需要关注支撑强度。
震荡延续:在突破前,价格大概率会继续在当前区间内运行,可依托支撑和阻力做高抛低吸。
🔹 上方阻力区(66500~66700)
这是前期反弹的高点,也是布林带上轨的压制位置。
如果价格带量突破并站稳在 66500 上方,可以顺势做多,第一目标看向 67000 附近。
若突破时量能不足,要警惕假突破,最好等回踩确认支撑后再进场。
🔹 核心震荡区(65800~66500)
目前价格正处于这个区间内反复整理。
靠近区间上沿(66500)时,可以轻仓试空;靠近区间下沿(65800)时,可以轻仓试多。
震荡阶段适合快进快出,不要重仓,一旦价格突破区间,要及时止损或止盈。
🔹 下方支撑区(65000~65200)
这是布林带中轨和前期震荡低点的双重支撑位置。
如果回调到这个区间并获得支撑,可以低吸做多,止损设置在 64800 下方更稳妥。
若有效跌破 65000,短期趋势可能转弱,需要先离场观望,等待下一个支撑位(粉色趋势线)的反馈。
1. 以太坊整体趋势
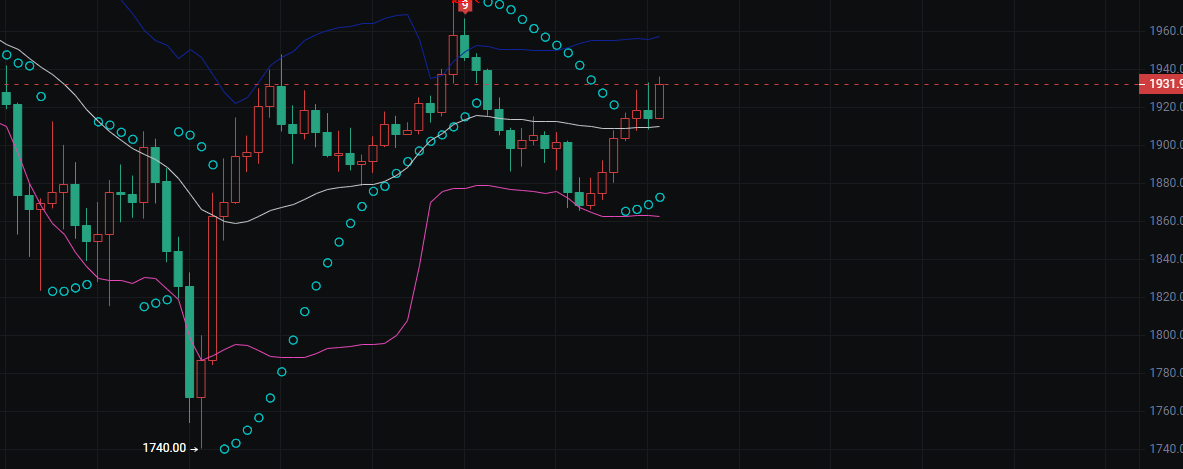
价格从最低点 1740.0 触底后,经历了一波快速反弹,随后进入高位震荡整理阶段。目前价格在 1880~1960 的区间内反复波动,多空力量暂时处于平衡状态。
2. 关键指标解读
布林带:价格目前在布林带中轨(白色线)附近运行,上轨(蓝色线)在 1960 附近形成压力,下轨(粉色线)在 1860 附近形成支撑。布林带开口收窄,表明市场波动率在下降。
支撑与阻力:
上方阻力:前期高点 1960 附近是强阻力位,同时也是布林带上轨的压制区域。
下方支撑:布林带中轨(约 1900)和前期震荡低点 1880 是关键支撑,再往下则是粉色趋势线(约 1860)。
K 线形态:近期 K 线呈现小阴小阳交替,且振幅收窄,这是典型的整理蓄势形态,说明市场在等待方向选择。
3. 后续走势推演
向上突破:若价格带量突破 1960 阻力位,大概率会打开新的上涨空间,可顺势做多,目标看向上轨延伸位置。
向下回落:若跌破 1900 支撑,可能回踩 1880 甚至 1860 的支撑位,若 1860 也失守,短期趋势可能转弱。
震荡延续:在方向明确前,价格大概率会继续在当前区间内运行,可依托支撑和阻力做高抛低吸,注意快进快出。
🔹 上方阻力区(1950~1960)
这是前期反弹的高点,也是布林带上轨的压制位置,是短期重要的多空分水岭。
如果价格带量突破并站稳 1960 上方,可以顺势做多,第一目标看向 1980~2000 区间。
若突破时量能不足,要警惕假突破,建议等待回踩确认支撑后再进场。
🔹 核心震荡区(1900~1950)
目前价格正处于这个区间内整理。
靠近区间上沿(1950)时,可以轻仓试空;靠近区间下沿(1900)时,可以轻仓试多。
震荡阶段适合快进快出,不要重仓,一旦价格突破区间,要及时止损或止盈。
🔹 下方支撑区(1860~1900)
1900 是布林带中轨支撑,1860 是粉色趋势线和前期低点的双重支撑,是短期重要的防守位置。
如果回调到 1900 附近获得支撑,可以低吸做多,止损设置在 1880 下方更稳妥。
若有效跌破 1860,短期趋势可能转弱,建议先离场观望,等待下一个支撑位的反馈。

注:📣 由于公开平台的信息时效性和深度有限,市场瞬息万变,关键拐点、精准操作策略、突发风险提示,等内容需在公众号第一时间同步。在这里,你能获得: 实时策略推送,深度分析支持、互动答疑,针对个人持仓提供风险预警和优化建议。 🚨 谨记:市场永远奖励行动更快、信息更准的人!做少数派的赢家。)
免责声明:本文章仅代表作者个人观点,不代表本平台的立场和观点。本文章仅供信息分享,不构成对任何人的任何投资建议。用户与作者之间的任何争议,与本平台无关。如网页中刊载的文章或图片涉及侵权,请提供相关的权利证明和身份证明发送邮件到support@aicoin.com,本平台相关工作人员将会进行核查。