Hourly chart of Bitcoin:
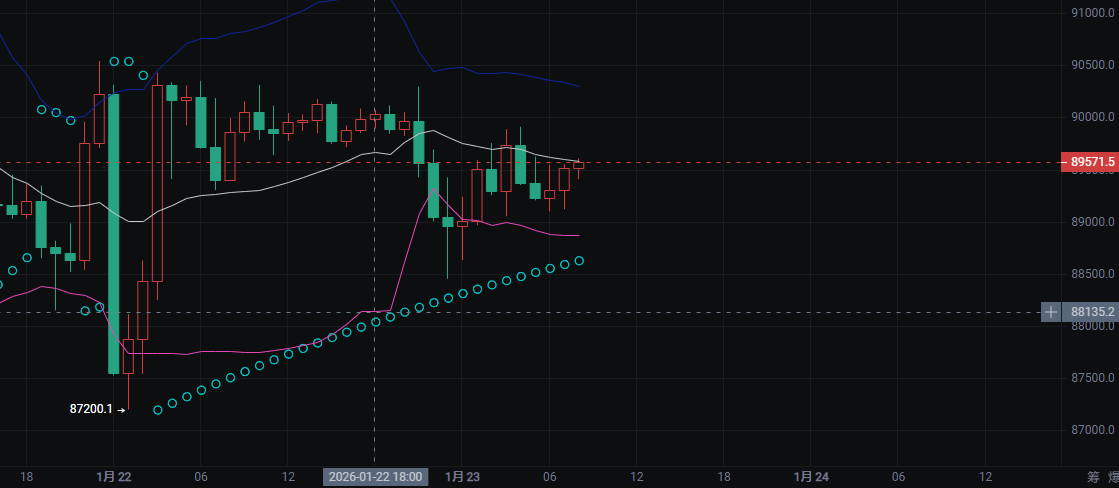
Price and Support/Resistance Current price: 89571.5, within the recent narrow fluctuation range (88000–91000). Key support: Recent low at 87200.1, with 88135.2 (dashed line in the chart) being an important support level that has been tested multiple times without effective breakdown. Key resistance: The upper level of 91000 is a clear pressure point, having encountered resistance and retraced multiple times in the past.
Indicator Signals Bollinger Bands (blue upper band, white middle band, lower band): The price is currently operating below the middle band of the Bollinger Bands, indicating a short-term bearish trend; the Bollinger Bands are overall flat, showing that the market is in a consolidation phase with no clear trend. Pink indicator line: After following the price rebound upward, it currently shows signs of turning downward, suggesting a weakening of bullish momentum. Blue dot indicator: Previously sustained upward, it is now showing signs of stagnation or turning, further confirming the decline of short-term bullish strength.
Market Rhythm and Sentiment From the sharp drop on January 22 (dipping to 87200) to the rebound, the market has gone through the process of "panic drop → bottom-fishing rebound → consolidation." The current price is being pulled back and forth between support and resistance, indicating a temporary balance of bullish and bearish forces, with the market at a critical point of directional choice.
Short-term Trend Projection Upward Breakout: If the price can stabilize above 90000 and effectively break through the 91000 resistance, it is expected to open up upward space and challenge previous highs. Downward Breakdown: If it breaks below the key support of 88000, it may retest 87200 or even lower positions, triggering a new round of selling pressure. Continued Fluctuation: Without a clear breakout, the most likely trend is to continue fluctuating within the 88000–91000 range, waiting for new news or capital-driven momentum.
Hourly chart of Ethereum:
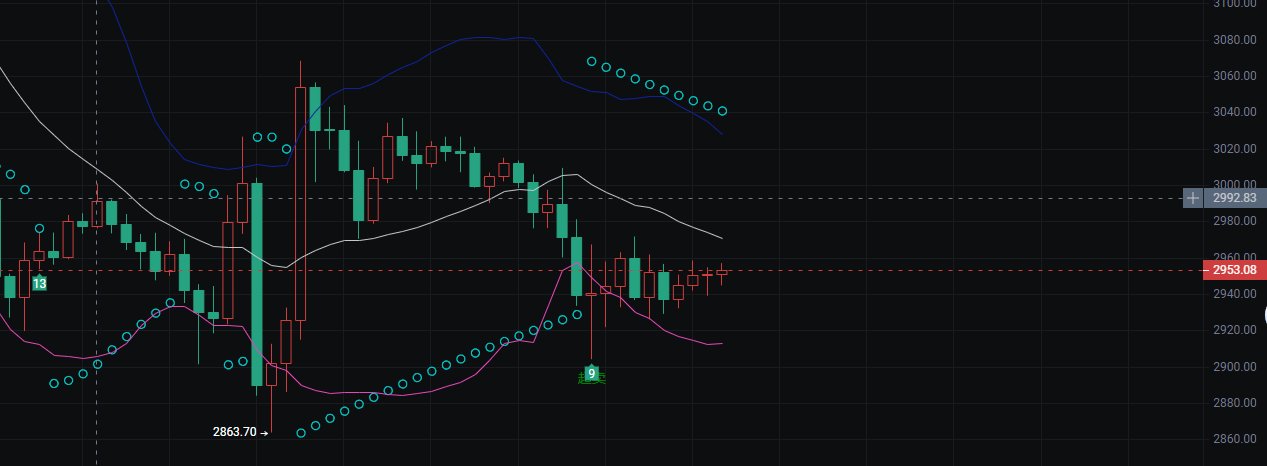
Price and Support/Resistance Current price: 2953.08, positioned in the lower-middle of the recent fluctuation range (2860–3080). Key support: Previous low at 2863.70, with the red dashed line in the chart (around 2950) being short-term support, and the white dashed line (2992.83) being a recent pressure point. Key resistance: The upper level of 3080 is a recent high and an important resistance level that needs to be effectively broken for further upward movement.
Indicator Signals Bollinger Bands (blue upper band, white middle band): The price is currently operating below the middle band of the Bollinger Bands, indicating a short-term bearish trend; the upper band is turning downward, and the middle band is also showing a downward trend, indicating overall weak momentum. Pink indicator line: After following the price rebound upward, it is now continuously turning downward, indicating that bullish momentum has clearly weakened, and bearish forces are dominating the short-term trend. Blue dot indicator: Previously rising with the price rebound, it is now also showing signs of turning downward, further confirming the decline of bullish strength.
Market Rhythm and Sentiment The market has gone through the process of "sharp drop to the bottom (2863.70) → rebound recovery → encountering resistance and retracing → consolidation." The current price is fluctuating around 2950, with both bulls and bears temporarily in a stalemate, but the overall focus is slowly shifting downward, indicating cautious market sentiment.
Short-term Trend Projection Downward Breakdown: If the price breaks below the 2950 support, it may retest the previous low of 2863.70 or even dip into lower ranges. Upward Rebound: If it can stabilize above 2992.83 and break through the 3000 round number, it is expected to challenge the 3080 resistance level. Continued Fluctuation: Without a clear breakout, it is most likely to continue fluctuating within the 2950–3000 range, waiting for new driving factors to break the balance.
Daily, we share more real-time trading strategies through internal channels at irregular times. If you have been operating without direction for a long time or have been in long-term losses, please contact the teacher in the Telegram channel—Big Bear https://t.me/BTDX9045
免责声明:本文章仅代表作者个人观点,不代表本平台的立场和观点。本文章仅供信息分享,不构成对任何人的任何投资建议。用户与作者之间的任何争议,与本平台无关。如网页中刊载的文章或图片涉及侵权,请提供相关的权利证明和身份证明发送邮件到support@aicoin.com,本平台相关工作人员将会进行核查。