Written by: ARK Invest
Translated by: Saoirse, Foresight News
Editor’s Note: This article is excerpted from the flagship report “Big Ideas 2026” published by ARK Invest, led by “Woodstock” Cathie Wood. The original text covers 13 core innovation trends including AI, blockchain, biotechnology, and space exploration. Due to the length of the content, this article will focus on translating the sections related to cryptocurrency and AI. The following is the translated content:
Accelerating Innovation: The Convergence of Technologies Opens a New Turning Point for Economic Growth
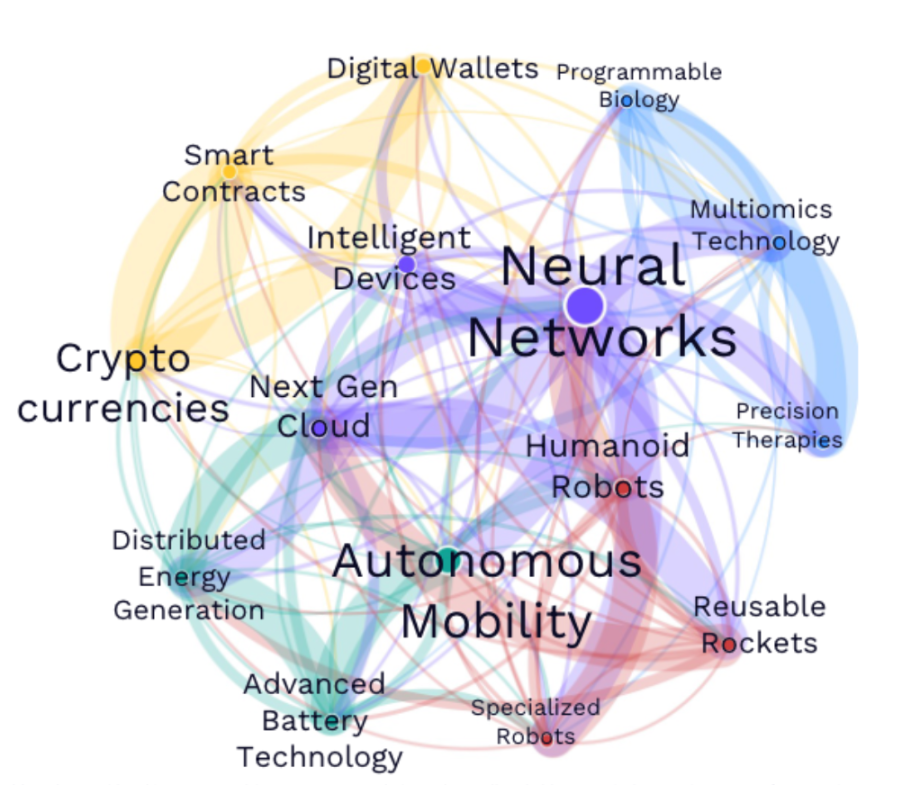
Illustration of the synergy among five major innovation platforms — presenting the inter-empowerment relationships of AI, blockchain, robotics, energy storage, and multi-omics in a network structure, with arrows indicating key interaction scenarios.
Currently, the five major innovation platforms of AI, blockchain, robotics, energy storage, and multi-omics are deeply interconnected, where breakthroughs in one area can empower others — for example, reusable rockets equipped with AI chips supporting the next generation of cloud computing, and multi-omics data in digital wallets accelerating the development of precision therapies. By 2025, the intensity of technological convergence is expected to grow by 35%, with AI as the core enabler, and the catalytic effects of robotics and reusable rockets becoming prominent, while energy storage and smart contracts also serve as key supports. Meanwhile, space computing is breaking through the bottleneck of terrestrial computing power (costs may decrease by 25%, and rocket demand may increase 60-fold), with investments in innovative fields nearing the peak share of GDP seen during the railroad era, making AI software, data centers, and space exploration the engines of growth.
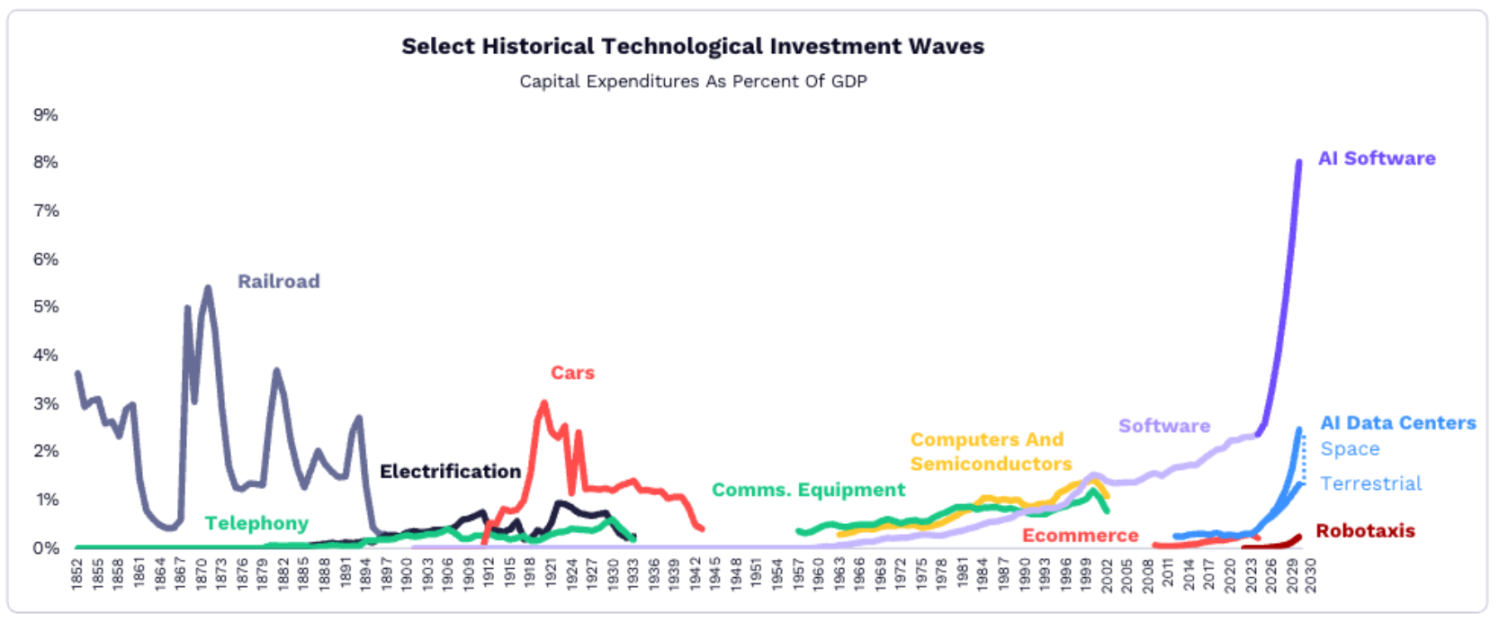
A comparison of the historical investment share of technological waves against GDP. The blue bar chart shows that the current innovation era accounts for 4.5%, nearing the peak of the railroad era (5%), surpassing the automotive and computing eras.
The following is an analysis of core innovation areas:
Artificial Intelligence: The Core Engine Reshaping All Industries
AI Infrastructure: Defining the Next Generation of Cloud Computing
- Explosive Demand: From December 2024 to January 2026, the AI computing demand of OpenRouter (an API platform integrating multiple large language models) is expected to grow 25-fold; the cost of inference (the cost of AI models processing data) has decreased by over 99% in the past year, driving widespread adoption of AI by businesses and consumers.
- Surge in Data Center Investment: By 2025, global investment in data center systems is projected to reach $500 billion, 2.5 times the average level from 2012 to 2023, and is expected to grow to $1.4 trillion by 2030, with a compound annual growth rate of 29%.
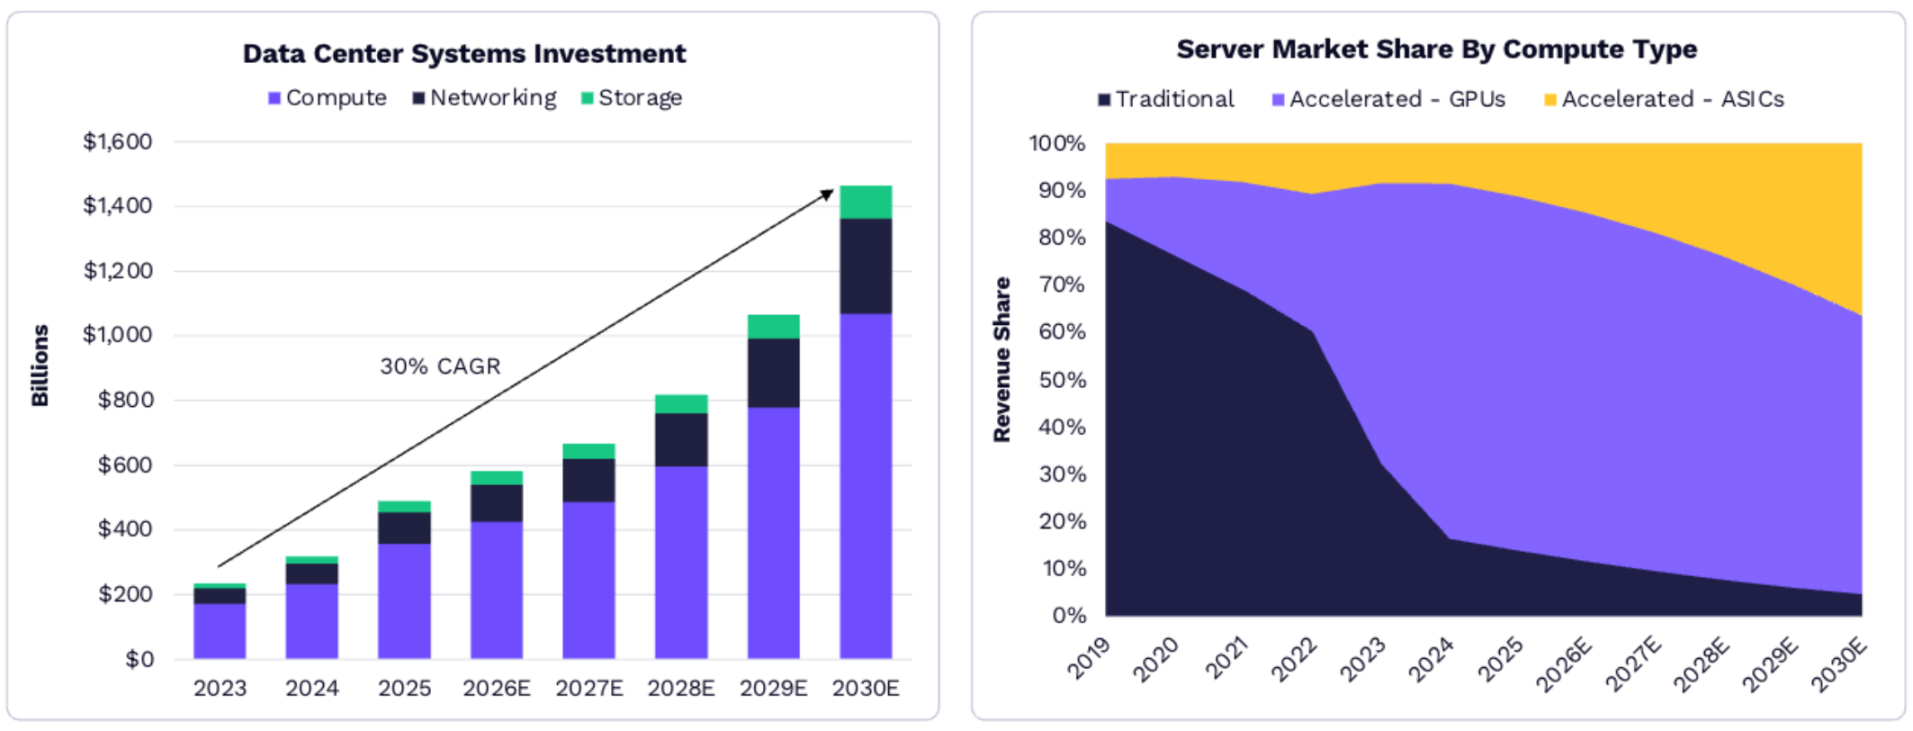
The left image shows the growth of global data center investment from 2025 to 2030; the right image shows the market share of servers categorized by computing type.
Changing Competitive Landscape: Nvidia holds 85% of the GPU market share due to its early investments in AI chip design, software, and networking, but competitors like AMD and Google are gradually catching up in areas such as small model inference; in the future, dedicated integrated circuits (ASICs) designed by companies like Broadcom and Amazon's Annapurna Labs are expected to capture more market share in cost-sensitive computing scenarios.
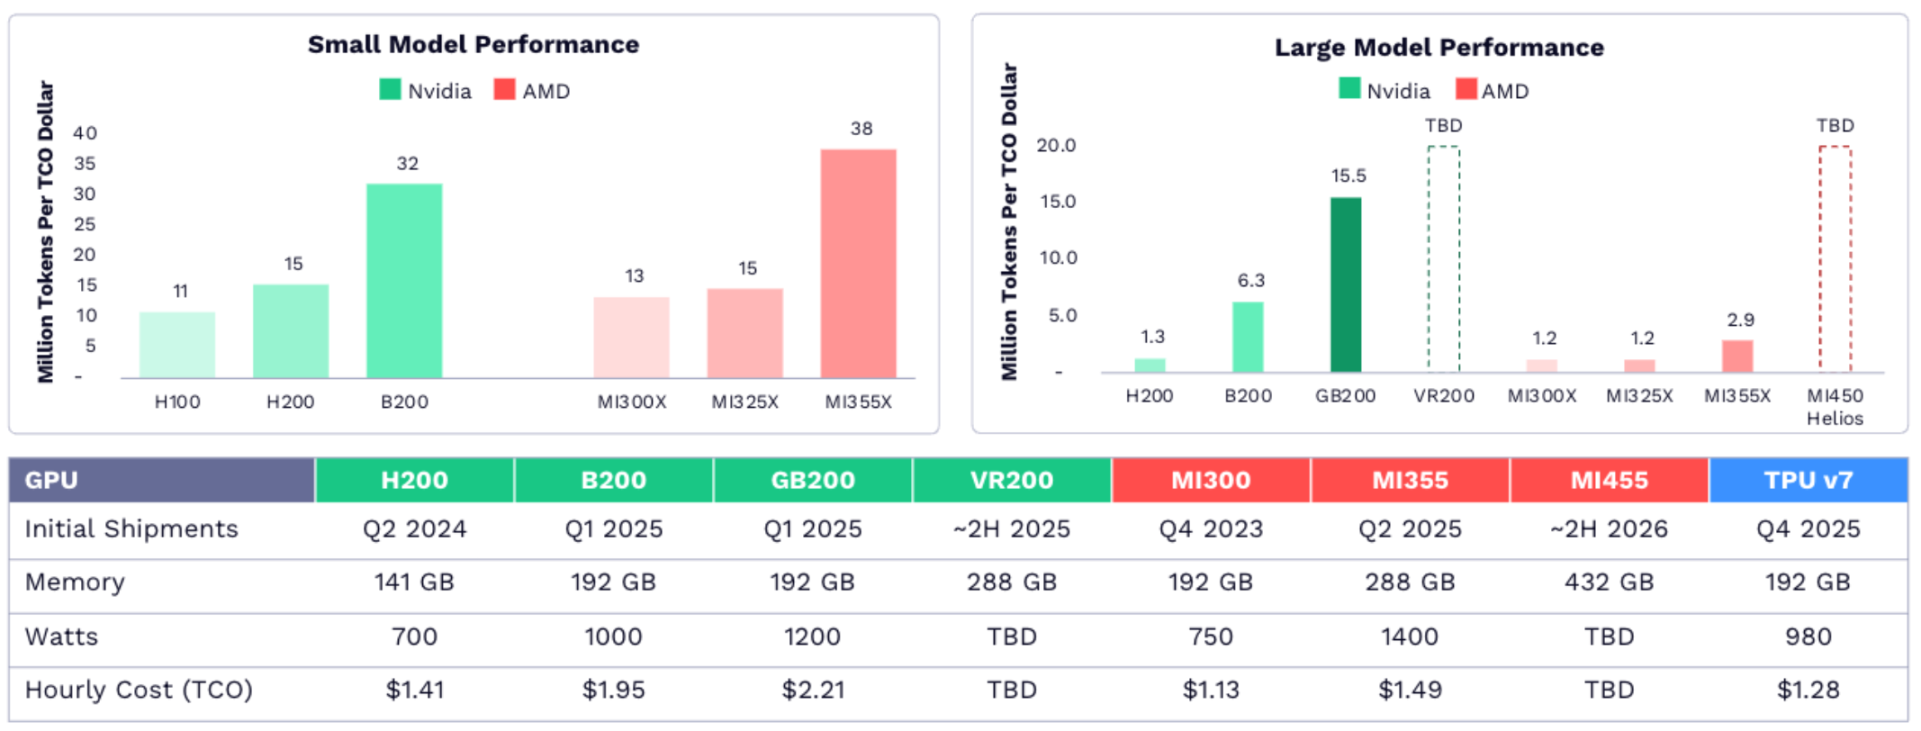
The market share of AI chips in 2025 — in the table, green represents Nvidia, red represents AMD, and blue represents Google.
AI Consumer Operating Systems: Transforming Business and Transactions
- Shift in User Interaction Paradigms: AI models are becoming the new underlying architecture of the internet, with increasing frequency of interactions between users and AI agents (rather than traditional applications), and the speed of AI adoption far exceeds that of the internet. For example, the penetration rate of AI chatbots among smartphone users is increasing faster than that of early internet among PC users.
- Leap in Transaction Efficiency: AI purchasing agents significantly compress the consumer decision-making process, reducing the time required for a purchase from about 1 hour in the pre-internet era to approximately 90 seconds in the AI era. Anthropic's open-source model context protocol (MCP) and OpenAI's agent commercial protocol (ACP) are driving AI to achieve seamless information retrieval and secure transactions.
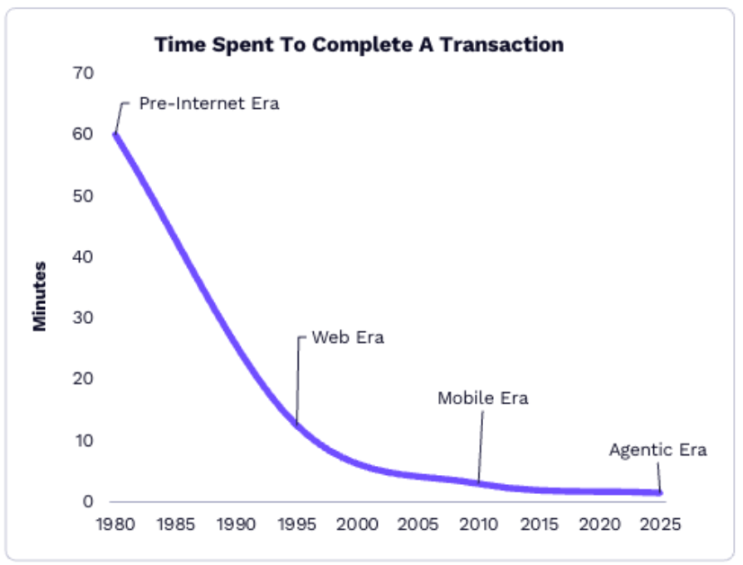
A comparison of decision-making durations across different eras — the timeline from left to right represents the pre-internet era (1980s), the Web era (2000s), the mobile era (2010s), and the AI era (2025), with durations marked as 60 minutes → 15 minutes → 5 minutes → 1.5 minutes.
Market Size Forecast: By 2030, online consumption facilitated by AI agents is expected to exceed $8 trillion, accounting for 25% of total global online consumption; the share of AI search traffic is projected to rise from 10% in 2025 to 65%, with related advertising spending growing at an annual rate of about 50%. It is estimated that by 2030, AI-mediated consumption-related revenue (advertising, lead generation, etc.) will reach $900 billion.
AI Productivity: Unlocking Economic Potential Value
- Continuous Upgrade of AI Capabilities: By 2025, the duration of tasks that AI agents can reliably complete will increase from 6 minutes to 31 minutes, with a 5-fold increase in efficiency; for example, American knowledge workers using ChatGPT can save 50 minutes daily, with a subscription payback period of only half a day.
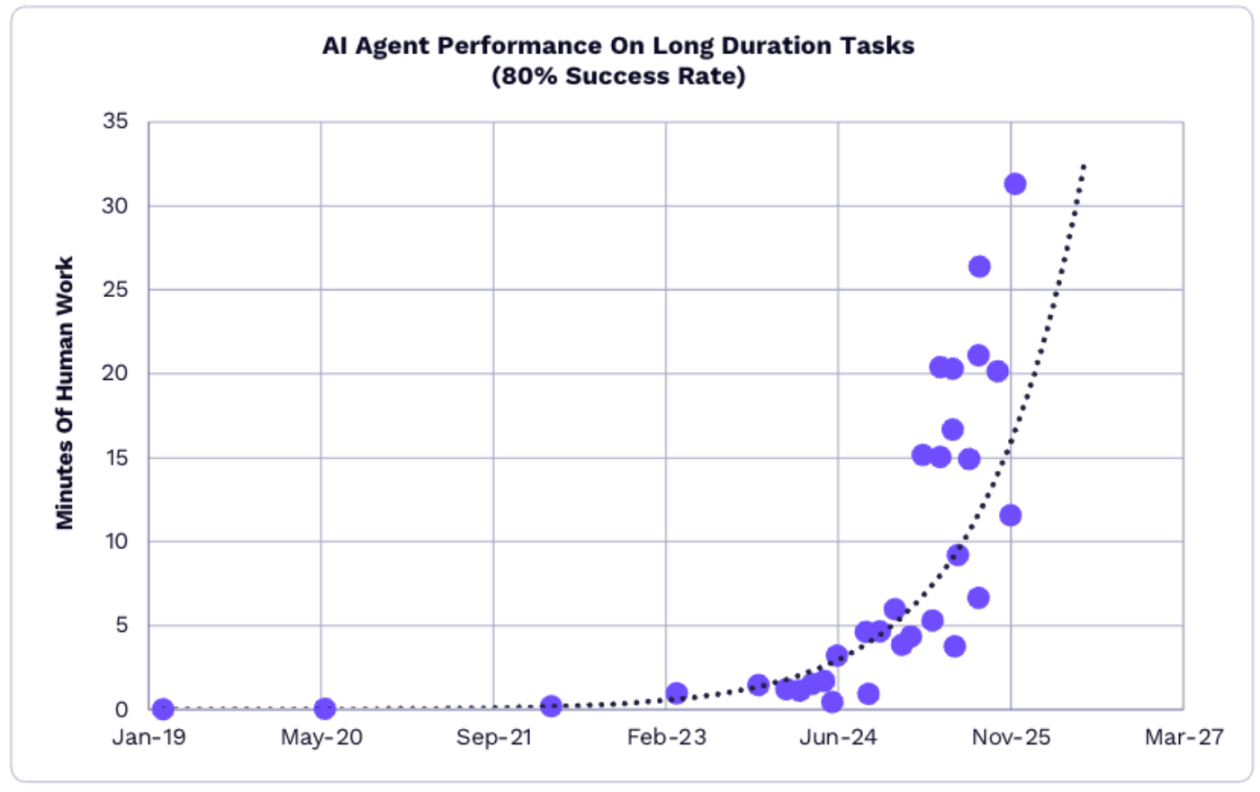
Growth in task duration for AI agents from 2024 to 2025.
- Exponential Decline in Costs: The costs of AI models are declining exponentially across multiple fields; from April to December 2025, the cost of AI models related to software development dropped from $3.5 per million tokens to $0.32, a decrease of 91%.
- Global Competition and Economic Impact: The U.S. leads China in AI model performance by about 6 months, but China has an advantage in the open-source model field (8 out of the top 10 open-source models globally). If businesses widely adopt AI to enhance knowledge worker efficiency, global software spending growth from 2025 to 2030 could rise from 14% over the past decade to 19%-56%, potentially unlocking $117 trillion in economic value in the long term.
Blockchain and Digital Assets: Restructuring Financial and Asset Systems
Bitcoin: Leading the Development of a New Asset Class
Bitcoin is Maturing, Becoming the Core of New Institutional Asset Classes
In 2025, Bitcoin prices are expected to show a volatile upward trend, with key events continuously driving its institutionalization process: the U.S. Securities and Exchange Commission (SEC) approving the listing standards for a general cryptocurrency exchange-traded fund (ETF), Morgan Stanley opening Bitcoin fund investment permissions to clients, Wisconsin pension funds incorporating Bitcoin into their portfolios, Texas launching a Bitcoin strategic reserve, Fidelity launching cryptocurrency individual retirement accounts (IRAs), and President Trump signing an executive order to establish a "strategic Bitcoin reserve" during his inauguration. Despite market fluctuations on October 10, which saw $19 billion in leveraged positions liquidated, Bitcoin has demonstrated stronger risk resilience overall.
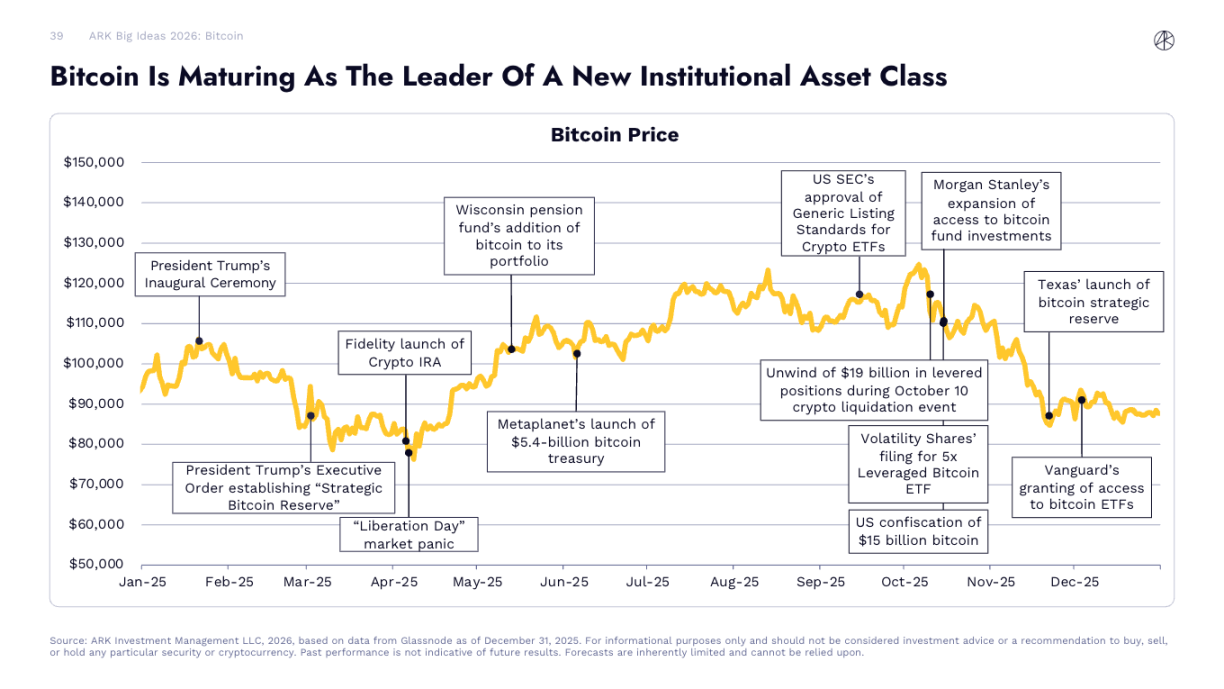
Bitcoin price trends from January to December 2025, marking key event nodes.
The Proportion of Bitcoin Held by U.S. ETFs and Public Companies Reaches 12%
In 2025, the holdings of Bitcoin ETFs in the U.S. increased from approximately 1.12 million coins by 19.7% to 1.29 million coins, while the Bitcoin holdings of public companies grew from approximately 598,000 coins by 73% to 1.09 million coins. As a result, the proportion of Bitcoin held by ETFs and public companies relative to the total circulating supply increased from 8.7% to 12%, indicating a deepening recognition of Bitcoin by institutional investors.
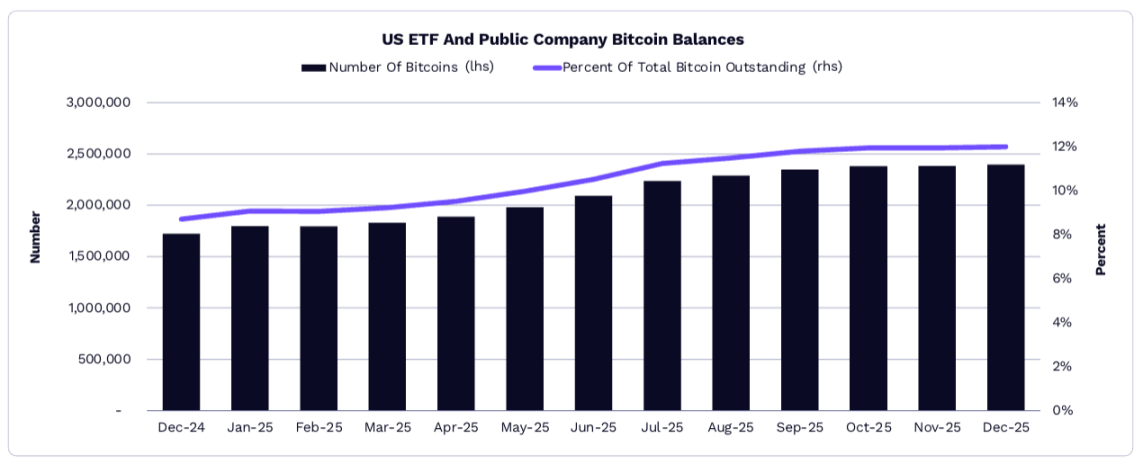
Changes in the Bitcoin holdings of U.S. ETFs and public companies from December 2024 to December 2025 and their proportion of total supply.
Bitcoin's Risk-Adjusted Returns Lead in the Long Term
In the long term, Bitcoin's annualized risk-adjusted returns (Sharpe ratio) have exceeded those of the overall cryptocurrency market. For most of 2025, Bitcoin's risk-adjusted returns surpassed those of ETH, SOL, and the other 9 constituent coins in the CoinDesk 10 index. Since the low point of this cycle in November 2022, early 2024, and early 2025, Bitcoin's annual average Sharpe ratio has also been higher than those of the aforementioned cryptocurrencies.
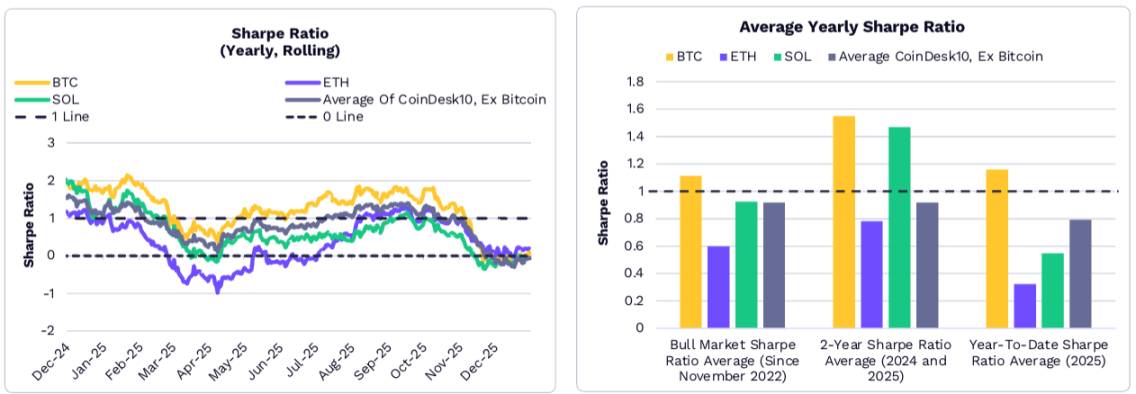
The left image shows the rolling annualized Sharpe ratios of Bitcoin and other cryptocurrencies from December 2024 to December 2025; the right image compares the annual average Sharpe ratios over different periods (2025, 2024-2025, and from November 2022 to present).
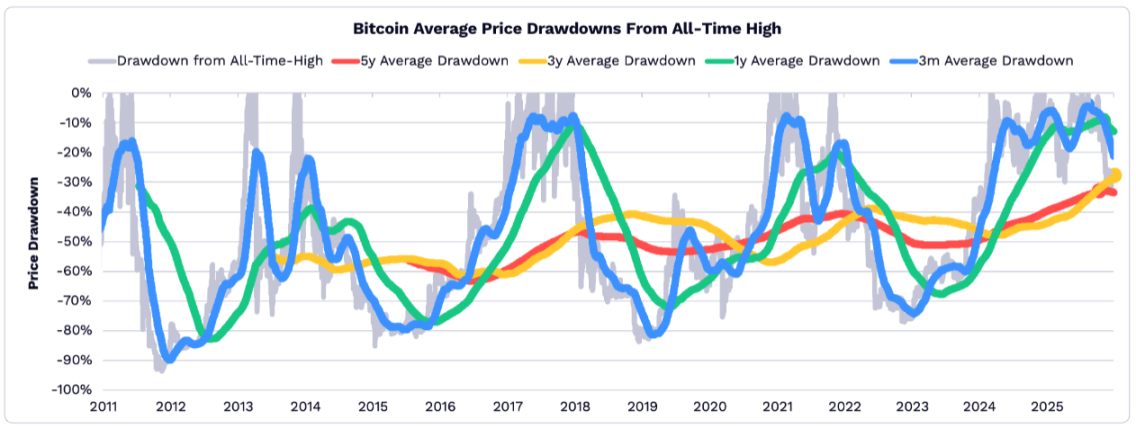
Bitcoin Price Retracement in 2025 Hits Historical Low
As the safe-haven asset properties of Bitcoin gradually strengthen, its volatility continues to decrease. In 2025, from the perspectives of 5 years, 3 years, 1 year, and 3 months, the average drawdown of Bitcoin prices relative to historical highs is lower than historical levels, making it the year with the shallowest drawdowns across all time dimensions in history.
Bitcoin 2030 Forecast: Adjusted Assumptions but Overall Stable Outlook
ARK's forecast for Bitcoin's market capitalization in 2030 remains stable overall, but two core assumptions have been adjusted:
- Total Addressable Market (TAM) for "Digital Gold": The market capitalization of gold is expected to soar by 64.5% in 2025, driving a 37% increase in the target market size for Bitcoin's "digital gold" positioning, rising from approximately $18 trillion to $24.4 trillion.
- Penetration Rate of "Emerging Market Safe-Haven Assets": Due to the faster-than-expected adoption of stablecoins in developing countries, the forecast penetration rate for Bitcoin in this scenario has decreased by 80%, from the original 0.5%-6% to 0.1%-1.3%.
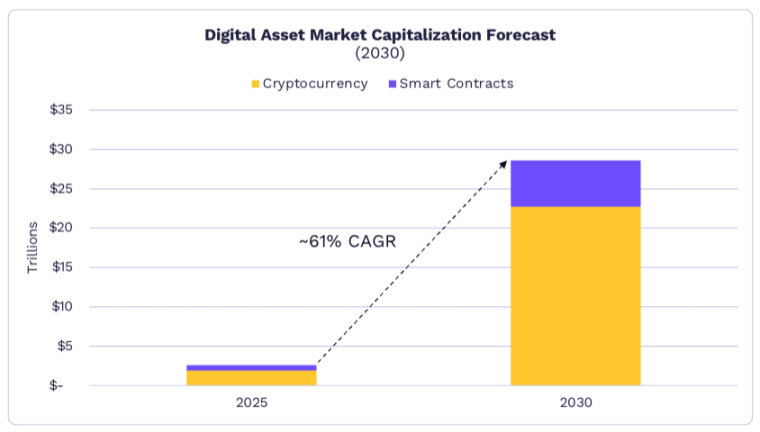
Even so, ARK still expects the global digital asset market size to reach $28 trillion by 2030, with Bitcoin likely to capture a 70% share, resulting in a market capitalization of approximately $16 trillion and a compound annual growth rate of about 63%.
Tokenized Assets: Driving Trillions of Dollars in Assets to the Blockchain
The GENIUS Act Accelerates Institutional Layouts
The introduction of the GENIUS Act provides a clear regulatory framework for stablecoins and asset tokenization, directly driving stablecoin trading activity to historic highs. Numerous companies and institutions have announced related initiatives: Circle, BitGo, Paxos, and Ripple have obtained conditional banking licenses; Stripe launched a Layer 1 blockchain focused on stablecoins called "Tempo" and applied for a national bank trust license; Tether-supported stablecoin Layer 1 blockchain "Plasma" went live; BlackRock disclosed plans for its self-developed tokenization platform; YouTube supports creators receiving payments via PayPal's PYUSD stablecoin; and JPMorgan launched JPM Coin on the Base blockchain, among others.
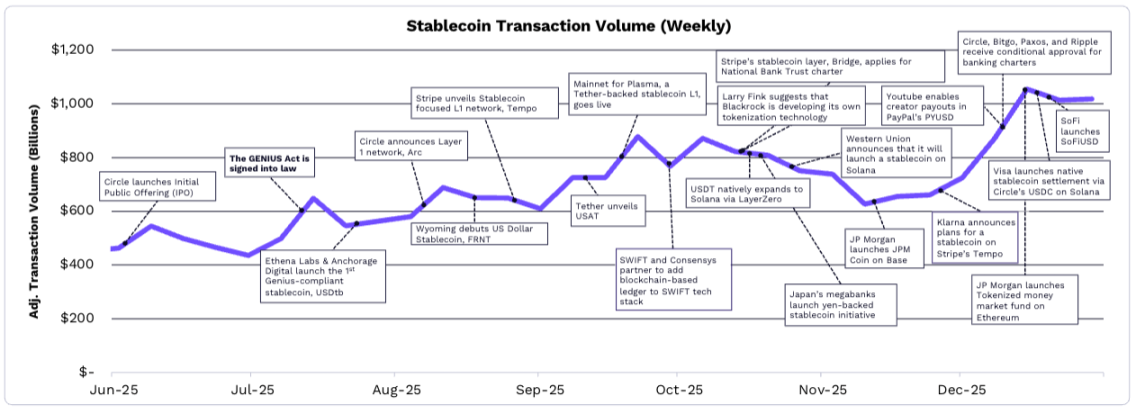
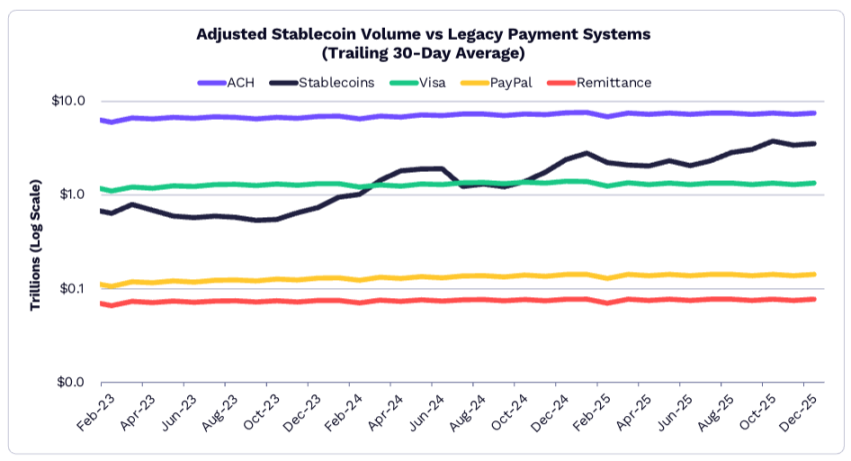
Weekly adjusted trading volume of stablecoins from June to December 2025 (excluding miner extractable value and exchange trading)
Stablecoin Trading Volume Far Exceeds Most Traditional Payment Systems
By December 2025, the 30-day average of adjusted trading volume for stablecoins reached $3.5 trillion, which is 2.3 times the combined volume of PayPal, remittance services, and Visa transactions. Among these, Circle's USDC accounted for approximately 60% of the adjusted trading share, while Tether's USDT accounted for about 35%. In 2025, the total supply of stablecoins grew by 50% from $210 billion to $307 billion, with USDT and USDC accounting for 61% and 25%, respectively; Sky Protocol is the only stablecoin besides the two with a market capitalization exceeding $1 billion, while PayPal's PYUSD saw its market cap grow over sixfold to $3.4 billion.
Tokenized Real-World Assets (RWA) Grew by 208% in 2025
Focusing on U.S. Treasury bonds and commodities, the global market capitalization of tokenized real-world assets (RWA) increased from $6.1 billion to $18.9 billion in 2025, marking a growth of 208%. Specifically:
- U.S. Treasury Bonds: The total tokenized scale reached $9 billion, with BlackRock's $1.7 billion BUIDL money market fund accounting for 20%.
- Commodities: Tether's XAUT (tokenized gold) and Paxos' PAXG (tokenized gold) reached market capitalizations of $1.8 billion and $1.6 billion, respectively, together accounting for 83% of the tokenized commodities market.
- Stocks: The scale of tokenized public stocks approached $750 million, gradually becoming a new growth point for asset tokenization.
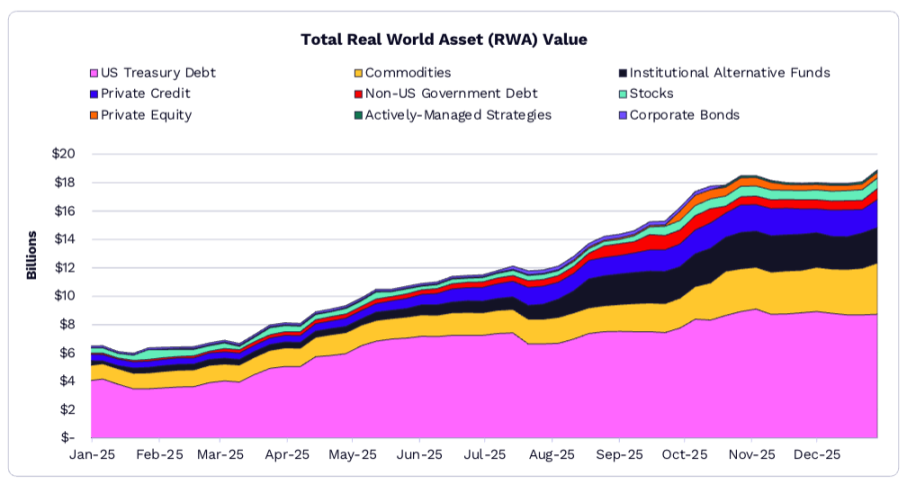
Changes in the market capitalization of various categories of tokenized real-world assets (RWA) from January to December 2025 (including U.S. Treasury bonds, commodities, private credit, etc.).
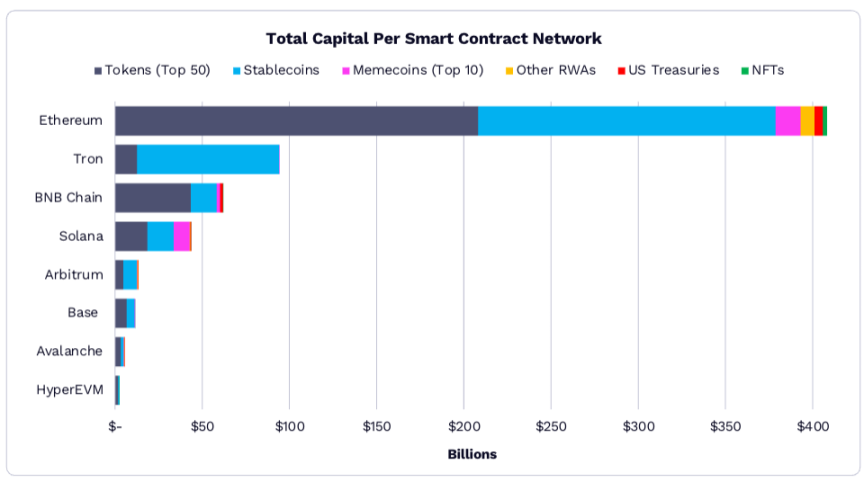
Ethereum Remains the Preferred Blockchain for On-Chain Assets
By the end of 2025, the scale of on-chain assets on Ethereum exceeded $400 billion, maintaining an absolute dominance among smart contract blockchains. In terms of asset structure: among the eight major smart contract blockchains, seven have a share of 90% for "top 50 tokens + stablecoins"; Solana is the only exception, with meme coins accounting for 21%, while other blockchains have this ratio below 3%. In the future, tokenization of real assets is expected to become one of the fastest-growing categories, and a significant amount of offline assets have yet to be tokenized, providing vast growth opportunities for the blockchain industry.
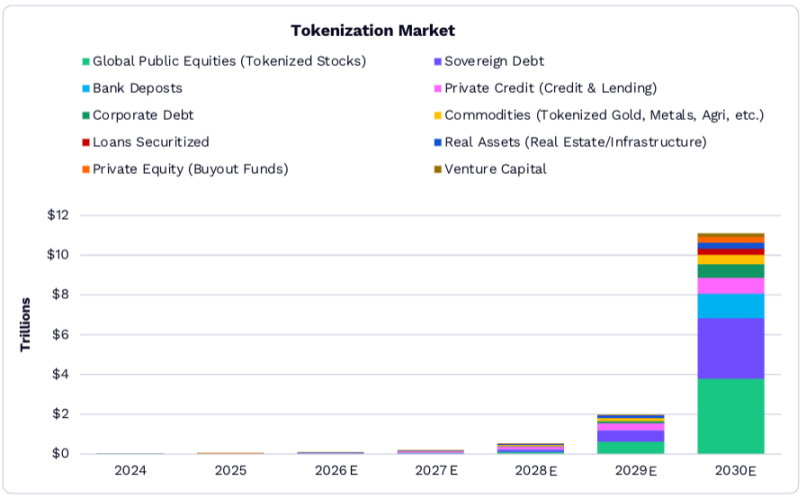
Global Tokenized Asset Scale Expected to Exceed $11 Trillion by 2030
ARK's research indicates that from 2025 to 2030, the scale of tokenized assets will grow from $19 billion to $11 trillion, accounting for 1.38% of global financial assets. Currently, sovereign debt (such as U.S. Treasury bonds) dominates, but the on-chain ratio of bank deposits and global public stocks is expected to increase significantly in the future, becoming the core driving force behind the growth of the tokenization market. ARK believes that improved regulatory clarity and the establishment of institutional-level infrastructure will be key prerequisites for the large-scale implementation of asset tokenization.
Traditional Enterprises Accelerate Building On-Chain Infrastructure
Traditional financial and technology companies are launching dedicated on-chain infrastructure to support their tokenization businesses: Circle launched the Layer 1 blockchain "Arc," Coinbase launched the Base blockchain and cbBTC (Bitcoin-pegged token), Kraken introduced the "Ink" network, OKX developed "X Layer," Robinhood created "Robinhood Chain," and Stripe launched "Tempo," among others. These platforms are primarily used to support Bitcoin staking loans, tokenized stocks and ETFs, stablecoin payment channels, etc. For example, Coinbase's Bitcoin staking loan business on Base had a supply exceeding 80,000 Bitcoins by the end of 2025; Robinhood's tokenized stocks (such as GOOGL, MSFT, NVDA, etc.) saw rapid growth in market capitalization between June and December 2025, with some assets exceeding $100 million in market cap.

DeFi Applications: Building the Growth Engine for Digital Assets
Value Capture of Digital Assets Shifts Towards Applications
The value distribution pattern of decentralized finance (DeFi) is undergoing significant changes: blockchain networks are gradually becoming "infrastructure," with user economies and profit margins shifting towards applications. In 2025, DeFi applications represented by Hyperliquid, Pump.fun, and PancakeSwap achieved total revenues of $3.8 billion, setting a new historical high; among these, January's revenue accounted for 20% of the annual total, making it the highest monthly revenue month in DeFi application history. By the end of 2025, 70 DeFi applications and protocols had a monthly revenue (MRR) exceeding $1 million, with the application side becoming the core value carrier of the DeFi ecosystem.
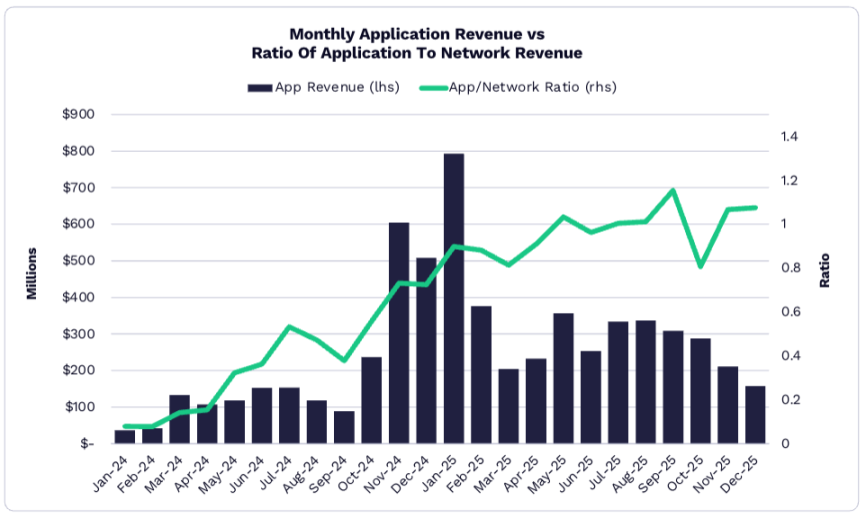
Changes in monthly revenue and "application/network revenue ratio" of DeFi applications from November 2024 to December 2025, showing a continuous increase in the share of application-side revenue.
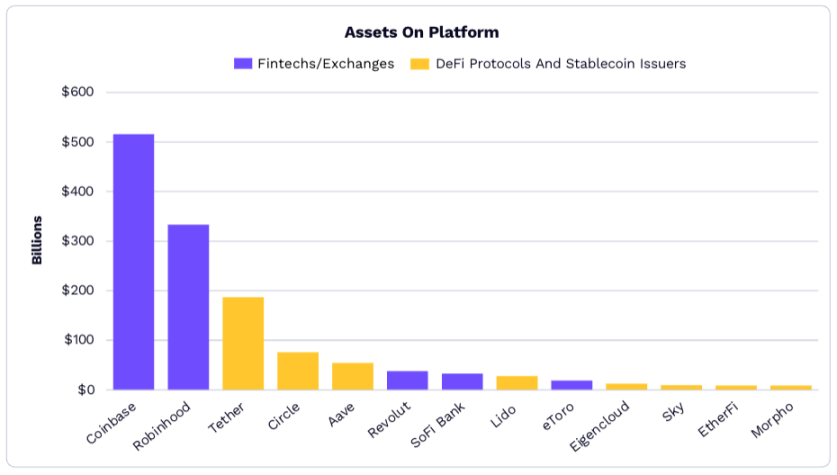
DeFi and Stablecoin Issuers' Asset Scales Approach Traditional Fintech
The asset scale gap between traditional fintech platforms and crypto-native platforms is narrowing, indicating a trend of integration between traditional finance and on-chain financial infrastructure. Specifically, DeFi protocols (such as liquid staking and lending platforms) are attracting significant institutional capital, rapidly expanding in scale: by the end of 2025, the total value locked (TVL) of the top 50 DeFi platforms exceeded $1 billion, with the top 12 platforms having a TVL exceeding $5 billion, and some leading platforms (such as Lido and Aave) nearing the asset scale of traditional fintech companies like Coinbase and Robinhood.
Hyperliquid, Tether, and Other Companies Lead in Global Efficiency
In 2025, some DeFi and stablecoin companies demonstrated extremely high operational efficiency, becoming one of the highest "revenue per employee" groups globally: Hyperliquid achieved over $800 million in annual revenue with fewer than 15 employees; Tether generated billions in revenue with a small number of employees through stablecoin issuance and trading fees; Pump.fun's revenue per employee also far exceeded that of traditional finance and tech companies. These on-chain enterprises significantly reduce labor costs through automated smart contracts and decentralized governance, redefining the standard of "corporate productivity." Currently, perpetual contracts, stablecoins, and meme coins are the on-chain verticals with the highest product-market fit (PMF), continuously attracting users and capital.
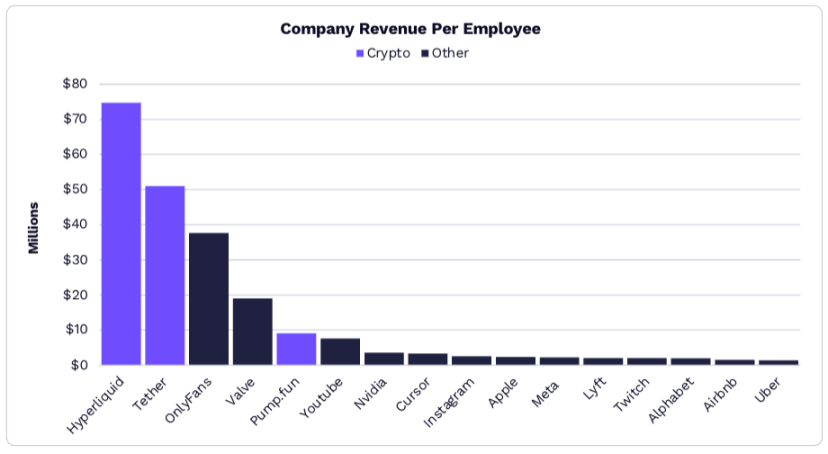
Comparison of revenue per employee between crypto companies like Hyperliquid, Tether, and traditional companies like OnlyFans, Nvidia, and Meta in 2025.
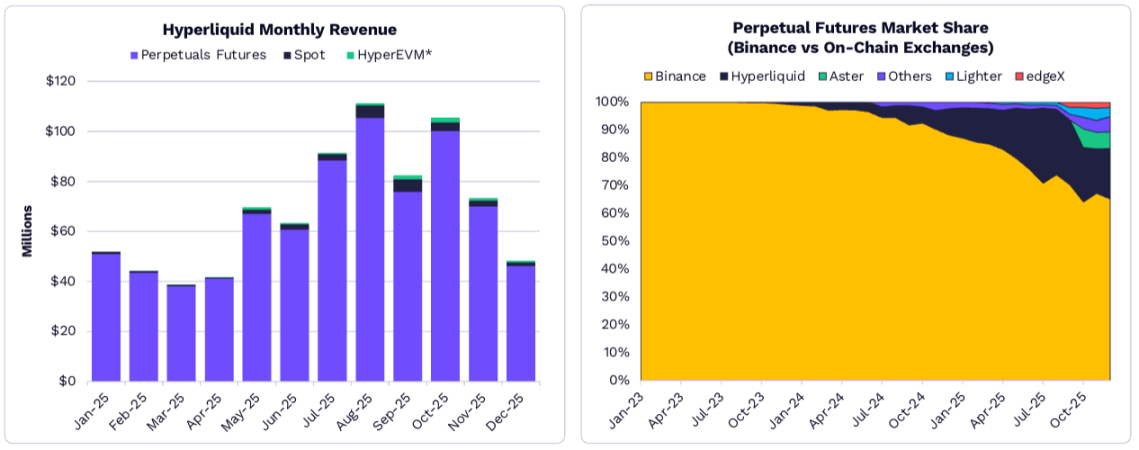
DeFi Derivatives Capture Market Share from Binance's Perpetual Contracts
DeFi derivatives platforms, represented by Hyperliquid, are capturing market share in perpetual contracts from centralized exchanges like Binance. In 2025, Hyperliquid's monthly revenue grew from approximately $5 million in January to over $100 million in December, with perpetual contract trading volume increasing its global market share from less than 1% to 8%. During the same period, Binance's market share in perpetual contracts fell from 85% to below 70%, with other DeFi derivatives platforms like Aster and Lighter also gaining market share. This trend indicates a significant increase in user demand for derivatives trading that "does not require trusted intermediaries and allows for asset self-control," highlighting the advantages of DeFi in trading experience and cost.
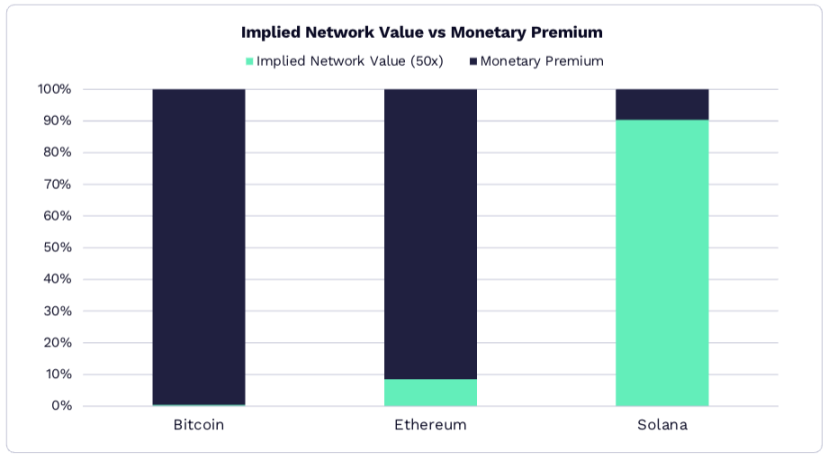
Layer 1 Blockchains Transitioning to "Monetary Assets"
The value logic of Layer 1 blockchains (such as Bitcoin, Ethereum, and Solana) is shifting from "revenue-driven" to "monetary attribute-driven": using a 50x high-growth revenue multiple, over 90% of Ethereum's market capitalization is derived from its "monetary premium" (as a medium for on-chain value storage and exchange), rather than network revenue; despite generating $1.4 billion in network revenue in 2025, 90% of Solana's market capitalization is still supported by its monetary attributes. ARK believes that in the future, only a few digital assets will retain monetary attributes and become highly liquid value storage tools, while other assets will rely more on revenue support from actual application scenarios for valuation.
Innovation Directions for DeFi Protocols: Modularization and Cross-Chain Collaboration
As user demand for complex financial scenarios increases, DeFi protocols are innovating towards "modular architecture" and "cross-chain collaboration."
- Modular Design: Leading DeFi projects are beginning to decompose core functions (such as trading, clearing, and staking) into combinable "module components." For example, Aave launched a "modular lending framework" that allows developers to customize collateral types, interest rate models, and liquidation rules to fit different scenarios (such as NFT collateralized lending and cross-chain asset staking); Uniswap V5 introduced a "custom fee module" that allows project teams to set differentiated rates for specific trading pairs, enhancing market maker profits. This design significantly lowers the development threshold for DeFi applications, with the number of long-tail protocols built on modular components increasing more than threefold in 2025.
- Deepening Cross-Chain Collaboration: The maturity of Layer 0 protocols (such as Cosmos and Polkadot) and cross-chain bridges (such as LayerZero and Avalanche Bridge) is enhancing the liquidity efficiency of DeFi assets across different blockchains. In 2025, the proportion of cross-chain DeFi transactions rose from 15% to 32%, with the largest cross-chain transaction volumes occurring between "Ethereum - Solana" and "Ethereum - Base." For example, users can deposit USDC on Ethereum, cross-chain it to Solana via LayerZero, participate in meme coin trading on Pump.fun, and then transfer the earnings back to Ethereum through a cross-chain bridge, reducing the entire process time from 1 hour to under 5 minutes, with transaction fees decreasing by 60%.
Institutional Capital Reshapes the DeFi Ecosystem
In 2025, institutional investors' participation in DeFi significantly increased, shifting from "watchful testing" to "active layout," primarily showing three major trends:
- Liquid Staking as an Entry Point: Traditional asset management institutions (such as BlackRock and Fidelity) are participating in staking assets like Ethereum and Solana through compliant liquid staking platforms (such as Lido and Coinbase Prime) to obtain stable returns. In 2025, the scale of liquid staking led by institutions grew from $5 billion to $35 billion, accounting for 42% of the total market liquid staking scale. For example, BlackRock staked over 2 million Ethereum on Lido, becoming the third-largest staker on the platform.
- Growing Demand for Customized DeFi Products: Institutional clients are increasingly demanding "low volatility, high compliance" DeFi products, driving protocols to launch exclusive solutions. For instance, Aave designed an "isolated lending pool" for family offices that only allows compliant assets (such as USDC and tokenized government bonds) as collateral, with a maximum collateralization ratio of 1.5 to reduce liquidation risk; Curve launched an "institutional-grade stablecoin exchange pool," providing zero slippage and low-fee large exchange services to meet the daily capital allocation needs of institutions amounting to millions of dollars.
- Improved Compliance Tools and Audit Systems: To attract institutional capital, DeFi protocols are strengthening compliance measures, such as integrating on-chain monitoring tools like Chainalysis and Elliptic, regularly undergoing smart contract audits by the Big Four accounting firms (such as PwC), and some protocols have even obtained U.S. MSB (Money Services Business) licenses. In 2025, the number of DeFi protocols passing compliance audits increased 2.5 times, with the proportion of institutional capital locked in DeFi rising from 8% to 21%.
Challenges Facing DeFi and Regulatory Responses
Despite the rapid development of DeFi, it still faces three major challenges: technical risks, regulatory uncertainties, and user barriers:
- Technical Risks Continue to Emerge: In 2025, losses from smart contract vulnerabilities and flash loan attacks in DeFi protocols reached $1.2 billion, a 30% decrease from 2024, but high-risk events remain frequent. For example, a decentralized exchange was hacked due to a "permission control vulnerability," resulting in the theft of $180 million in assets, highlighting the importance of code security. In response, the industry is accelerating the application of "formal verification" technology, with the proportion of DeFi protocols using this technology rising from 20% to 55%, reducing the incidence of vulnerabilities by 70%.
- Regulatory Framework Gradually Clarifying: Major economies worldwide are beginning to establish regulatory rules for DeFi, focusing on "categorical regulation" and "responsibility definition." For example, the U.S. SEC categorizes DeFi protocols into "trading platforms," "lending platforms," and "asset management platforms," each subject to different regulatory requirements; the EU's Markets in Crypto-Assets Regulation (MiCA) requires DeFi protocol operators to register as "crypto asset service providers" (CASPs), disclose risk information, and undergo regulatory scrutiny. While the clarification of regulations increases compliance costs, it also reduces market uncertainties, with the user retention rate of compliant DeFi protocols in 2025 being 40% higher than that of non-compliant protocols.
- User Barriers Still Need to Be Lowered: Current DeFi operations still rely on wallet and private key management and other technical details, making it difficult for ordinary users to master. In 2025, the industry launched "simplified DeFi entry points," such as the "one-click staking" feature built into Coinbase Wallet, allowing users to participate in staking projects across different chains without manually switching blockchains; MetaMask introduced a "natural language interaction" feature, enabling users to input "deposit 100 USDC into Aave for yield," with the system automatically completing the on-chain operations, significantly lowering the usage barrier. These tools drove the monthly active users (MAU) of DeFi to grow by 80% in 2025, with the proportion of non-technical background users rising from 35% to 58%.
2030 DeFi Market Size Forecast
ARK predicts that from 2025 to 2030, the total revenue of the DeFi industry will grow from $3.8 billion to $45 billion, with a compound annual growth rate of 65%, primarily driven by three major areas:
- Derivatives Trading: DeFi derivatives such as perpetual contracts and options will continue to capture market share from centralized exchanges, with the proportion of DeFi derivatives trading volume expected to rise from 8% in 2025 to 35% by 2030, generating $22 billion in revenue;
- Institutional-Level Services: Customized DeFi services for traditional institutions (such as compliant staking and cross-chain capital management) will become a new growth point, with related revenue reaching $15 billion by 2030;
- Long-Tail Scenario Penetration: The application of DeFi in microfinance (such as cross-border small remittances) and supply chain finance (such as tokenized receivables) will gradually materialize, contributing $8 billion in revenue by 2030.
At the same time, ARK emphasizes that the long-term development of DeFi will rely on the collaborative enhancement of "technical security," "regulatory compliance," and "user experience." Only by addressing these three core issues can DeFi transition from a "niche market" to a "mainstream financial supplement."
Summary: Three Core Trends of Blockchain Assets
From the development of Bitcoin, tokenized assets to DeFi applications, the blockchain industry is entering a new stage of "institutionalization, compliance, and scenario-based" in 2025, presenting three core trends:
- Asset Attributes Shifting from "Speculative Tools" to "Compliant Assets": Bitcoin is gaining institutional recognition through ETFs and strategic reserves, tokenized assets are bringing traditional financial assets onto the blockchain, and DeFi is attracting institutional capital through compliance transformations, leading to a more stable asset attribute across the industry, gradually becoming part of mainstream investment portfolios;
- Value Logic Shifting from "Narrative-Driven" to "Application-Driven": Early blockchain assets relied on "technical narratives" for speculation; today, Bitcoin's safe-haven attributes, the efficiency improvements of tokenized assets, and the actual financial service capabilities of DeFi are all centered on "solving real needs," with application scenarios becoming the key to value support;
- Ecosystem Structure Shifting from "Isolated Development" to "Collaborative Integration": Bitcoin is linking with DeFi through cross-chain bridges, tokenized assets are circulating within DeFi, and traditional financial institutions are participating in the on-chain ecosystem through infrastructure building, deepening the integration of blockchain with traditional finance and the real economy, accelerating the realization of the "value internet."
In the next five years, as technology matures and regulations improve, blockchain assets are expected to occupy a more significant position in the global financial system, creating new value spaces for investors, enterprises, and economies.
Others
Biotechnology: Multi-Omics + AI Revolutionizing Healthcare
- Multi-Omics Technology: Integrating multidimensional data such as genomics and proteomics to support disease research and drug development, with companies like Illumina and Quantum Si as representatives in the field.
- Cost and Data: The cost of whole genome sequencing has dropped from hundreds of millions of dollars in 2001 to $100 in 2025, and is expected to reach $10 by 2030; by 2030, molecular diagnostics are projected to generate 200 trillion "biological tokens" annually, laying the foundation for AI in healthcare.
- AI Empowerment: AI will reduce the drug development cycle from 13 years to 8 years, and costs from $2.4 billion to $70 million; gene editing therapies will save long-term healthcare costs, with the U.S. "health span potential" market reaching $12 trillion, indicating significant growth potential.
Space and Robotics: Expanding New Productive Forces
- Reusable Rockets: SpaceX has reduced launch costs from $15,600 per kilogram in 2008 to below $1,000 by 2025, with Starship applications expected to reach $100; by 2025, Starlink will account for 66% of global satellites in orbit, and satellite communication revenue could reach $160 billion by 2035.
- Robotics Technology: The global robotics market is expected to reach $26 trillion (with manufacturing and home services each at $13 trillion); humanoid robots will be 200,000 times more complex than autonomous taxis, with Tesla's Optimus potentially achieving human-level task capabilities by 2028.
Energy and Autonomous Driving: Supporting Innovation and Mobility
- Distributed Energy: By 2025, the share of clean energy installations will increase, with declining costs for solar and energy storage; by 2030, global electricity will require an investment of $10 trillion, and energy storage capacity will need to increase 19 times to meet the demands of AI data centers.
- Autonomous Driving: By 2030, the cost of Robotaxi per mile could be $0.25 (only 1/10 of traditional ride-hailing services), with the value of related companies estimated at $3.4 trillion, where the technology platform accounts for 98% of the value; autonomous driving logistics costs will significantly decrease, with delivery revenue potentially reaching $480 billion by 2030.
Risk Warning and Future Outlook
Core Risks in Innovative Fields
- Uncertainty of Technological Breakthroughs: The performance improvement of certain technologies (such as quantum computing) is slower than expected, with Google achieving only one doubling of qubit count in the past four years, making it unlikely to be used in key scenarios like cryptography before 2040.
- Regulatory and Competitive Challenges: Innovative technologies may face strict regulations (such as cryptocurrency and AI ethics), and the industry is highly competitive, meaning companies may not achieve timely commercialization of their technologies.
- Macroeconomic and Market Volatility: Economic cycles and geopolitical factors may affect capital investment in innovative fields, leading to slower-than-expected technology implementation.
Future Outlook
ARK predicts that from 2025 to 2030, capital investment alone could contribute an average of 1.9 percentage points to global real GDP growth, and when combined with the synergistic effects of other innovations, the actual growth rate could exceed consensus expectations by more than 4 percentage points. The five major innovative platforms, including artificial intelligence, blockchain, and robotics, will provide structural growth momentum for the global economy. Participants who identify and position themselves in these trends early are likely to gain a competitive edge in the race to "seize the future."
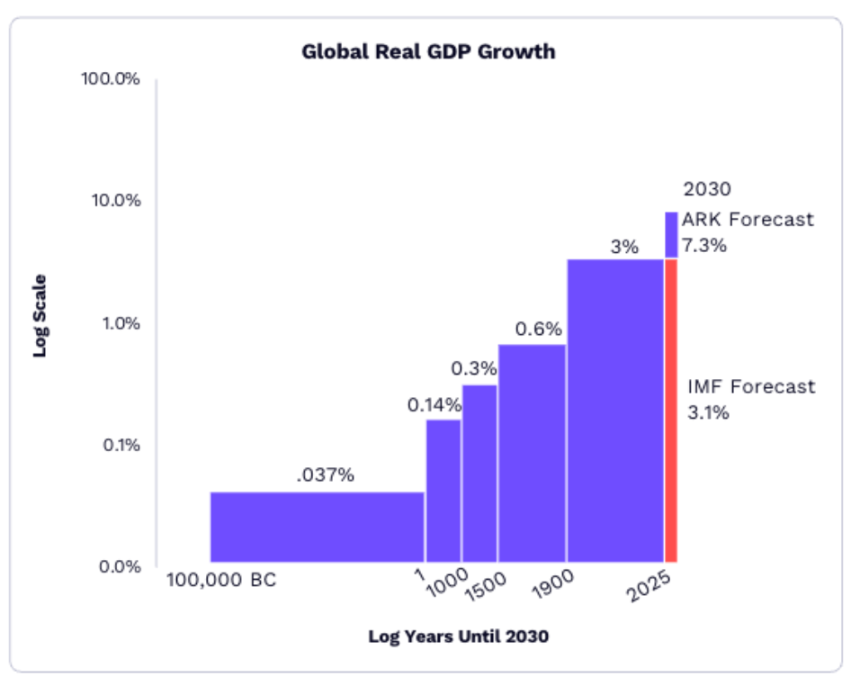
Global GDP Growth Rate Forecast for 2025-2030
Note: All images in this report are for illustration purposes only; actual images should be replaced with legally authorized materials. Data and forecasts are based on ARK's internal analysis and public sources (such as the International Monetary Fund, U.S. Bureau of Labor Statistics, SpaceX, etc.), as of January 2026, and may change in the future due to factors such as technology, market, and policy.
免责声明:本文章仅代表作者个人观点,不代表本平台的立场和观点。本文章仅供信息分享,不构成对任何人的任何投资建议。用户与作者之间的任何争议,与本平台无关。如网页中刊载的文章或图片涉及侵权,请提供相关的权利证明和身份证明发送邮件到support@aicoin.com,本平台相关工作人员将会进行核查。


