 Author: Garrett
Translated by: Yuliya, PANews
Recently, some analysts have begun to compare the current price trend of Bitcoin with that of 2022. Although the short-term price patterns may appear somewhat similar, this comparison is completely absurd in the long run. Whether from the perspective of long-term price patterns, macroeconomic context, or the composition and structure of investors, the underlying logic has fundamentally changed.
One of the biggest mistakes in analyzing and trading financial markets is to focus solely on short-term, superficial statistical similarities while ignoring long-term, macro, and fundamental driving factors.
Opposite Macroeconomic Background
In March 2022, the United States was clearly in a high inflation and interest rate hike cycle, primarily driven by the following factors:
Excess liquidity released during the COVID-19 pandemic.
The outbreak of the Ukraine war, which further pushed inflation higher.
In that environment, risk-free interest rates were continuously rising, liquidity was systematically withdrawn, and financial conditions were tightening. Therefore, the primary goal of capital was risk aversion. What we saw in the Bitcoin market was a typical distribution structure at high levels during a tightening cycle. 
In contrast, the current macro environment is exactly the opposite:
The Ukraine conflict is easing (partly due to U.S. efforts to reduce inflation and interest rates).
The Consumer Price Index (CPI) and risk-free interest rates in the U.S. are declining.
More importantly, the AI technology revolution greatly enhances the likelihood of the economy entering a long-term inflation decline cycle. Thus, on a larger cycle, interest rates have entered a phase of reduction.
Central bank liquidity is being re-injected into the financial system.
All of this defines capital behavior as "risk-seeking."
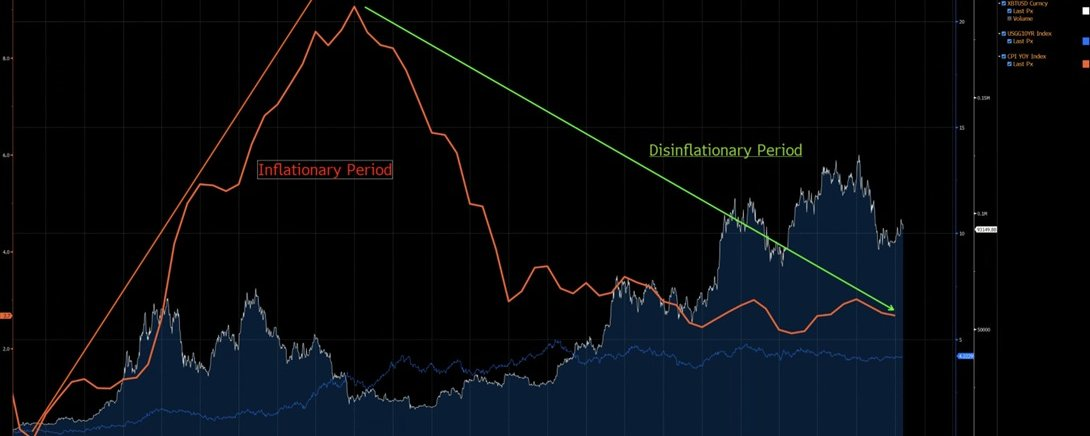
From chart analysis, it can be seen that since 2020, Bitcoin's price has shown a clear negative correlation with the year-on-year change in CPI—Bitcoin tends to fall during inflationary periods and rise during deflationary periods. Under the AI-driven technological revolution, a long-term decline in inflation is a high-probability event, a view echoed by Elon Musk, reinforcing this argument. 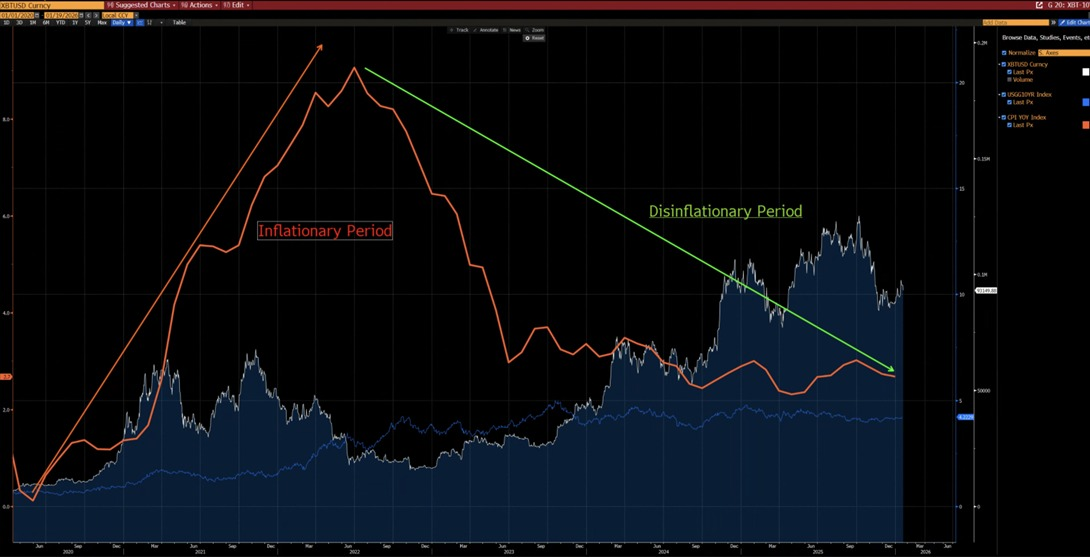
Additionally, since 2020, Bitcoin has also shown a strong correlation with the U.S. liquidity index (except for short-term distortions caused by ETF inflows in 2024). Currently, the U.S. liquidity index has broken through its short-term (white line) and long-term (red line) downtrend lines, indicating a new upward trend is about to emerge. 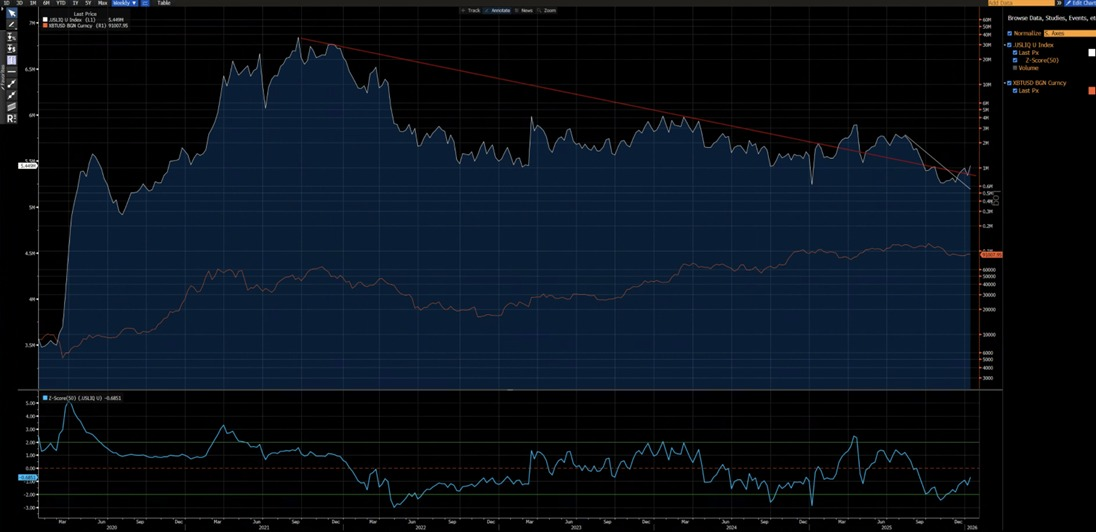
Different Technical Structures
2021-2022: The market exhibited a weekly M-top structure, which is typically associated with long-cycle market tops and would suppress prices for a considerable time.
2025: The current market shows a weekly breakdown of an upward channel. From a probabilistic perspective, this is more likely to be a "bear trap," followed by a rebound back into the channel.
Of course, we cannot completely rule out the possibility of the market evolving into a prolonged bear market like in 2022. However, the key point is that the area between $80,850 and $62,000 has undergone extensive consolidation and turnover. The previous ample accumulation process provides a far superior risk-reward ratio for establishing bullish positions: its upside potential significantly outweighs the downside risk.
What Conditions Are Needed to Reproduce a 2022-style Bear Market?
To replicate the level of bear market seen in 2022, the following indispensable conditions must be met:
A new round of inflation shock occurs, or a major geopolitical crisis of a scale comparable to that of 2022 erupts.
Central banks restart interest rate hikes or quantitative tightening (QT).
Prices decisively and continuously fall below $80,850.
Until these conditions are met, any claims of a structural bear market are premature, based on subjective speculation rather than objective analysis. 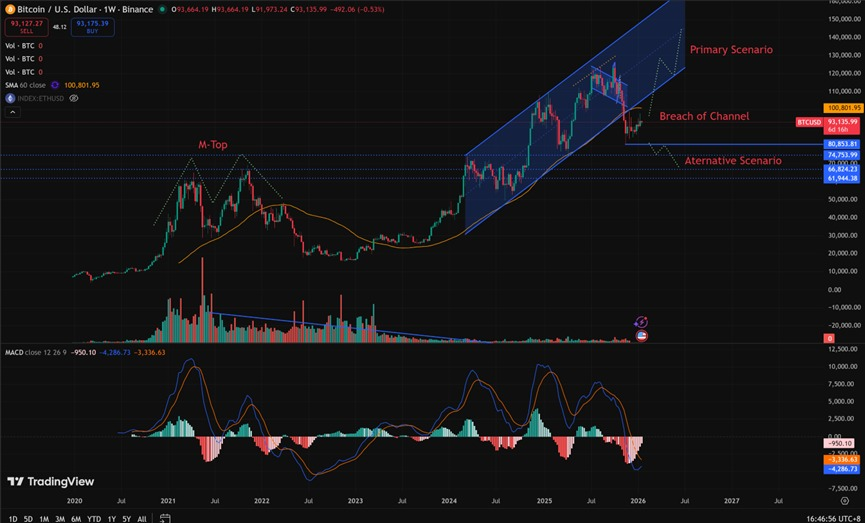
Different Investor Structures
2020–2022: This was a market dominated by retail investors, with limited institutional participation, especially a lack of long-term allocation institutions.
2023 to present: The launch of Bitcoin spot ETFs has introduced structural long-term holders. These institutions effectively lock in supply, drastically reduce the trading velocity of tokens, and significantly lower market volatility.
From both macroeconomic and quantitative indicators, 2023 marks a structural turning point for Bitcoin as an asset. The volatility pattern of Bitcoin has shifted from a historical range of 80%-150% to 30%-60%, reflecting a fundamental change in its asset behavior. 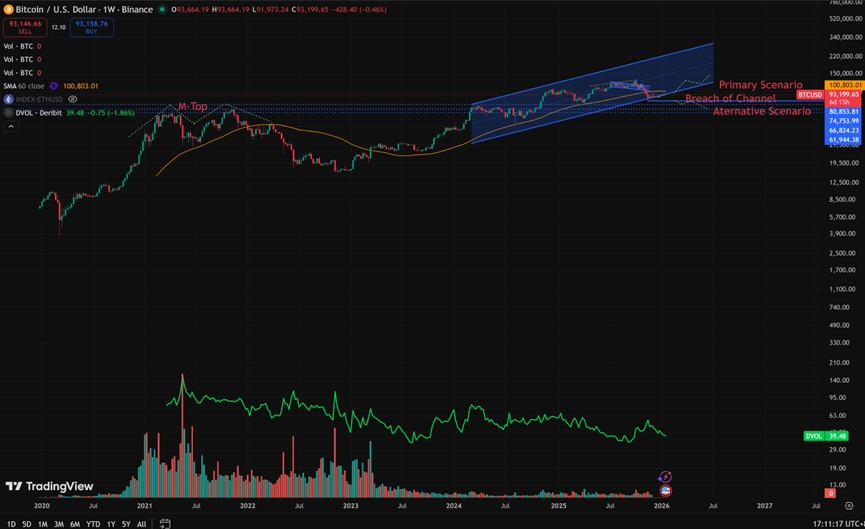
Core Structural Differences (Current vs. 2022)
The most significant difference in the structure of Bitcoin investors between now (early 2026) and 2022 is that the market has shifted from "retail-dominated, high-leverage speculation" to "institution-dominated, structural long-term holding."
In 2022, Bitcoin experienced a classic "crypto-native bear market," driven by panic selling from retail investors and a chain of liquidations of leveraged positions. Today, Bitcoin's operating environment has entered a more mature institutional era characterized by:
Stable underlying demand.
Locked supply.
Institutional-level volatility.
The following is a core comparison based on on-chain data (such as Glassnode, Chainalysis) and institutional reports (such as Grayscale, Bitwise, State Street) as of mid-January 2026 (when Bitcoin's price was in the $90k–$95k range).
| Dimension | 2022 (Bear Market Bottom, approx. $16k-$20k) | Early 2026 (Current, approx. $90k-$95k) | Major Changes and Impacts | |-----------|----------------------------------------------|------------------------------------------|---------------------------| | Dominant Investor Type | Retail + Crypto-native group (retail, leveraged players) | Institutions + Corporates + Macro Funds (ETFs, corporate treasuries, sovereign/pension funds) | Shift from "retail sentiment-driven" to "institutional allocation-driven." Institutional holdings now account for about 24% (below 5% in 2022); retail net selling. | | Institutional/ETF Share | Very low (no spot ETFs, limited institutional exposure) | Bitcoin spot ETF + ETP AUM > $100-$130 billion, holding about 1.3-1.5 million Bitcoins (about 6-7% of circulating supply) | Approval of ETFs in 2024 is a turning point. Net inflows of about $25 billion in 2025; even during downturns, institutions provide structural support. | | Corporate Treasury Holdings | Very few (MicroStrategy early stage) | Public companies hold >1.3 million Bitcoins (~6-7% of supply); MicroStrategy holds >650,000 Bitcoins, followed by Japanese companies (e.g., Metaplanet) | "MicroStrategy model" goes global. Corporates shift from speculation to strategic reserves; added over 200,000 Bitcoins in 2025. | | Retail Behavior | Panic selling, sharp decrease in active addresses, plummeting small transaction volume | Retail net selling (e.g., estimated to sell about 247,000 Bitcoins in 2025); sharp decline in small transaction volume, but some "shrimp" (1 Bitcoin) accumulate at lows | Retail has "surrendered" or turned to indirect investment via ETFs. Google Trends heat is low, on-chain small activity decreases. | | Long-term Holder (LTH) Behavior | Large-scale forced/panic distribution, sharp decline in LTH supply | LTH still distributing (peaked at the end of 2025, now slowing); tokens are flowing to institutions/corporates | 2022 was "desperate distribution"; now it's "orderly profit-taking to institutions." Weekly realized profits of LTH have dropped from over 100,000 Bitcoins peak to lower levels. | | Whales/Mid-sized Holders | Whales also panic sold or were liquidated | "Fish to sharks" (holding 10-1,000 Bitcoins) + whales (>1,000 Bitcoins) are aggressively accumulating (e.g., heaviest monthly purchases since the FTX collapse) | Mid-sized holders (high net worth individuals, OTC, institutions) are now the main buyers; Glassnode's accumulation score is near all-time highs. | | Exchange Reserves and Liquidity | High reserves (>3 million Bitcoins), prone to triggering chain liquidations | Reserves down to about 2.76 million Bitcoins; net outflows; more funds locked in ETFs/corporates | Decrease in "hot money" on exchanges → reduced risk of leveraged liquidations. Volatility decreased (e.g., from 84% to ~43%). | | Overall Market Stability | High leverage + retail → extreme volatility, multiple drawdowns exceeding -70% | Institutional base + corporate lock-up → even with -44% drawdown (from 2025 peak), no chain reaction triggered | 2025 had negative returns but structurally resilient. Unlike the "total collapse" of 2022, there is now solid institutional buying support. |
免责声明:本文章仅代表作者个人观点,不代表本平台的立场和观点。本文章仅供信息分享,不构成对任何人的任何投资建议。用户与作者之间的任何争议,与本平台无关。如网页中刊载的文章或图片涉及侵权,请提供相关的权利证明和身份证明发送邮件到support@aicoin.com,本平台相关工作人员将会进行核查。


