📊 Bitcoin One-Hour Level Market Chart Technical Analysis
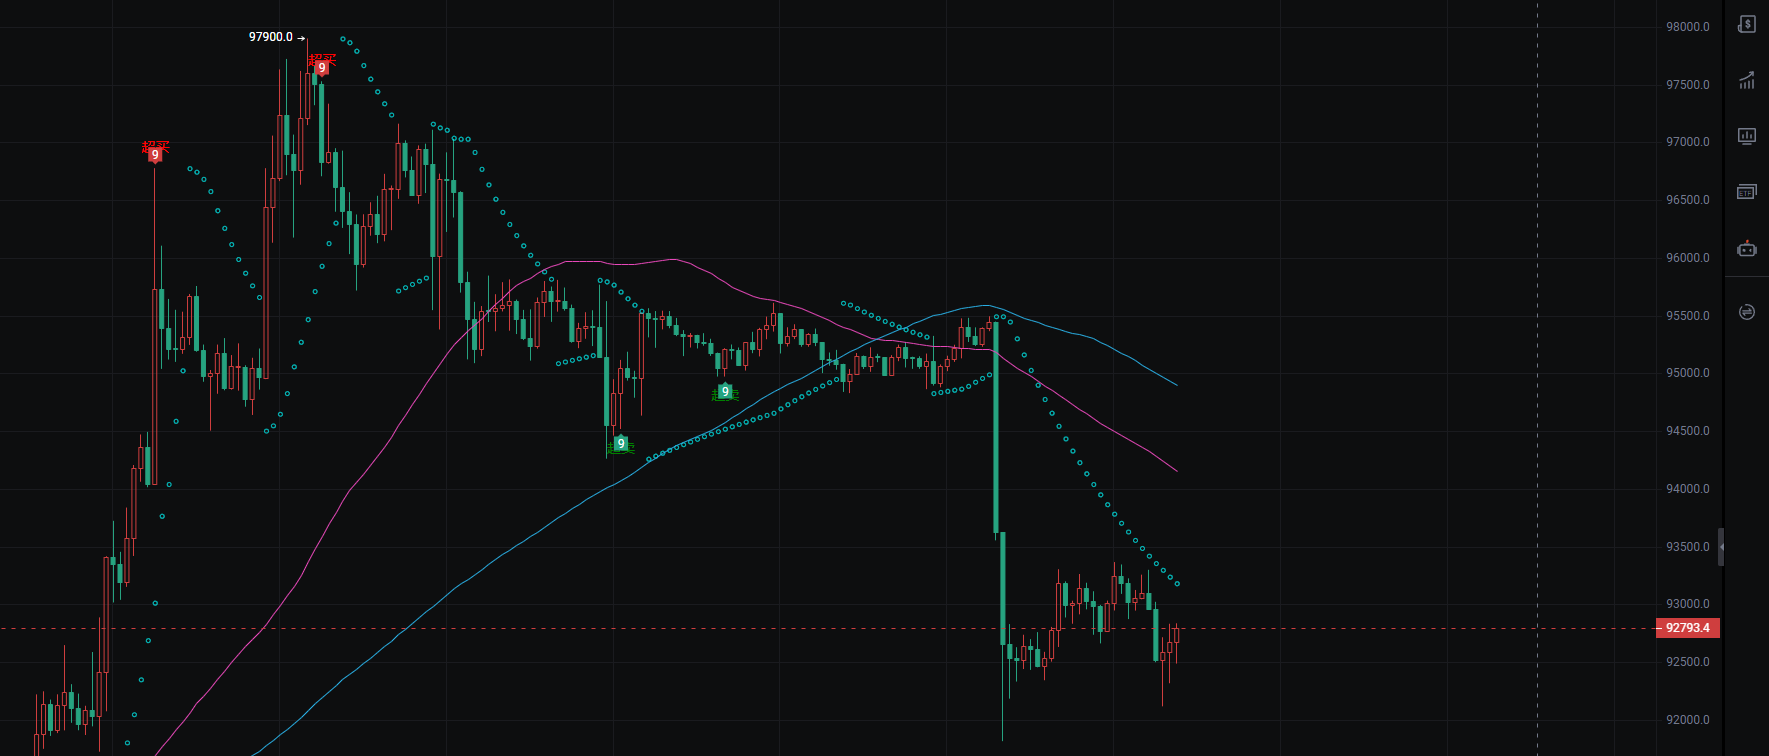
- Trend and Structure Previous Movement: The price experienced a rapid surge, encountering resistance and falling back after reaching a high of 97900.0, followed by a phase of oscillation and rebound.
Key Turning Point: The rebound failed to break through the previous high, instead showing a long bearish candlestick, which is a clear signal of bearish momentum release, directly ending the rebound trend.
Current Status: The price is in a low-level consolidation after a rapid decline, with the overall trend shifting from rebound to downward trend, and market sentiment is bearish.
Moving Average Signals The two moving averages in the chart (purple short-term, blue long-term): The price briefly stood above the moving averages during the rebound but quickly fell below after the drop. Currently, the two moving averages are in a bearish arrangement (the short-term moving average crossing below the long-term moving average and continuing downward), indicating a typical weak pattern. The moving averages are exerting significant pressure on the current price, and during rebounds, the price will first encounter resistance from the moving averages.
Key Signal Points Red "Buy" Signal: Appeared at the high point of the rebound, representing a typical chasing high signal, followed by a price peak and decline, indicating that the credibility of high-level signals is low.
Green "Sell" Signal: Appeared at a relative high before the drop, successfully warning of subsequent downside risk, with high effectiveness near the resistance level.
Bottom Support: The lower red dashed line (current price level 92736) is the core support level, and the price has fallen to this area, requiring close attention to the strength of the support.
- Subsequent Trend Projection Bearish Scenario: If the price effectively breaks below the red support line (closing price below and with volume), it will confirm the continuation of the bearish trend, with the next support looking towards around 92000.
Oscillation Scenario: If the support line holds, the price may weakly oscillate above the support level, but under the pressure of the moving averages, the rebound space is limited, with the first resistance level above being the purple moving average (about 94500) and the second resistance level being the blue moving average (about 95500).
Potential Risks: Current market sentiment is bearish, and without a volume rebound or positive stimulus, the trend is unlikely to reverse quickly.
🎯 Key Price Levels and Response Strategy List
🔴 Core Support Level Key Price: 92736 (red dashed line in the chart)
Strategy: If the price stabilizes above this support level (showing small bullish candles, doji, etc.), consider trying a light long position, with a stop loss set below the support level (e.g., 92500). If the price effectively breaks below this support level (closing price below and with volume), it will confirm the continuation of the bearish trend, and it is recommended to exit and observe or short the market, with the next support target looking towards 92000.
Main Resistance Levels First Resistance: Purple short-term moving average (currently about 94500)
Second Resistance: Blue long-term moving average (currently about 95500)
Strategy: If the price rebounds and encounters resistance near the purple moving average, consider reducing positions or shorting, with a stop loss set above the moving average (e.g., 94800). Only if the price can break through the blue moving average with volume can the short-term weakness be reversed, at which point the trend can be reassessed.
Signal Point Response Red "Buy" Signal: If it appears near the support level (around 92736), it is more credible; if it appears at a high point of the rebound (e.g., close to 95000), be cautious of a false signal.
Green "Sell" Signal: If it appears when rebounding to the resistance level, it can serve as an important basis for exiting or shorting.
📊 Ethereum One-Hour Level Market Chart Technical Analysis
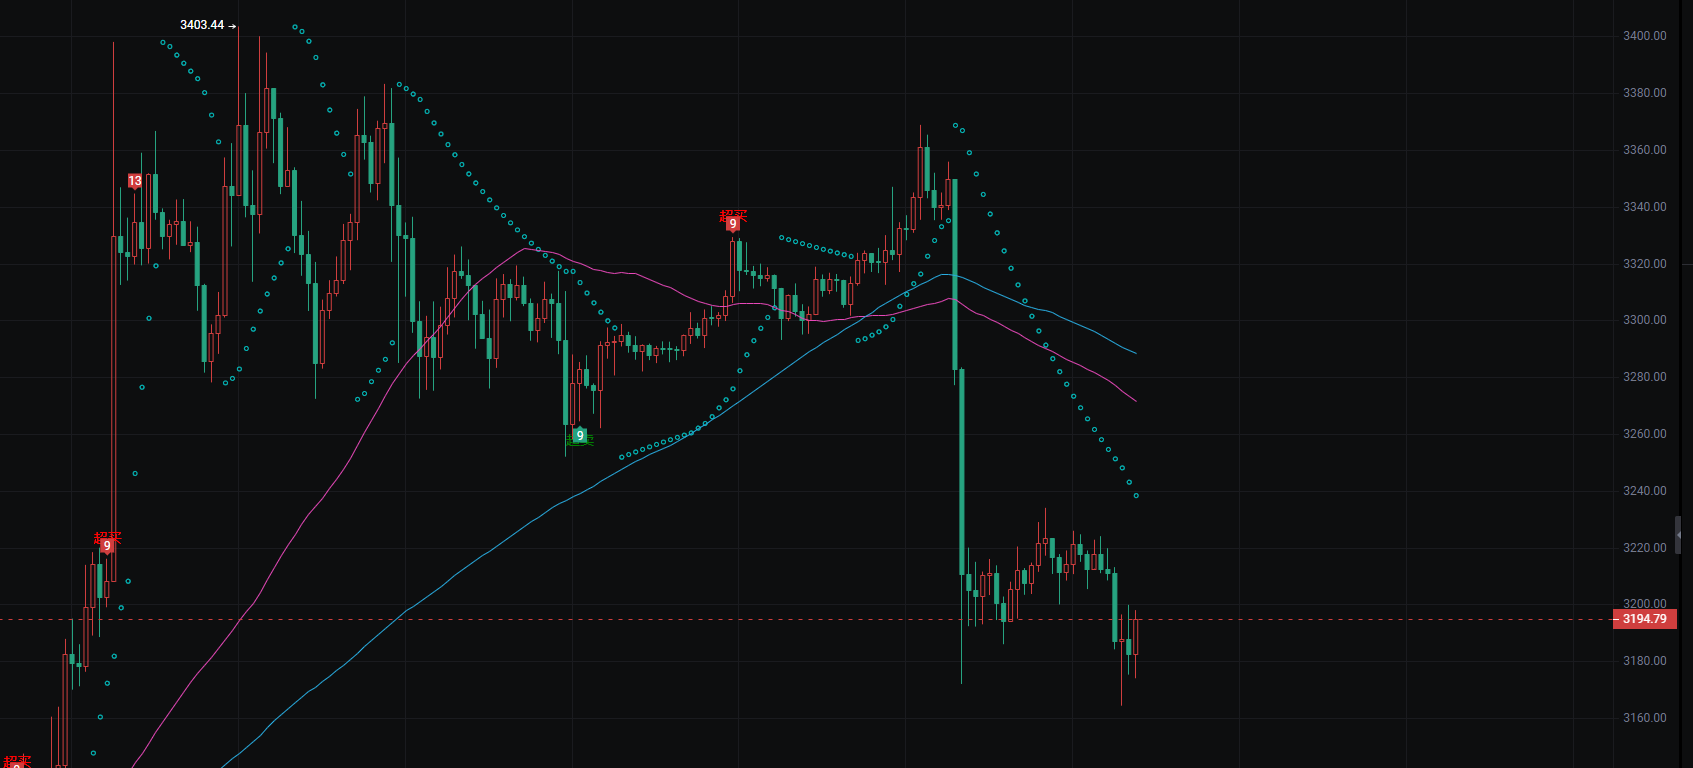
- Trend and Structure Previous Movement: The price first experienced a rapid surge, reaching a high of 3403.44 before falling back, followed by a rebound that formed a small ascending structure.
Key Turning Point: During the rebound phase, the price failed to break through the previous high, instead showing a long bearish candlestick's rapid drop, which is a clear signal of bearish momentum release, also signaling the end of the rebound.
Current Status: The price is in a low-level consolidation phase after a rapid decline, with the overall trend shifting from rebound to downward trend.
Moving Average Signals The two moving averages in the chart (purple, blue): The price briefly stood above the moving averages during the rebound but quickly fell below both moving averages after the drop. Currently, the two moving averages are in a bearish arrangement (the short-term moving average crossing below the long-term moving average and continuing downward), indicating a typical weak pattern signal. The moving averages are exerting significant pressure on the current price.
Key Signal Points Red "Buy" Signal: Appeared in the high area of the rebound, representing a typical chasing high signal, followed by a price peak and decline, indicating that the effectiveness of this signal at high levels is poor.
Green "Sell" Signal: Appeared at a relative high before the price drop, warning of risk and corresponding with the subsequent downward movement.
Bottom Support: The lowest red dashed line is the current key support level, and the price has fallen to this position (current price level 3189.54), requiring attention to the strength of the support here.
- Subsequent Trend Projection Bearish Scenario: If the price breaks below the red support line, it is likely to initiate a new round of decline, with no obvious support below.
Oscillation Scenario: If the support line holds, the price may weakly oscillate above the support level, but under the pressure of the moving averages, the rebound space is limited.
Potential Risks: Current market sentiment is bearish, and without new positive news or a volume rebound, the trend is unlikely to reverse quickly.
🎯 Key Price Levels and Response Strategy List
🔴 Core Support Level Key Price: 3189.54 (red dashed line in the chart)
Strategy: If the price stabilizes above this support level (showing small bullish candles, doji, etc.), consider trying a light long position, with a stop loss set below the support level (e.g., 3180). If the price effectively breaks below this support level (closing price below and with volume), it will confirm the continuation of the bearish trend, and it is recommended to exit and observe or short the market, with the next support target looking towards around 3160.
Main Resistance Levels First Resistance: Purple short-term moving average (currently about 3280)
Second Resistance: Blue long-term moving average (currently about 3300)
Strategy: If the price rebounds and encounters resistance near the purple moving average, consider reducing positions or shorting, with a stop loss set above the moving average (e.g., 3290). Only if the price can break through the blue moving average with volume can the short-term weakness be reversed, at which point the trend can be reassessed.
Signal Point Response Red "Buy" Signal: If it appears near the support level (around 3189.54), it is more credible; if it appears at a high point of the rebound (e.g., close to 3300), be cautious of a false signal.
Green "Sell" Signal: If it appears when rebounding to the resistance level, it can serve as an important basis for exiting or shorting.
Daily, at irregular times, internal channels share more real-time trading strategies. If you have been operating without direction for a long time or have been losing for a long time, please follow the public account to contact the teacher—Big Bear.

免责声明:本文章仅代表作者个人观点,不代表本平台的立场和观点。本文章仅供信息分享,不构成对任何人的任何投资建议。用户与作者之间的任何争议,与本平台无关。如网页中刊载的文章或图片涉及侵权,请提供相关的权利证明和身份证明发送邮件到support@aicoin.com,本平台相关工作人员将会进行核查。