Source: The Defi Report
Author: Michael Nadeau
Translation and Compilation: BitpushNews
Solana kicked off 2025 with a bang, becoming the preferred platform for Trump’s meme coin issuance and the first stop for most new users entering this cycle. However, how did 2025 wrap up?
The current Solana network seems to be entering a period of cyclical reset. On-chain speculative demand continues to decline, and new application scenarios and traditional finance (TradFi) integration have yet to fill this gap. Q4 operational performance has significantly weakened: total revenue (REV) dropped 43% to its lowest level since Q3 2023; real on-chain yield fell 56% to 0.46%. Meanwhile, the fundamentals have deteriorated with user activity, and operational costs have risen sharply relative to user fees.
This article will comprehensively review Solana's Q4 performance through data.
I. Operational Performance: Dual Shrinkage of Revenue and Yield
1. Real Economic Value (REV)
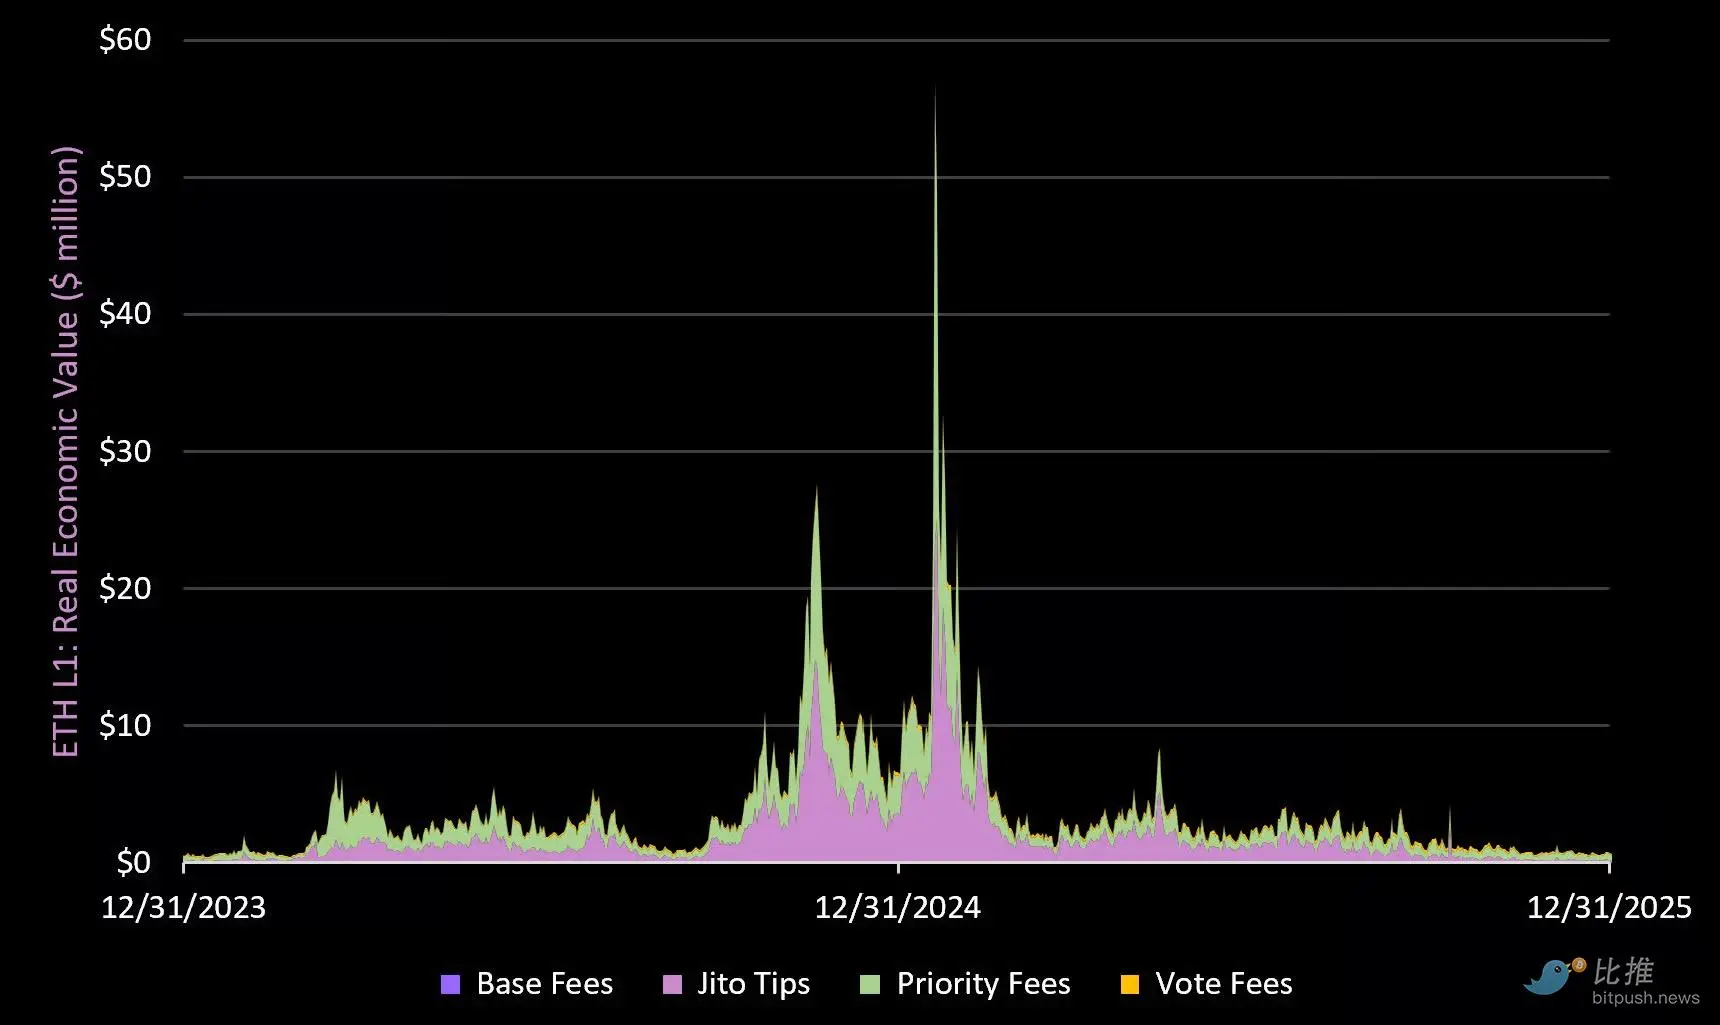
Note: REV includes base fees, priority fees, MEV (Jito Tips), and voting fees. MEV is returned to SOL holders through staking.
In Q4, the Solana network generated only $91.1 million in total fees, the lowest since Q3 2023, far below the previous quarter's $222.7 million.
2025 Annual Performance: Generated $1.4 billion in REV, a 1.4% decrease from last year.
Comparison Reference: Ethereum network Q4 fees were $141 million, with an annual total of $763 million in 2025.
Data Breakdown:
- Base Fees: Q4 down 32% (but up 43% for the entire year of 2025)
- Jito Tips (MEV): Q4 plummeted 75% (up 8% for the entire year of 2025)
- Priority Fees: Q4 down 51% (up 15% for the entire year of 2025)
- Voting Fees: Q4 down 27% (up 32% for the entire year of 2025)
Core Conclusion:
Solana is the "speculative base camp" of this cycle (along with Hyperliquid). The strongest applications on the network (Pump, Axiom, Raydium, Jupiter) cater entirely to retail traders—this makes on-chain revenue highly cyclical and reliant on speculative demand. With the social attention on cryptocurrencies at a six-year low, it is hard to see this trend reversing in the short term.
In the long run, we believe Solana needs to lead the tokenization of on-chain equity (and other RWAs) to smooth out the extreme cyclicality of its on-chain user base. Given the recent challenges to the Clarity Act, this will still take some time.
2. Real On-Chain Yield
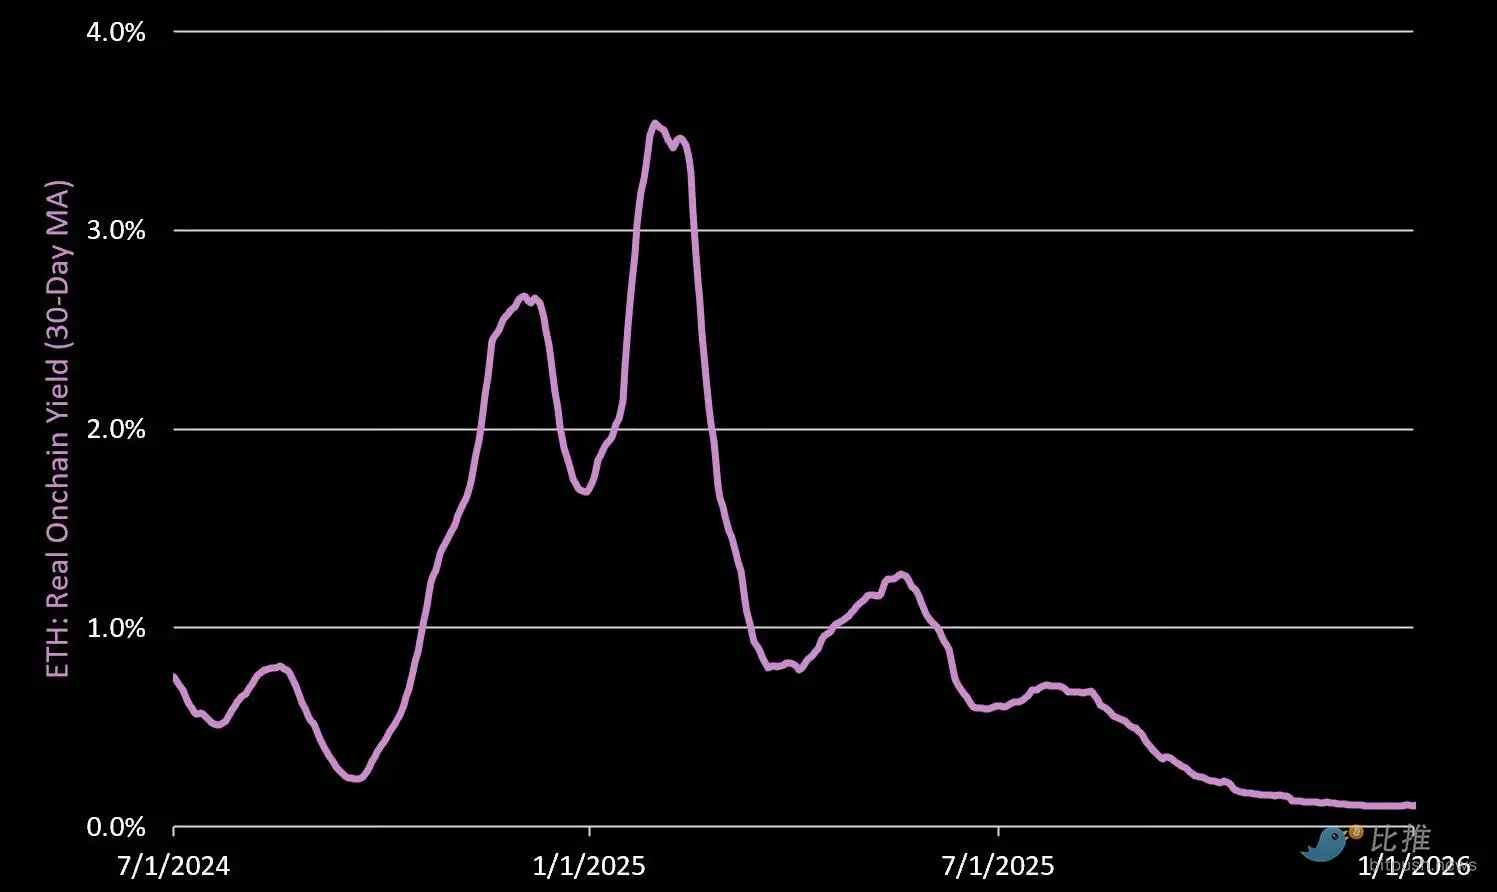
The real on-chain yield (annualized) in Q4 was only 0.46%, a 56% decrease quarter-over-quarter. Of this, 72% came from priority fees, and 28% from MEV. The decline in MEV share reflects a significant weakening of on-chain competition (i.e., speculative demand) this quarter.
3. Total On-Chain Yield
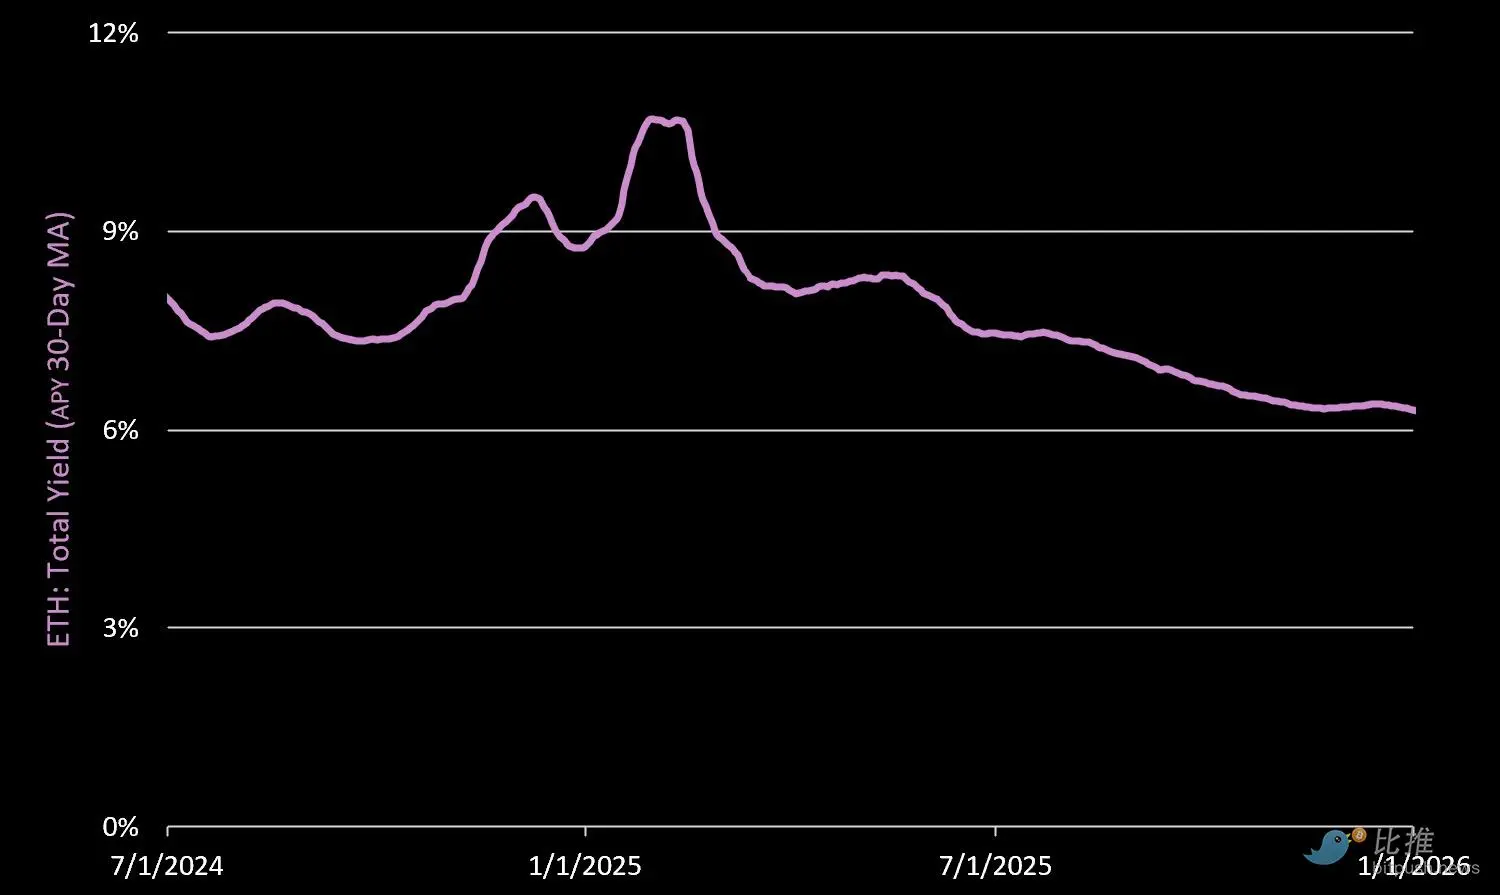
The total annualized yield, including protocol issuance rewards, was 6.7%. Notably, 93% of the yield came from new coin issuance of SOL. Due to a 55% decline in priority fees and MEV, the total yield fell from 7.64% in Q3.
II. Network Fundamentals: Challenges of Efficiency
1. Monthly Network GDP
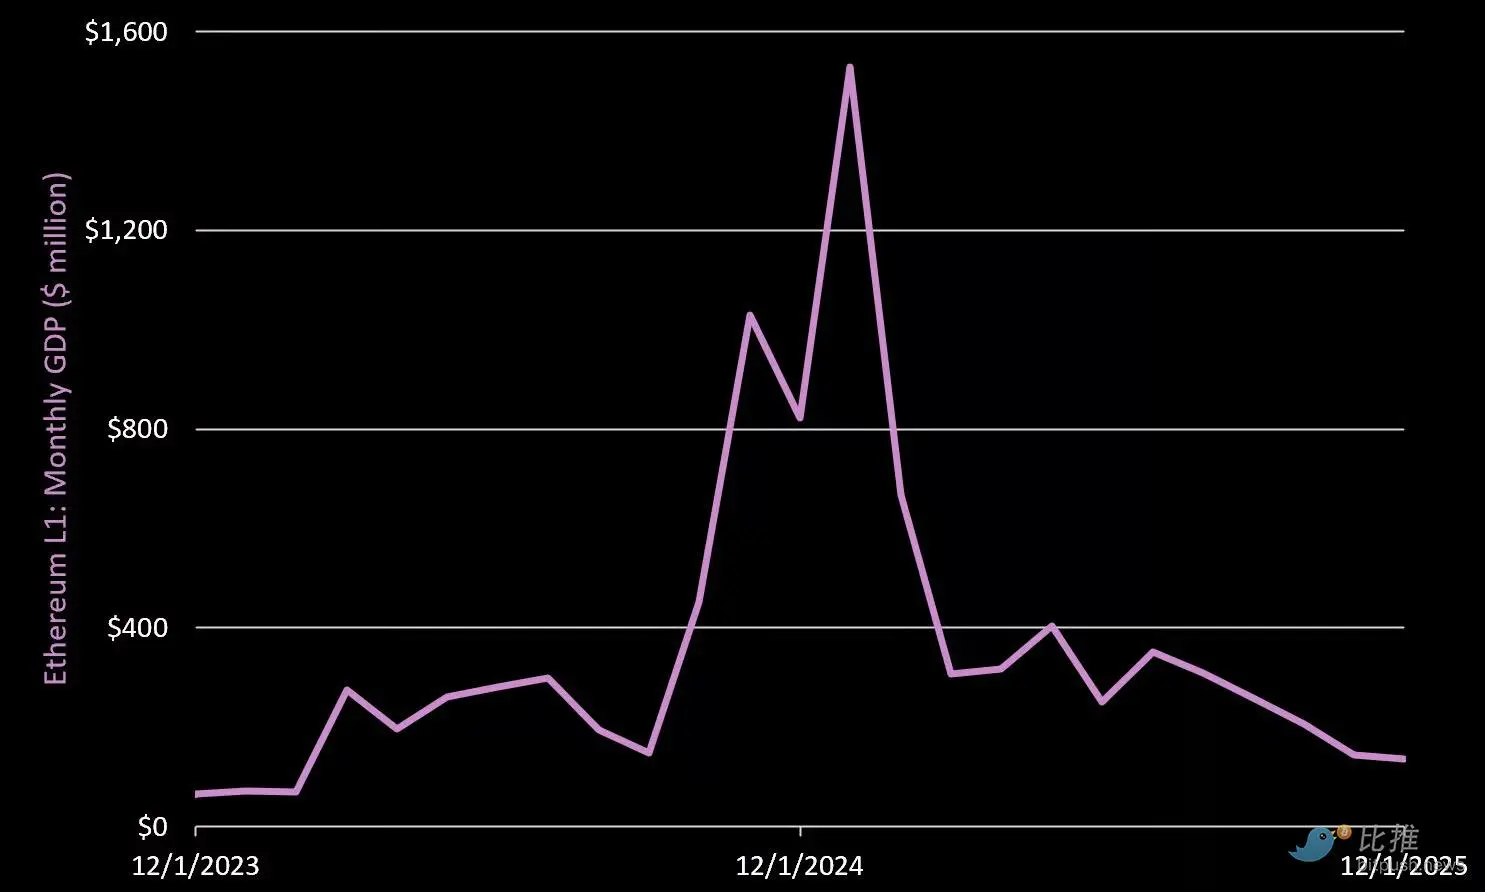
Note: GDP refers to the total fees generated by top on-chain applications (excluding fees for the public chain itself).
The GDP generated by top applications in Q4 was $485 million, a 47% decrease quarter-over-quarter.
- Pump.fun: $96 million (down 19% in Q4)
- Circle: $85 million (up 6% in Q4)
- Axiom: $55 million (down 61% in Q4)
- Raydium: $31 million (down 79% in Q4)
In comparison, Ethereum L1 applications generated $2.3 billion in GDP in Q4.
2. Active Addresses and Staking
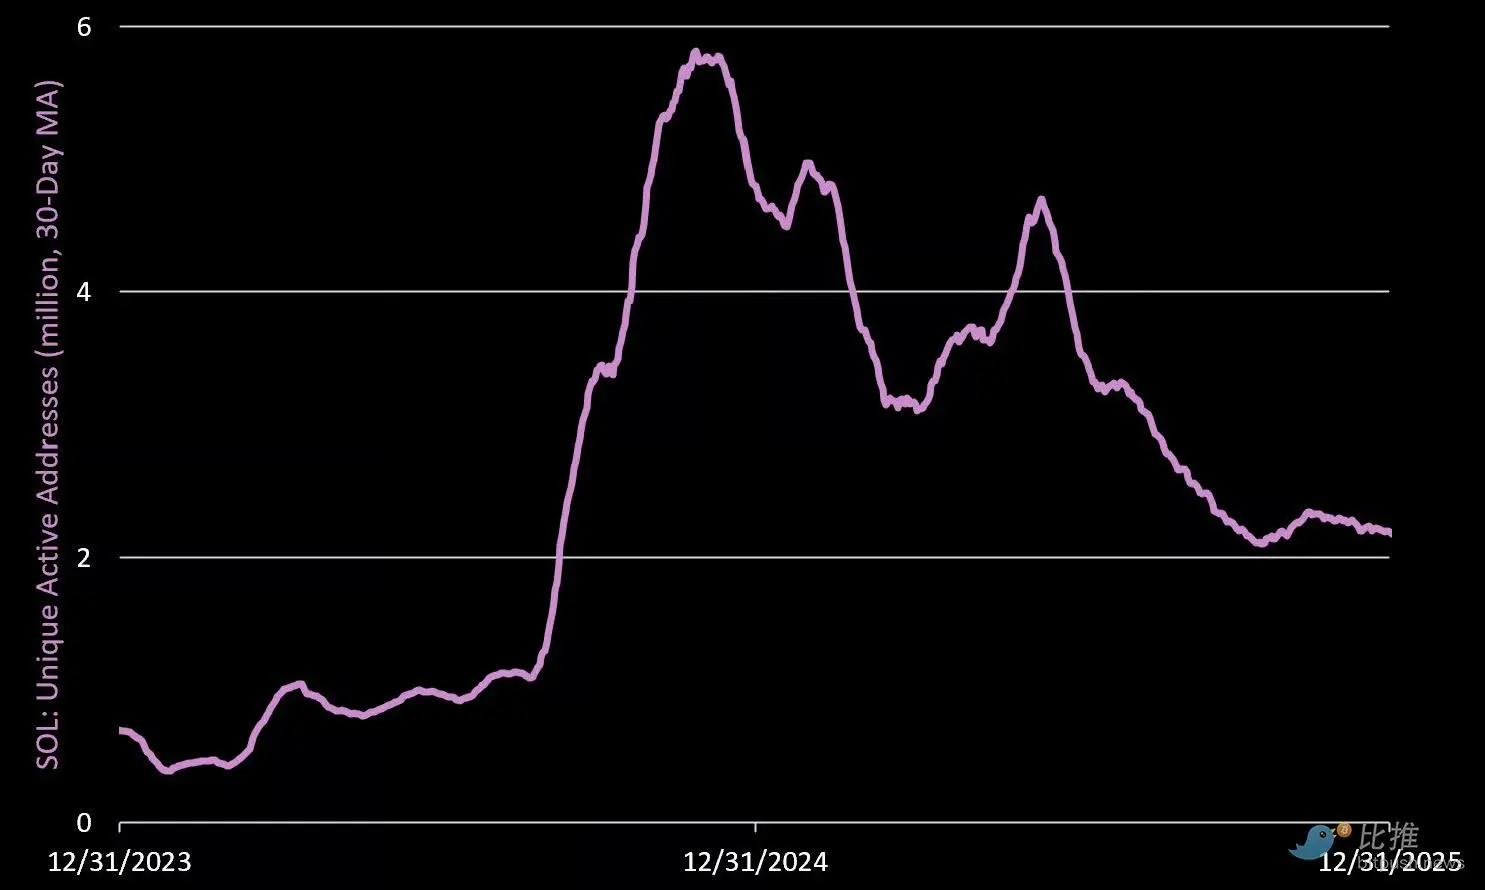
Active Addresses: The average daily active addresses in Q4 were 2.2 million, a 19% decrease quarter-over-quarter.
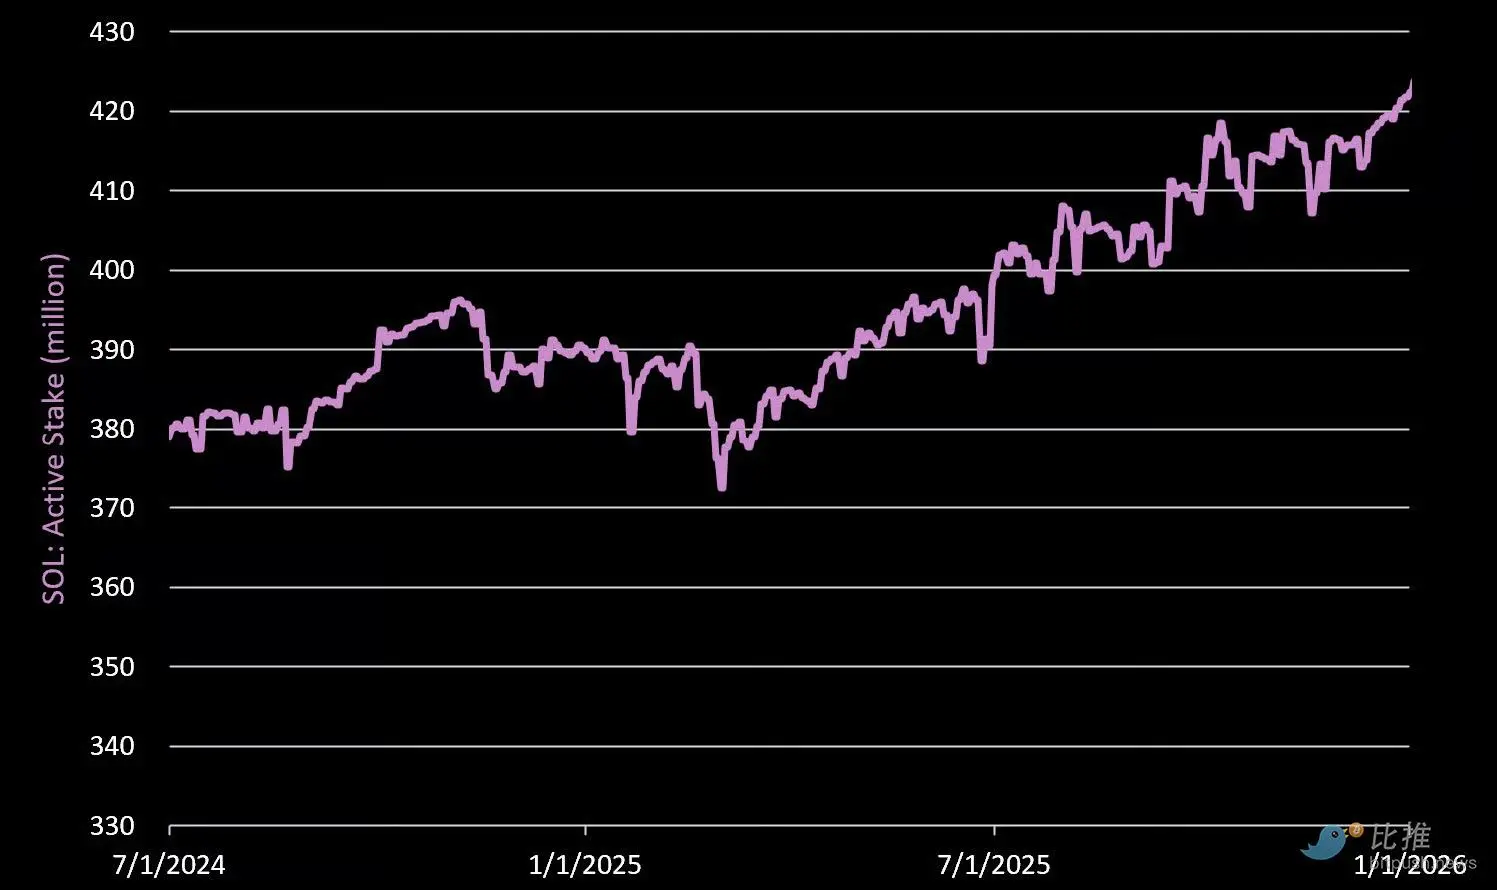
Active Staking: As of December 31, 2025, a total of 421.7 million SOL were staked (75% of circulating supply), a 3.5% increase quarter-over-quarter.
3. Cost of Producing $1 REV
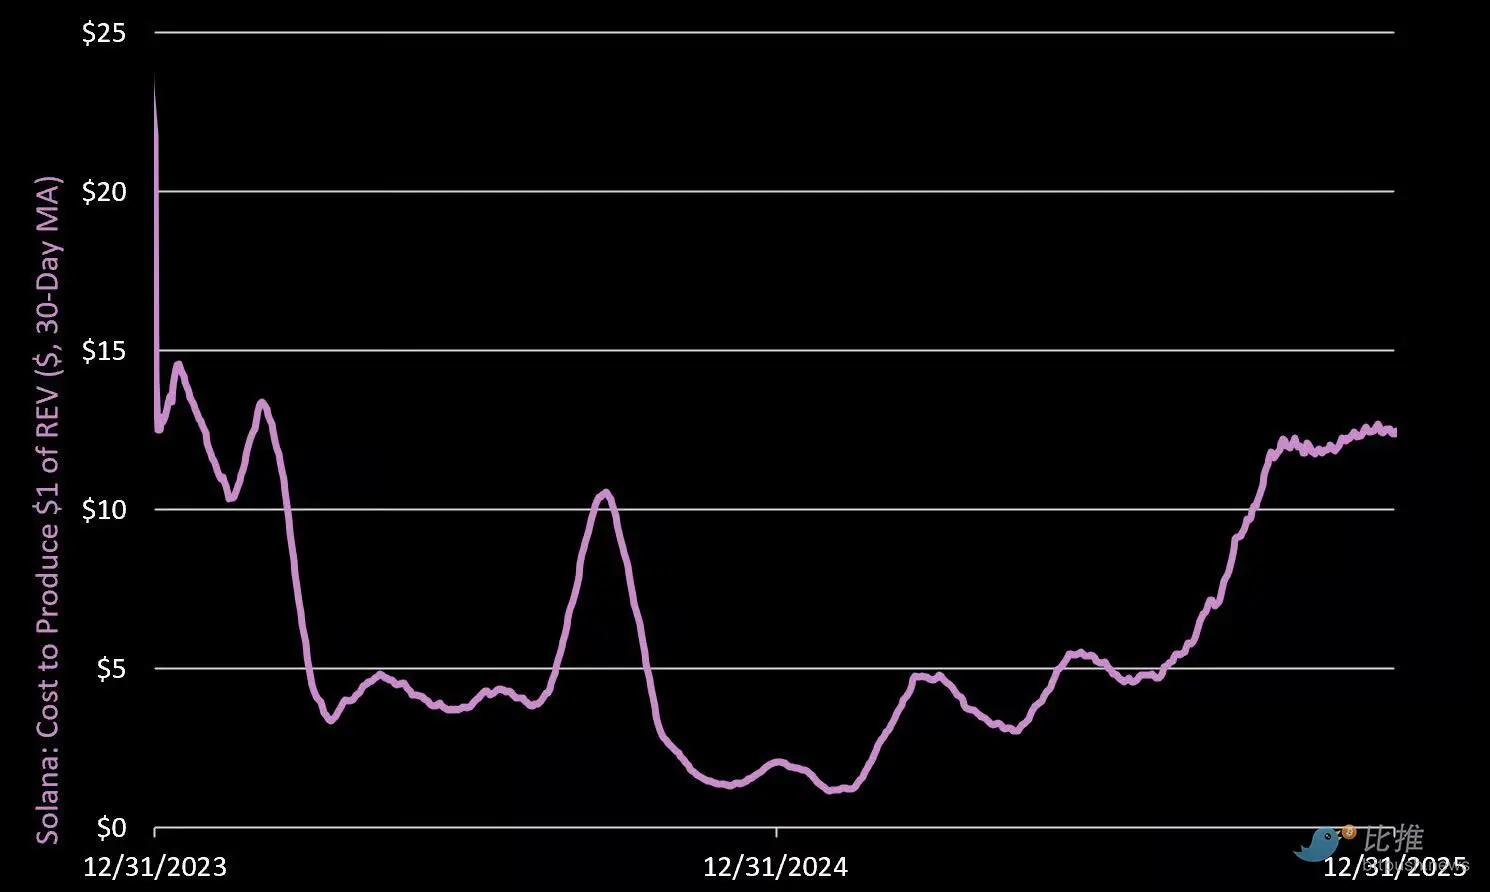
The average cost to produce $1 of real economic value in Q4 rose to $11.76, a staggering 105% increase quarter-over-quarter.
What does this mean? It indicates that to maintain network security, the inflation cost (issuance) relative to the actual value produced is rising. If we compare Solana to a company, it is now time to cut management costs and reduce expenses.
III. Stablecoins
Stablecoin Supply
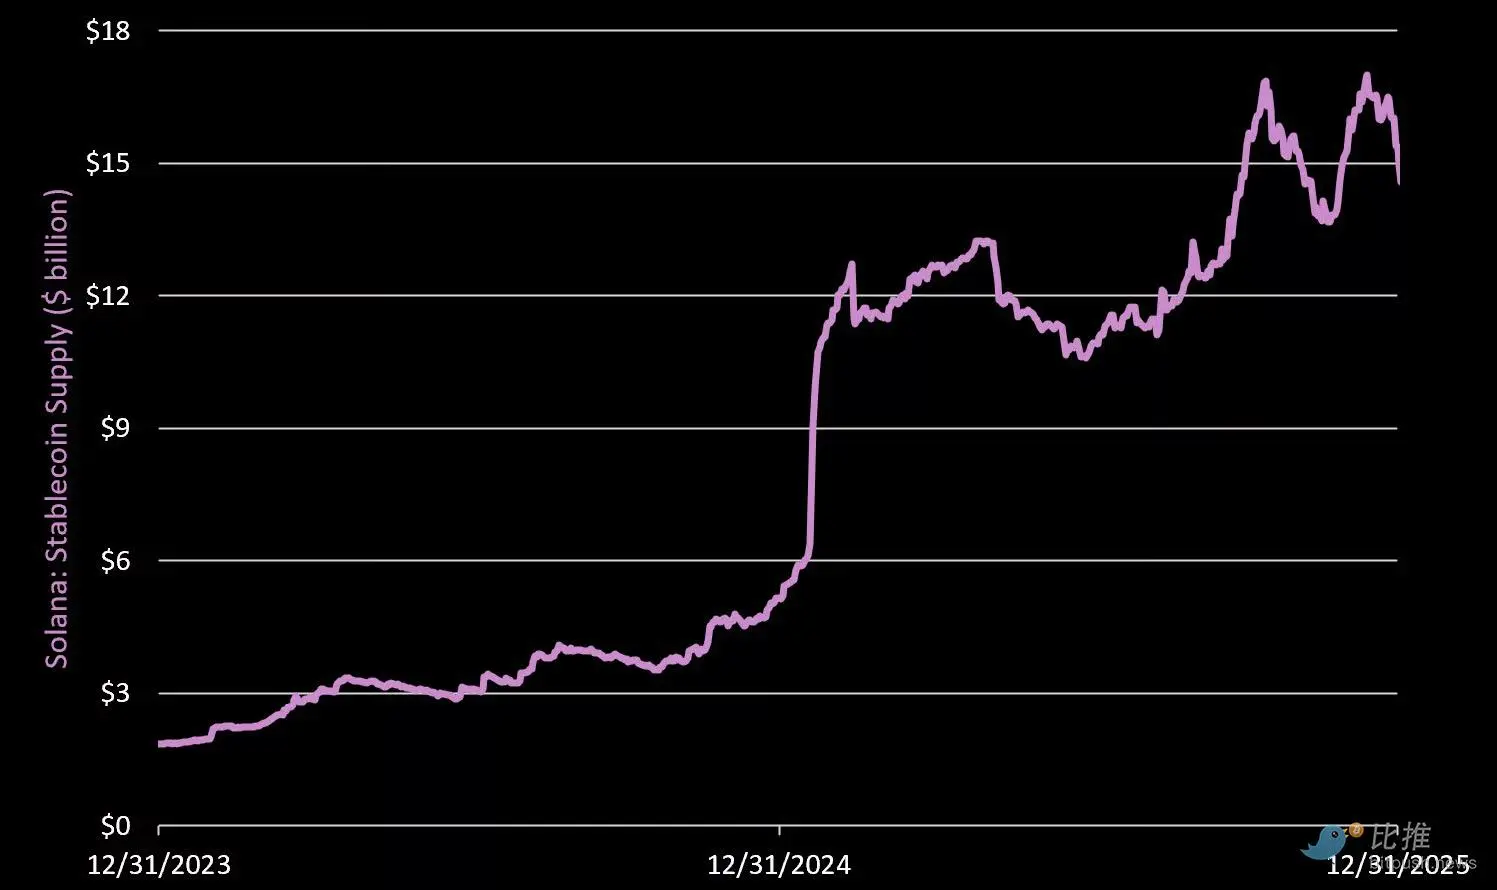
The total on-chain stablecoin supply reached $15.4 billion, a 4.4% increase quarter-over-quarter. This accounts for 5% of the total stablecoin supply in the crypto market, ranking behind Ethereum, Tron, and BNB. Major issuers:
- Circle/USDC: $9.9 billion (down 1% in Q4)
- Tether/USDT: $2.1 billion (down 10% in Q4)
- Paypal/USDPY: $870 million (up 95% in Q4)
- Paxos/USDG: $870 million (up 80% in Q4)
- Solstice/USX: $306 million (up 83% in Q4)
Effective Stablecoin Turnover Rate
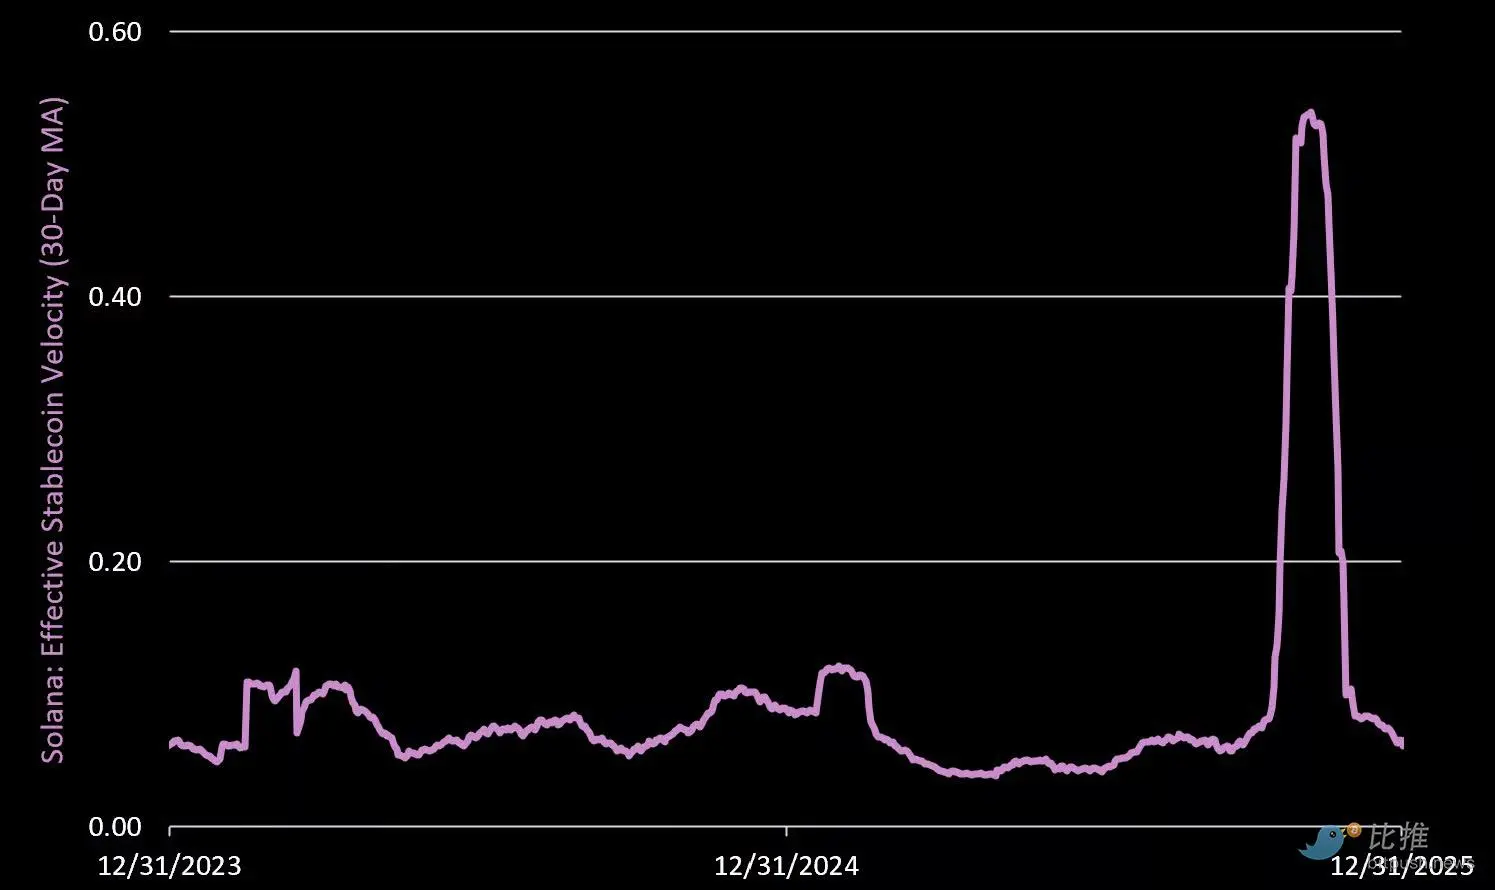
The effective stablecoin turnover rate measures the daily turnover rate of each dollar of stablecoin on-chain. This metric filters out noise from wash trading and circular trading, with the measurement formula being: daily net dollar transfer / circulating supply. An increase in value indicates increased economic activity.
The average turnover rate in Q4 was 0.22, a 282% increase quarter-over-quarter. However, this growth was largely attributed to the volatility during the 10/10 liquidation event.
A reading of 0.22 means that 22% of the stablecoin supply turned over during the quarter. For reference, the turnover rate for Ethereum L1 in Q4 was 3%, and the overall turnover rate for Ethereum L2 was 5%.
Net Dilution Rate
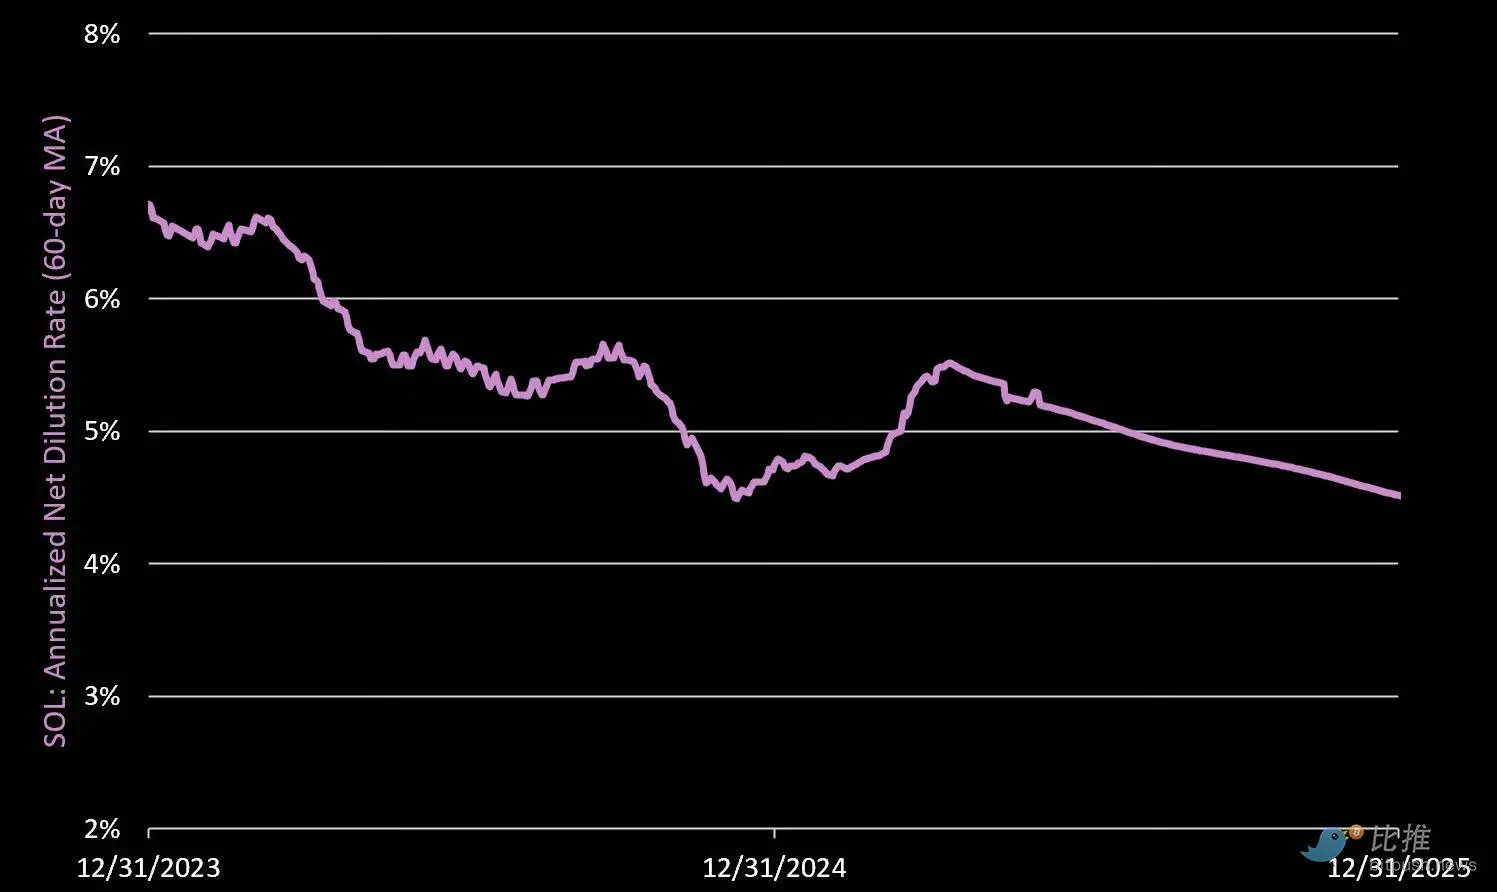
Net Dilution Rate = Daily protocol issuance minus destroyed SOL / circulating supply (annualized). A positive value represents dilution for non-staked SOL holders.
The annualized net dilution rate for Q4 was 4.57%, a 5.5% decrease quarter-over-quarter. Driving factors:
- SOL Issuance: 6.45 million in Q4 (6.8 million in Q3)
- SOL Destruction: 63,764 in Q4 (76,247 in Q3)
- Net Result: 6.38 million SOL added in Q4 (annualized inflation rate of 4.57%)
IV. DeFi: The Rise of Private DEX
DEX Trading Volume
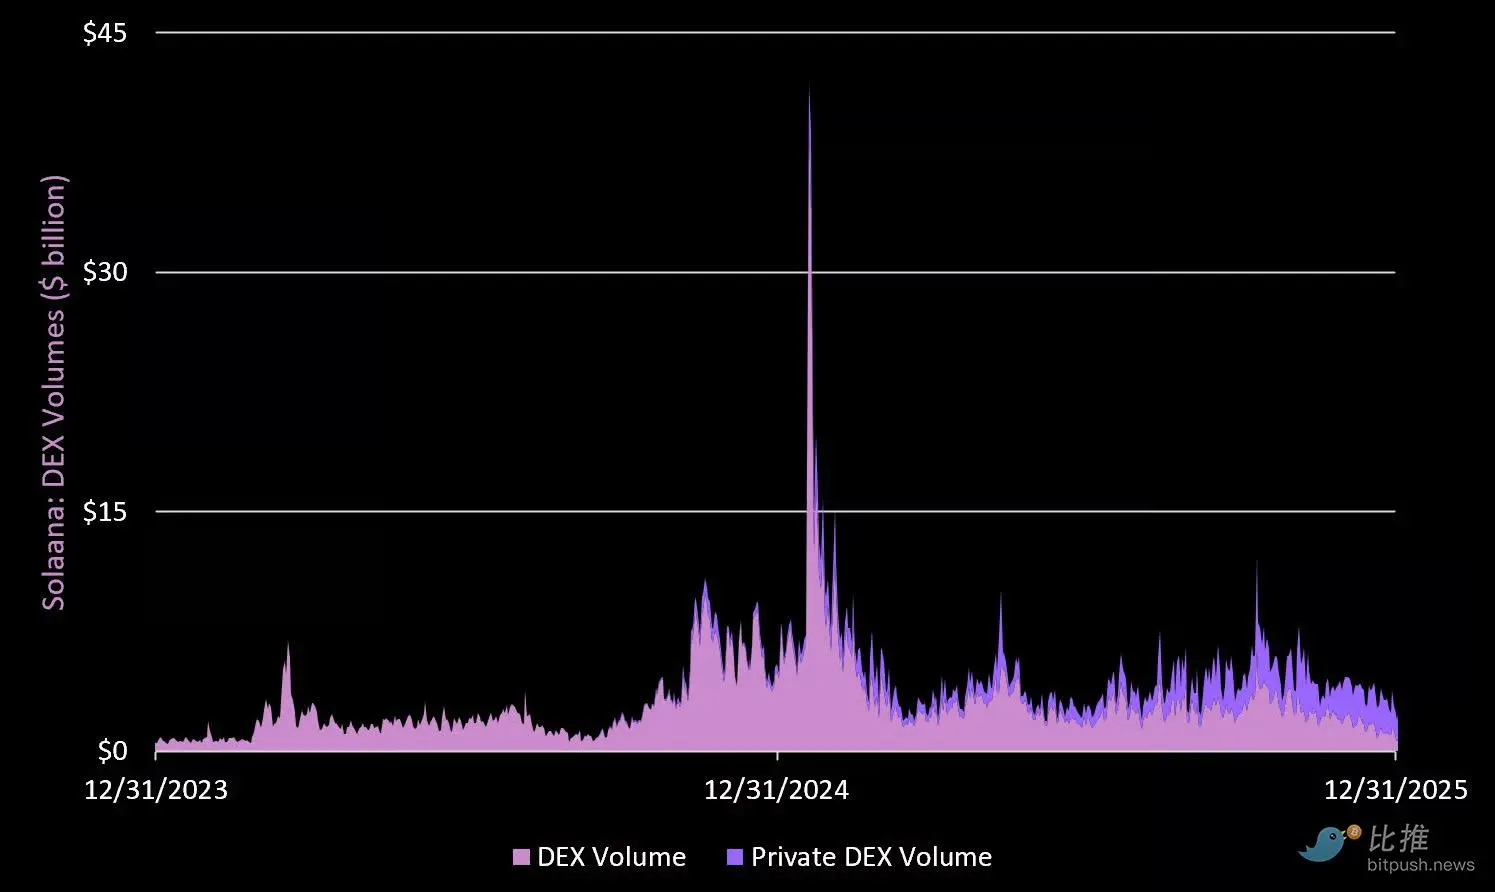
Private DEXs on Solana witnessed tremendous growth. The average daily trading volume was $2.2 billion (48% of the total), a 50% increase quarter-over-quarter.
Meanwhile, public DEXs had an average daily trading volume of $2.5 billion in Q3, a 5% increase. Overall, total DEX trading volume grew by 15% this quarter. The leading DEXs by trading volume:
- HumidiFi (Private): $1.4 billion/day (up 105% in Q4)
- Raydium: $985 million/day (up 6% in Q4)
- Meteora: $700 million/day (up 27% in Q4)
- Orca: $473 million/day (down 24% in Q4)
- Tessera (Private): $303 million/day (up 57% in Q4)
- Pump Fun: $88 million/day (down 24% in Q4)
DeFi Velocity
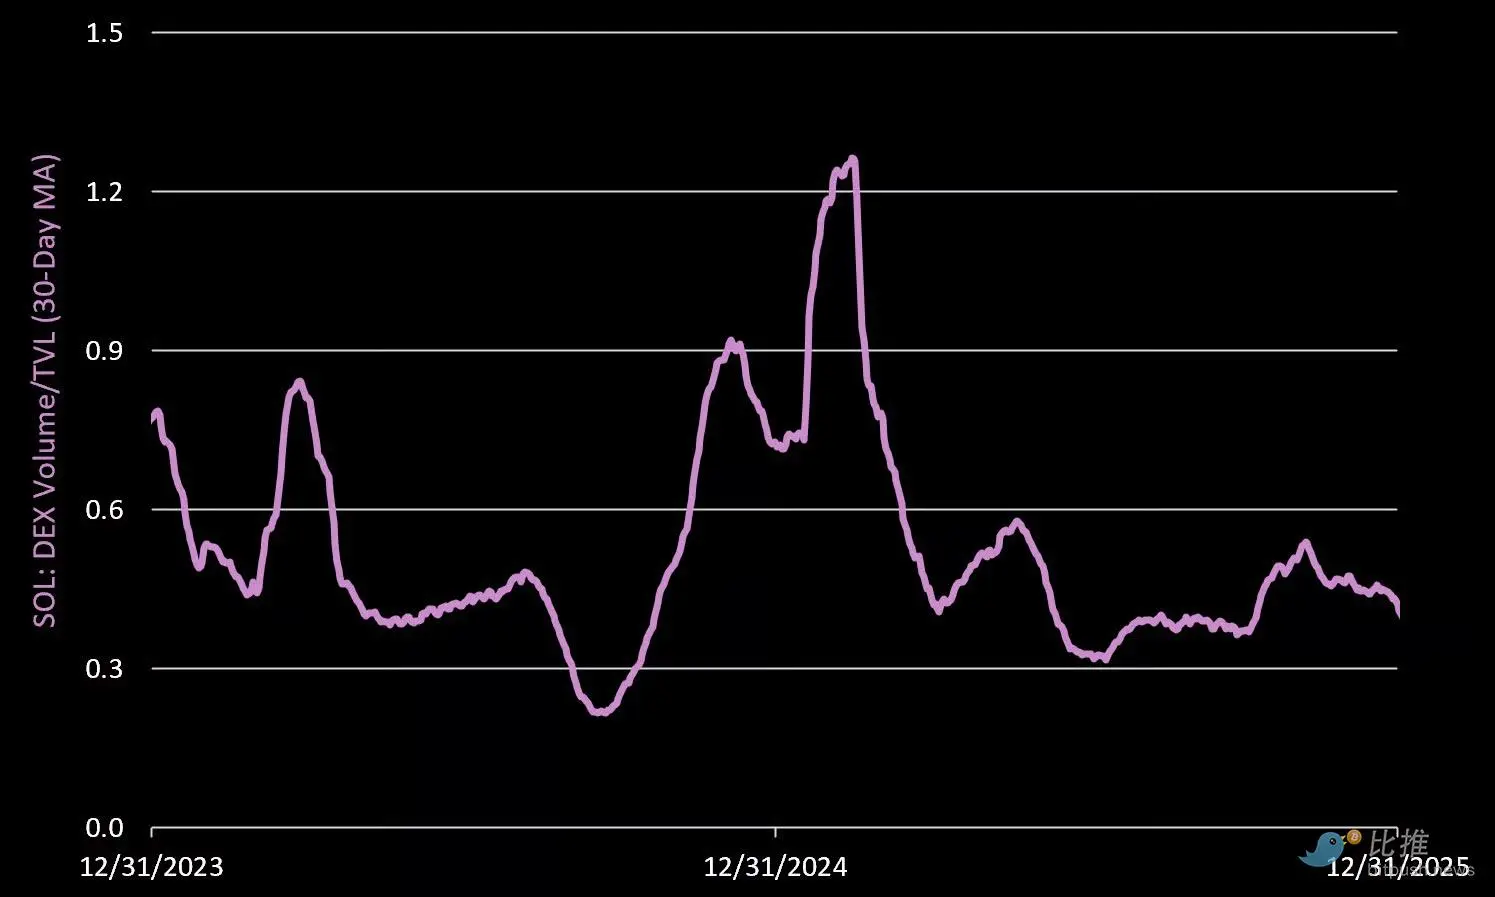
Measuring the turnover rate per dollar within DeFi protocols. The Q4 metric increased by 22%, with an average daily turnover rate of 46% of TVL. Most of the activity was attributed to the extreme volatility during the 10/10 liquidation event.
Newly Created Trading Tokens
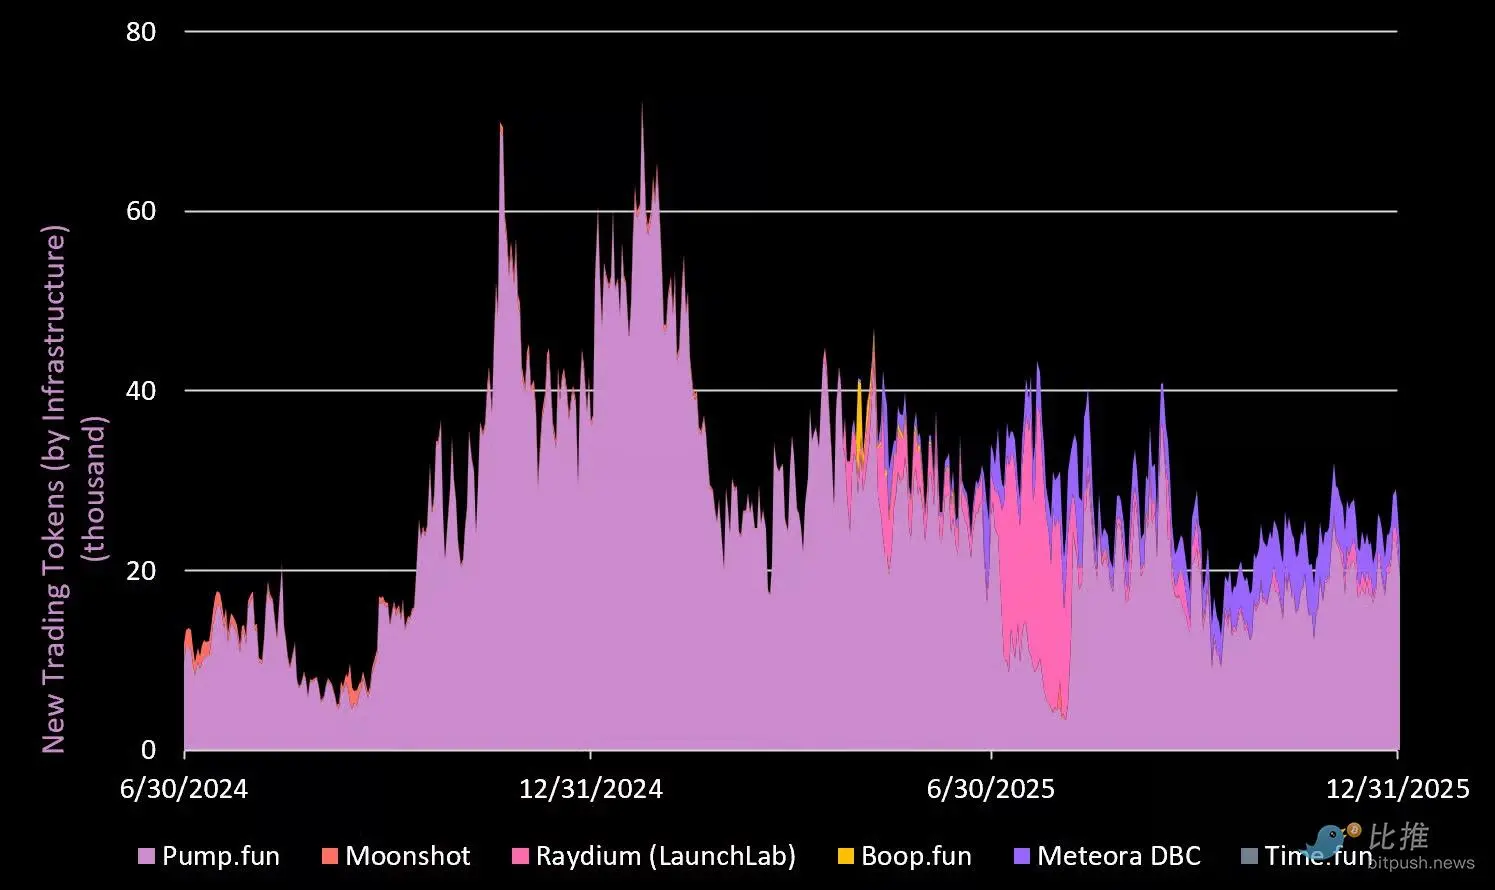 In Q4, a total of 2.1 million tokens were created on the Solana launch platform, a 24% decrease quarter-over-quarter.
Pump Fun continues to lead with 1.6 million new coins (75% market share).
Meteora was a highlight in Q4, growing by 18% and capturing a 21% share.
V. Fair Value
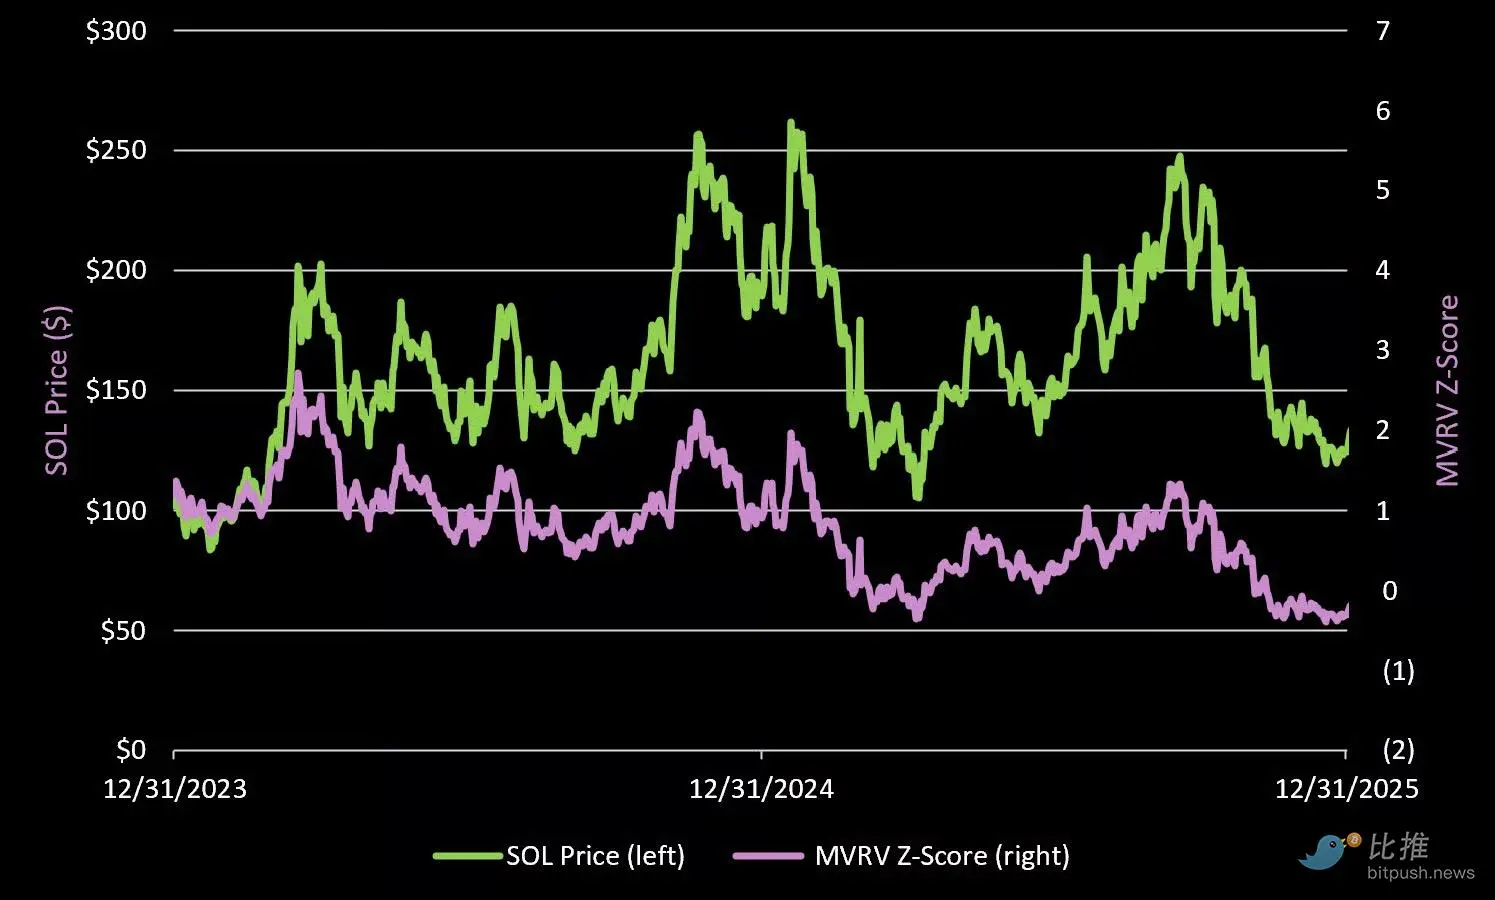
From a valuation perspective, SOL currently has an MVRV of 0.95, indicating its price is below the realized price (approximately $145).
In terms of "fair value," SOL's current trading price is below its realized price of $145 (Realized Price, an alternative metric for the cost basis of all tokens held on the network), with an MVRV of 0.95. At the bottom of the bear market in 2022, SOL fell to 22% of the realized price.
While we do not expect this cycle to repeat, we do believe that SOL will significantly dip below the realized price at some point, with a target range between $90 and $110.
200-Week Moving Average
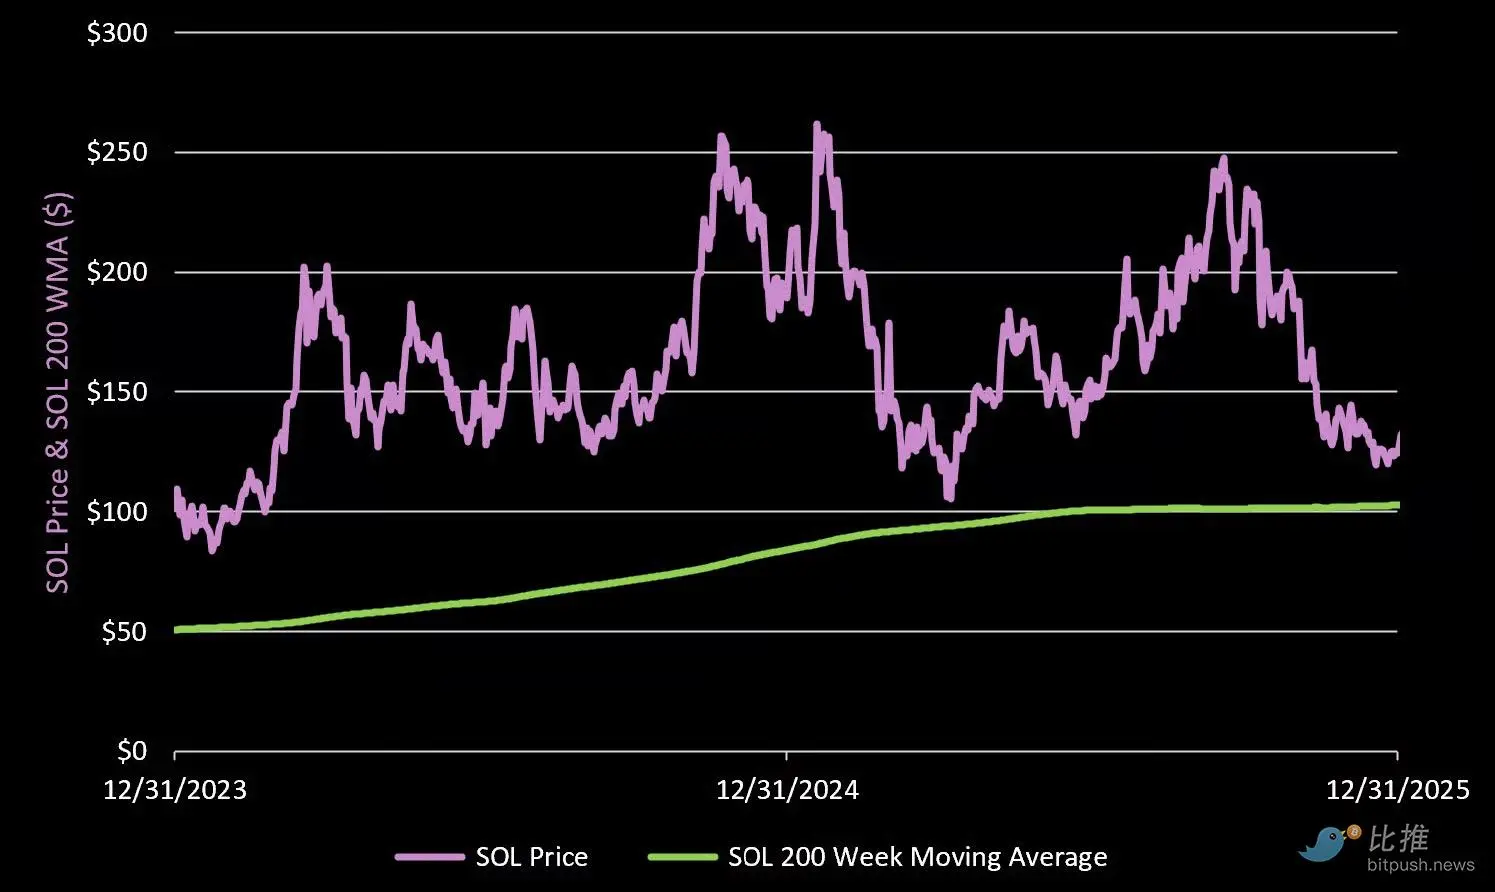
We also anticipate that SOL will at some point retest the long-term 200-week moving average, currently at $103.
VI. Conclusion: Three Keys to Returning to the Peak
Solana has emerged from the darkest moments at the end of 2022, proving that it not only survived but has become stronger than ever. However, to continue maturing, it must accomplish the following three points:
- Deepen consumer/retail trading: Stop mentioning "chain games"; the most genuine "game" in cryptocurrency right now is retail trading. Solana needs to innovate in protecting users from sniper attacks and combating "rug pull" projects.
- Embrace TradFi: Since the goal is to be the "Nasdaq on the blockchain," real stock and bond assets are needed.
- Win the developer war: Continuously provide resources to global developers to maintain a leading edge in technological iteration.
We reverse bought Solana at the end of 2022/early 2023, establishing a core position cost of $15.39, and exited with over 10 times profit at the end of 2024/early 2025. Now we are patiently waiting for the next "perfect pitch."
免责声明:本文章仅代表作者个人观点,不代表本平台的立场和观点。本文章仅供信息分享,不构成对任何人的任何投资建议。用户与作者之间的任何争议,与本平台无关。如网页中刊载的文章或图片涉及侵权,请提供相关的权利证明和身份证明发送邮件到support@aicoin.com,本平台相关工作人员将会进行核查。


