Right now, XRP is specifically exhibiting a disconnect that does not go unnoticed: the value passing through the ledger is decreasing, while activity on it is increasing. The XRP Ledger's payment volume continues to rise, suggesting increased usage of the network. At the same time, there has been a significant decline in the overall volume of payments, which means that the average value of each transaction has decreased.
XRP's disparency
This typically indicates a change in the users of the network. The ledger is shifting away from large value transfers and toward smaller, more dispersed transactions. Retail usage, internal routing, automated payments or operational flows, rather than whales pushing money around, can all contribute to that.
Although it is not intrinsically bullish or bearish, it does indicate that speculative capital is not yet making large commitments. This hesitation is nearly perfectly reflected in price action. The 50 and 100 EMAs are serving as strong overhead resistance, and XRP is still trapped below important moving averages. Every push higher is swiftly sold into, indicating that supply is still active above present levels.
HOT Stories Crypto Market Review: XRP Market Anomalies, Ethereum at $3,300 Inflection Point, Shiba Inu Trillion-Unit PotentialKashkari: Crypto Is ‘Basically Useless’ U.Today Crypto Digest: XRP Jumps 1,122% in Liquidation Imbalance, Peter Brandt Predicts Historic Bitcoin Breakout, Ethereum Holder Bitmine Hits $14 Billion MilestoneMorning Crypto Report: 145,214,184,927 Shiba Inu (SHIB) Mystery Stuns Robinhood, $30 Million XRP Whale Turns into Aggressive Short Seller, $96,000 Bitcoin Triggers 1,000% Liquidation Imbalance
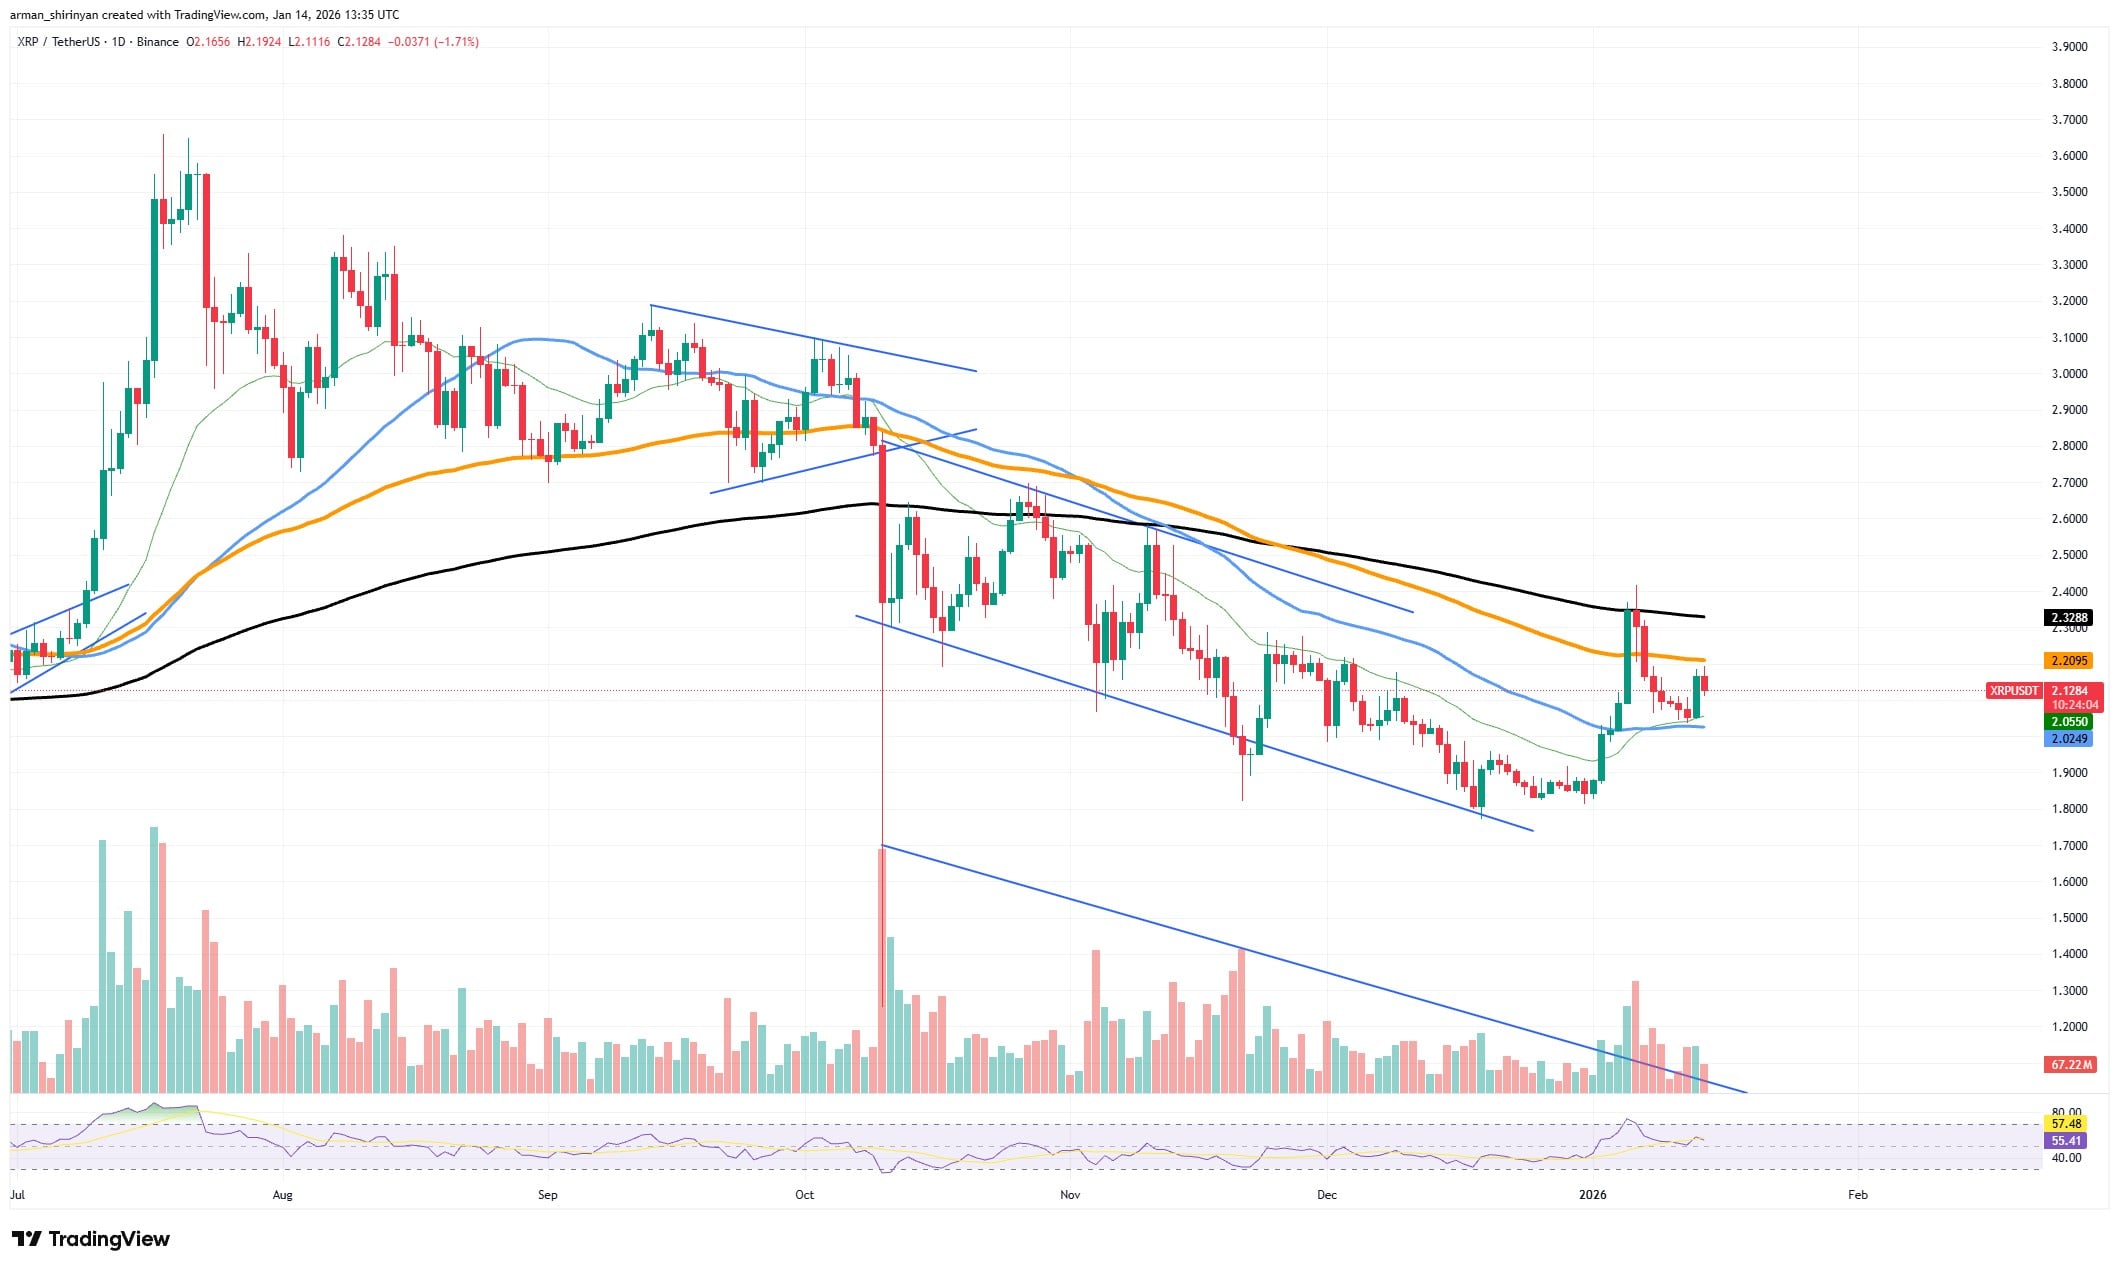
XRP/USDT Chart by TradingView
Although there was some strength in the recent recovery from local lows, follow-through stalled when XRP encountered structural resistance from the previous decline. The lack of conviction is supported by the volume on the chart. Although there have been sporadic spikes, overall trading volume has been falling along with price, indicating that neither buyers nor sellers are panicking.
This equilibrium is reinforced when the RSI is in the neutral range, momentum is not dead, but it is also not accelerating. The anomaly is significant because consistent increases in the number of payments typically precede a change in market behavior, but only if value begins to follow usage.
The ledger is busy right now, but the capital is wary. Either volume returns and the price reacts sharply, or the transaction count rolls over and validates the larger downtrend; these are the two common ways that this disconnect is resolved. This is not a chase but a wait-and-see period for investors. Upside is limited as long as XRP is trading below its main EMAs.
Ethereum's key metric
For once, Ethereum is at a level that truly matters. It is not a coincidence that the price is directly below the 100 EMA at about $3,300. The market is now compelled to make a choice rather than drifting sideways because this zone has consistently rejected upside attempts. ETH is compressing technically.
Following the November-December sell-off, the price began to grind upward inside a rising structure after carving out a higher low. The 100 EMA, which traditionally serves as a trend-defining filter, is precisely where that recovery stalled. The overall structure is still bearish-to-neutral, not bullish, as long as Ethereum stays below it.
You Might Also Like
Wed, 01/14/2026 - 12:12 Morning Crypto Report: 145,214,184,927 Shiba Inu (SHIB) Mystery Stuns Robinhood, $30 Million XRP Whale Turns into Aggressive Short Seller, $96,000 Bitcoin Triggers 1,000% Liquidation ImbalanceByGamza Khanzadaev
The issue is straightforward. Here, ETH cannot afford to be rejected once more. The structure would turn back in favor of buyers if there were a clear break above $3,300 and acceptance above the 100 EMA. This would render the lower-high sequence invalid and provide access to the $3,500-$3,700 range, which is where previous liquidity is located. In the absence of that breakout, this move is merely a correctional bounce within a broader downtrend. Signals from volume are inconsistent.
Although participation in recent green candles has improved, it is still insufficient to decisively overcome sell pressure at resistance. Although it is not overheated, the RSI is moving toward the upper half of its range, indicating that momentum is increasing. An inflection point looks like this: neither side is in complete control just yet.
The downside risk increases rapidly if Ethereum fails here and loses the short-term rising support. The price may return to the $3,000 psychological level; if the 100 EMA is rejected below that, the $2,800-$2,900 demand zone resumes. That would drastically reset sentiment and erase weeks of recovery.
Shiba Inu's structure normalizes
Technically speaking, Shiba Inu is still trading in a weak structure, but something significant is subtly emerging. On-chain activity is beginning to suggest a potential long-term shift rather than a short-term pump, even though the price is still capped under significant moving averages.
Exchange outflow is the most important metric to monitor. SHIB has already displayed spikes in aggressive withdrawals from centralized exchanges during recent sessions. It is reasonable to anticipate that exchange outflows will surpass one trillion SHIB in the near future if this trend continues. Although that figure seems ridiculous, it is precisely the kind of action that is structurally significant for SHIB's supply scale.
Large exchange outflows typically indicate that tokens are being taken out of immediate sell-side liquidity. The impact is the same whether it is whale accumulation, cold storage movement or long-term positioning. Exchanges' available supply decreases and persistent selling pressure wanes. Although it does not immediately raise prices, it does set the stage for a reversal when demand recovers.
You Might Also Like
Tue, 01/13/2026 - 15:32 XRP Rockets 1,122% in Liquidation Imbalance as CPI Delivers Bullish SurpriseByGamza Khanzadaev
SHIB continues to trade below the 100 EMA, which continues to be the primary trend filter and resistance. The market is not yet prepared to reprice SHIB higher, as evidenced by the rapid selling of every attempt to push higher. It would be delusional to act as though this is bullish price behavior. On bullish charts, markets do not, however, bottom.
When selling pressure subsides and the price remains unchanged, they reach their lowest point. Exchange outflows become important at that precise moment. It would indicate absorption rather than distribution if trillion-level SHIB withdrawals occurred while the price was still compressed.
Longer-term reversals begin with a reduction in supply followed by a reaction in price. At this point, SHIB does not need any hype. It requires time and ongoing accumulation off-exchange. SHIB may stealthily move from a downtrend into a base-building phase if exchange balances continue to decline and outflows increase toward the trillion mark.
免责声明:本文章仅代表作者个人观点,不代表本平台的立场和观点。本文章仅供信息分享,不构成对任何人的任何投资建议。用户与作者之间的任何争议,与本平台无关。如网页中刊载的文章或图片涉及侵权,请提供相关的权利证明和身份证明发送邮件到support@aicoin.com,本平台相关工作人员将会进行核查。


