
Author: @clairegu1, Hubble AI
Polymarket is not short of "god-level" addresses that have made single profits of $100,000. However, faced with hundreds of thousands of accounts, a core question has always troubled participants: Is this replicable Alpha, or just unsustainable luck?
The existing leaderboard has serious blind spots: it only shows short-term results and fails to reveal the stability of strategies. To strip away the luck component, we avoided simple leaderboards and directly analyzed 90,000 active addresses on-chain and 2 million settled transactions.
After eliminating the interference of unrealized gains, we discovered four cruel yet real "counterintuitive" rules in the prediction market and redefined the criteria for following trades.
TL;DR
Mid-frequency efficiency trap: The most active retail group (mid-frequency), although having the highest win rate in the network, is limited by capital efficiency and lack of systematic advantages, resulting in a median actual profit close to zero.
Certainty trap: Betting on high-probability events (>0.8) faces extremely asymmetric risk-reward ratios (small profit if winning, zero if losing), leading to a negative long-term expected value.
Golden odds range: True Alpha is highly concentrated in the price range of 0.2 - 0.4. This is the area with the greatest market divergence and the best risk-reward ratio (Odds).
Focus premium: Data shows that "all-round" traders struggle to survive. Vertical domain experts who delve into a few tracks have an average return four times that of diversified traders.
Finding One: Mid-frequency Trading Has the Highest Risk
We categorized addresses into three tiers based on trading frequency:
Low-frequency trading (Low): Average ~0.35 trades per day | Win rate ~40%
Mid-frequency trading (Mid): Average ~3.67 trades per day | Win rate ~43%
High-frequency/Ultra-high-frequency (High/Ultra): Average >14 trades per day | Win rate ~21-26%
On the surface, mid-frequency traders seem to be the market's elite: highest win rate at ~43%; lowest proportion of losing accounts: Loss Ratio is only 50.3%, far below the 77.1% of the High group.
This creates an illusion: as long as one maintains a moderate trading frequency of 3-4 trades per day, steady profits can be achieved.
However, when we introduce PnL (profit and loss) data, the truth emerges:
Median PnL: The mid-frequency group's value is 0.001, almost equal to zero.
What does this mean? It means that for the vast majority of mid-frequency traders, despite studying, betting, and seemingly winning more than losing every day, their account net worth remains stagnant.
In contrast, although high-frequency (High) and ultra-high-frequency (Ultra) have median losses (-0.30 and -1.76), their Mean PnL (average profit and loss) is lifted to +922 and even +2717 by a very small number of top addresses. This indicates that the high-frequency domain is a "battlefield for machines"—surviving through low win rates, high risk-reward ratios, and systematic strategies (like market making and arbitrage), which is a model that ordinary people cannot replicate.
In-depth Attribution: Why Do Mid-frequency Traders Fall into the "Mediocrity Trap"?
Lack of systematic Alpha, reduced to "coin-flipping" players: Mid-frequency traders are mostly active retail investors. A ~43% win rate and near-zero median returns indicate that this group’s overall performance is close to a random walk. They participate in the market based on intuition or fragmented information, and while they avoid significant drawdowns like high-frequency bots due to strategy failures, they also fail to establish a true moat. They are repeatedly participating in the market rather than profiting from it.
Survivor bias obscures tail risks: The average PnL (+915) of mid-frequency traders shows a huge gap with the median PnL (-0.001). This indicates extreme polarization within the mid-frequency group. A very small number of "big players" with core insider information or exceptional judgment raise the average, while more than 50% of the rest are engaged in futile efforts.
High-frequency is unlearnable, low-frequency is insufficient: Ordinary users cannot replicate the systematic high-frequency strategies of the High/Ultra tier (high technical barriers, low win rates, high psychological pressure), yet they are unwilling to settle for the extremely low hit rate of the Low tier. As a result, a large amount of capital and effort accumulates in the Mid tier, making it the most crowded, intensely competitive, and filled with mediocrity "red sea."
Practical Insight: Data reveals a harsh truth: if you merely become a "diligent mid-frequency trader," the likely outcome is wasted effort. The real value lies not in mimicking the average behavior of "mid-frequency" traders but in identifying differences.
Avoid pitfalls: The vast majority of mid-frequency addresses are merely performing Brownian motion, with no value for following trades.
Mining: True Alpha is hidden in the right tail of the mid-frequency group—those few who outperform the "zero-gravity" at the same frequency.
This is the core value of the following trade tool we developed: to help you skip the "long-term mid-frequency but without advantages" trial-and-error phase, using algorithms to directly lock in that 1% of truly excess-return-generating Alpha addresses from the vast pool of mediocre mid-frequency traders.
Finding Two: "Picking Up Pennies" and "Lottery Betting" Will Ultimately Go to Zero
We stratified traders' risk preferences based on holding prices and discovered a harsh reality: whether buying "lottery tickets" (0.2) or only betting on "certainty" (>0.9), in the long run, both are losers.
We defined three typical strategies:
High certainty strategy (Consensus Betting): Positions concentrated at >0.9, specifically targeting "almost certain" events.
High odds strategy (Long-shot Betting): Positions concentrated at 0.2, specifically betting on low-probability underdogs.
Mixed strategy (Dynamic Strategy): Balanced position distribution, not fixated on extreme odds.
The data presents a significant profit gap:
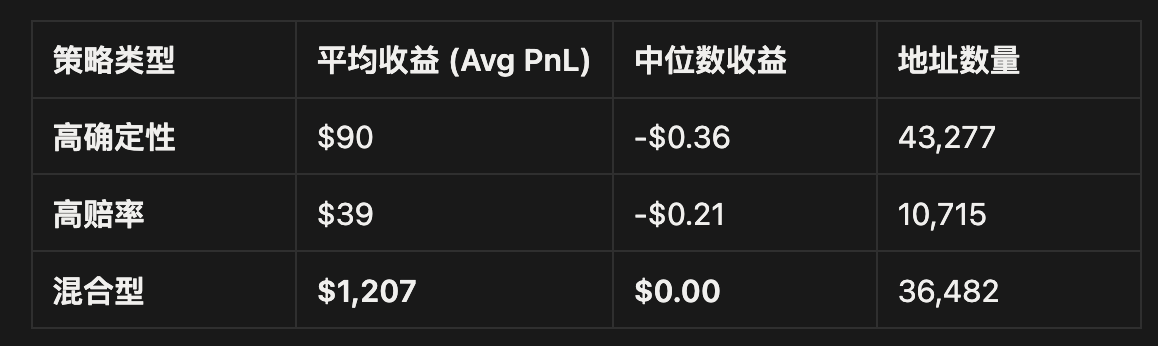
Data Interpretation: The average return of the mixed strategy is 13 times that of the high certainty strategy. Notably, the median returns for all groups are ≤0. This means that even in the best-performing mixed group, profits are highly concentrated among top players, and the vast majority do not outperform transaction fees.
1. Why Does Betting on "Certainty" Fail?
Intuitively, buying into a 0.95 "sure win" seems low risk. However, from a financial mathematics perspective, this is a poor trade:
Extremely asymmetric downside risk: Entering at 0.95 means risking 1.0 of principal to gain 0.05 of profit. If a black swan event occurs (e.g., Biden suddenly withdraws from the election, or a game is reversed in the last minute), a single event's total loss requires you to make 19 correct trades in a row to break even. Over a long period, the probability of black swan events often exceeds 5%.
Alpha exhaustion: When the price reaches >0.9, market consensus has already formed. Entering at this point essentially means taking over from early movers, with no information advantage left.
2. The "Lottery Trap" of High Odds Strategies
Betting on low-probability events at 0.2 also performs poorly due to:
Overestimation bias: Retail investors often overestimate their ability to capture "underdogs." In an effective prediction market, prices usually incorporate most implied information. Long-term purchases of "lottery tickets" that are correctly priced by the market will inevitably lead to a gradual erosion of principal.
Inefficient capital: Although the profit multiples per trade are high, the extremely low win rate leads to prolonged capital drawdowns, making it difficult to form a compounding effect.
Practical Insight (Actionable Insight): Reject "one-track" traders. When selecting follow trade targets, avoid addresses with extreme price distributions (all red or all green). True Alpha players are characterized by strategic flexibility—they will bet on divergences at 0.3 and take profits at 0.8, rather than mechanically sticking to a certain odds range.
Finding Three: The Optimal Risk Range is 0.2-0.4
We stratified addresses based on average buying costs (Implied Probability) to seek the "sweet spot" with the highest risk-adjusted returns.
The data reveals a clear non-linear return distribution: true Alpha does not exist at the extremes but is concentrated in the price range of 0.2 - 0.4.
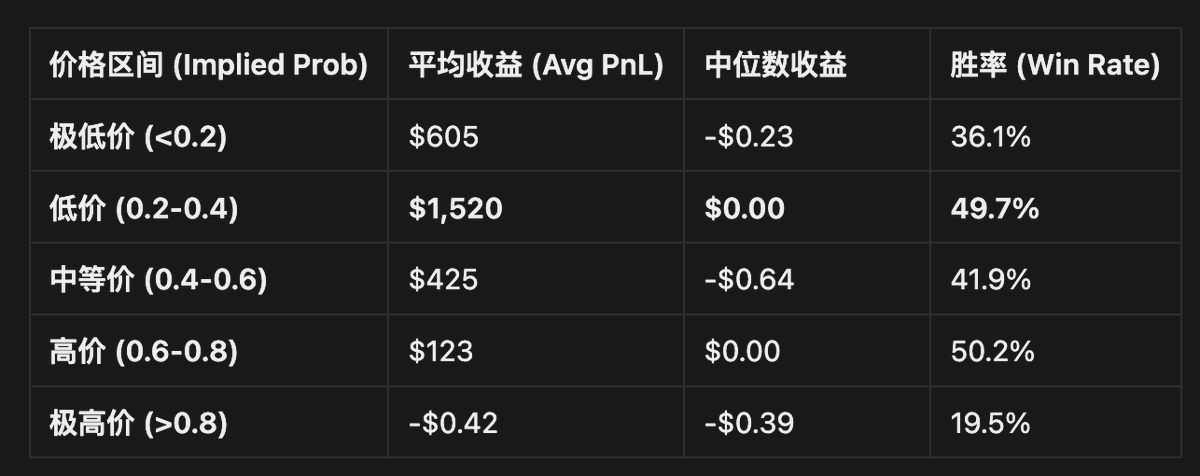
Comparison of performance across price ranges:
In-depth Insight: Why is 0.2-0.4 the Most Profitable?
1. Capturing "Pricing Divergence" (Trading the Divergence)
Buying at prices between 0.2-0.4 means the market consensus believes the probability of the event occurring is only 20%-40%.
Traders who consistently profit in this range are essentially engaging in "cognitive arbitrage." They can identify events that are undervalued by public sentiment (e.g., the market is overly pessimistic and misjudges a candidate's chance of a comeback). Compared to simply following consensus (buying >0.8), betting on divergences, once validated, can yield explosive returns of 2.5 to 5 times.
2. Perfect "Asymmetric Return Structure" (Asymmetric Risk/Reward)
In the >0.8 range (certainty trap): Investors face poor odds of "small profit if winning, zero if losing." As the data shows, the average return in this range is negative, with a win rate of only 19.5% (meaning most who buy >0.8 ultimately fall victim to black swan events).
In the 0.2-0.4 range (Alpha comfort zone): This is a range with "convexity." Downside risk is locked (principal), while upside returns are elastic. Excellent traders in this range maximize returns through the dual advantages of high win rates (49.7%) and high odds.
Avoid the "Lottery Trap" (0.2): Although the theoretical odds in the extremely low price range are the highest, data shows that its performance is far inferior to the 0.2-0.4 range. This indicates that events at 0.2 are often true "garbage time" or pure noise, and excessively betting on extremely low-probability events lacks statistically positive expected value.
Practical Insight (Actionable Insight): Focus on "divergence hunters." When selecting follow trade targets, prioritize traders whose average buying price remains long-term in the 0.2 - 0.4 range. This data characteristic indicates that the account neither blindly chases high-risk lottery tickets nor picks up pennies in the low-odds consensus area, but instead focuses on finding value vacuums where market pricing fails. This is the core capability worth replicating.
Finding Four: Concentrated Strategies Outperform Diversified Strategies
We calculated the Focus Ratio (Total Trades / Number of Markets) for each address and divided them into two categories:
Diversified Strategy: Participates in many markets, with fewer trades per market
Concentrated Strategy: Focuses on a few markets, with more trades per market
The results show:
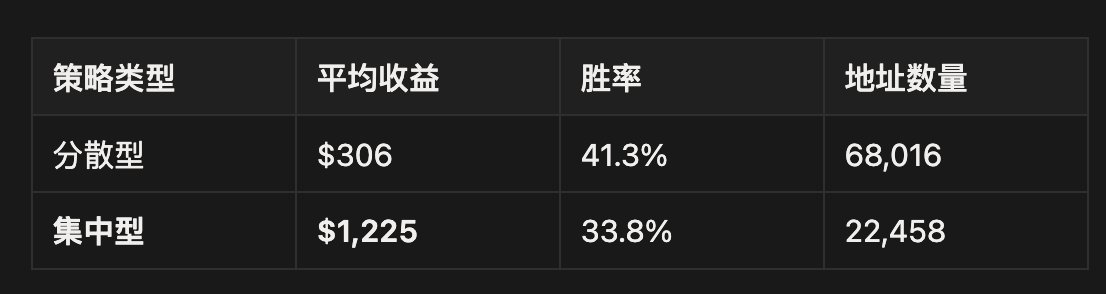
Concentrated strategies yield four times the returns of diversified strategies ($1,225 vs $306).
Notably, the win rate of concentrated strategies is actually lower (33.8% vs 41.3%).
Concentrated strategies achieve significant gains in a few high-odds opportunities.
Explanation:
In-depth research creates an advantage: Concentrating efforts on a few markets makes it easier to discover market pricing deviations, thus achieving excess returns in a few trades.
Win rate is not a key indicator: What matters is the ratio of profit size when winning to loss size when losing. Concentrated strategies accept lower win rates in exchange for higher single trade returns.
Limitations of diversified strategies: Participating in too many markets leads to insufficient depth of research in each market, making it easier to be influenced by market consensus and difficult to discover true alpha.
Analogy:
As Buffett said, "Diversification is a protection against ignorance." If you truly have an information advantage or judgment advantage, you should concentrate on the few opportunities you are most confident in.
- Follow Trade Insight: Prioritize traders focused on specific types of markets (e.g., specific sports leagues, political events in specific countries). Their level of specialization often indicates a deeper understanding and stronger predictive ability.
II. Insights for Followers: How to Identify True "Smart Money"?
To quantify the degree of specialization among traders, we constructed the Focus Ratio (Focus Ratio = Total Trades / Number of Markets) metric and divided addresses into two distinctly different groups:
Diversified Strategy (Generalists): Broadly participates in many markets, with low trading frequency in each market, attempting to reduce risk through diversification.
Concentrated Strategy (Specialists): Digs deep into a few markets, repeatedly trading and increasing positions in each market, exhibiting strong "sniping" characteristics.
The data presents an astonishing "focus premium": Strategy Type | Average Return (Avg PnL) | Win Rate | Number of Addresses --- | --- | --- | --- Diversified (Generalists) | $306 | 41.3% | 68,016 Concentrated (Specialists) | $1,225 | 33.8% | 22,458
Data Interpretation: The average return of concentrated strategies is four times that of diversified strategies. However, a highly misleading phenomenon arises: the win rate of concentrated strategies (33.8%) is significantly lower than that of diversified strategies (41.3%). This reveals the true profit logic of high-level players in the prediction market.
In-depth Attribution: Why Does "Less is More"?
1. Information Asymmetry Establishes a Moat (Information Edge)
Prediction markets are essentially information games.
Diversified traders attempt to span multiple fields such as politics, sports, and crypto, which leads them to remain at a "shallow understanding" in any single market, making them easy targets for being "harvested."
In contrast, concentrated traders establish a vertical information advantage by digging deep into a single track (e.g., only studying NBA player data or only tracking polls in swing states). This depth allows them to discover small pricing deviations in the market.
2. Breaking the "Win Rate Fallacy"
Data shows that high returns are often accompanied by relatively low win rates.
This is because concentrated experts tend to act at moments of high odds/high divergence (e.g., buying at odds of 0.3), rather than picking up "certain pennies" at >0.9.
Diversified: Wins many small amounts (high win rate), loses once big (black swan), resulting in mediocre overall returns.
Concentrated: Able to endure multiple small trial-and-error losses (low win rate) in exchange for a few precise heavy bets that yield explosive returns (high risk-reward ratio). This is typical venture capital (VC) logic, not labor logic.
3. Buffett's Logic Validated in Prediction Markets
As Buffett said, "Diversification is a protection against ignorance."
In the stock market, diversification is to avoid non-systematic risk; but in a zero-sum game like prediction markets, diversification often means dilution of attention. If you are confident you have some Edge, the best strategy is not to cast a wide net but to concentrate firepower on the few opportunities you are most certain about.
Practical Insight (Actionable Insight): Look for "vertical track experts." In follow trade selection, a high Focus Ratio is a more important indicator than a high win rate.
Bad Signal: Avoid "generalists" who buy everything.
Good Signal: Prioritize accounts that are only active under specific tags (e.g., an address that only trades "US Election" and has a stable return curve is far more valuable than one that trades both "NBA" and "Bitcoin." The degree of specialization directly determines the purity of Alpha.
III. From Data Insights to Practical Tools
This report is not only a data review but also the underlying logic for building the Smart Copy-Trading system.
To achieve long-term profitability on Polymarket, it is unrealistic to rely solely on manually screening 90,000 addresses. We are packaging the exclusive data insights mentioned above into a set of automated screening and risk control tools to address the three most challenging issues in following trades:
1. Intelligent Removal of Market Maker Noise
Current public leaderboards are mixed with a large number of volume-manipulating market makers (MM) and arbitrage bots. Following them not only fails to yield profits but may also incur losses due to slippage.
Solution: Utilize exclusive order book analysis and trading feature recognition algorithms to automatically strip away systematic market makers, only locking in those truly profit-seeking active traders based on their viewpoints.
2. Vertical Matching Based on "Focus Ratio"
Generic "profit leaderboards" are of limited significance; you need experts in specific fields.
Solution: Based on Focus Ratio and historical behavior, we assign high-precision "ability tags" to addresses (e.g., US elections, NBA sports events, Crypto whales). The system will accurately match vertical experts with information advantages in the field based on the track you are interested in.
3. Dynamic Style Drift Monitoring (Style Drift Detection)
The most hidden risk in following trades is the sudden failure of a trader's strategy or behavioral changes.
Solution: We have established a real-time risk control model. When a long-term stable address suddenly deviates from its historical behavioral characteristics (e.g., shifting from low-frequency focus to high-frequency broad netting, or unusually amplifying single trade risk exposure), the system will identify it as an abnormal signal and issue timely warnings to help users avoid drawdown risks.
Conclusion & Product Beta Testing
Prediction markets are a brutal zero-sum game, and the data from 90,000 addresses proves: the reason long-term winners win is that they are extremely disciplined: focusing on specific fields and seeking pricing deviations.
All the core indicators mentioned in this report (Focus Ratio, pricing range analysis, market maker removal) have been integrated into Hubble's data backend. Our intention in building this tool is simple: to replace blind retail intuition with institutional-level data insights.
Beta Testing Application: Currently, Hubble's Polymarket smart copy trading tool is undergoing a small-scale gray testing. If you agree with the data analysis logic mentioned above and wish to experience this product:
Like/Share to support this content;
Leave a comment saying "Waitlist";
We will send a private message with a beta testing invitation. We hope this data-based screening system can help you truly outperform the market.
(Data Note: This research is based on settled transaction data from the Polymarket platform since its launch, and all conclusions are derived from Hubble's exclusive on-chain PnL algorithm analysis. Author of this article: Hubble @clairegu1)
免责声明:本文章仅代表作者个人观点,不代表本平台的立场和观点。本文章仅供信息分享,不构成对任何人的任何投资建议。用户与作者之间的任何争议,与本平台无关。如网页中刊载的文章或图片涉及侵权,请提供相关的权利证明和身份证明发送邮件到support@aicoin.com,本平台相关工作人员将会进行核查。


