The new year has kicked off with a strong bullish momentum in the cryptocurrency market. After Bitcoin stabilized above 90,000, it continued to rise, while Ethereum also surged after stabilizing around the 3,100 mark. The short-term bullish trend is clear, but as we approach key resistance zones, we need to be cautious of potential short-term pullback risks. Whether the overall upward trend can continue still depends on the resonance of capital and macro expectations.

I. Market Performance: Breaking Through the Consolidation Range, Strong Bullish Offensive
Over the past weekend, Bitcoin and Ethereum successfully broke through the previous narrow consolidation range, initiating a strong rebound. After breaking free from the 86,000 - 90,000 sideways constraint, Bitcoin has been consolidating at high levels in the 91,000-91,600 range, with no significant pullbacks during the day. On Monday morning, it further surged above 93,000, setting a new recent rebound high. Ethereum completed its buildup in the 3,120-3,160 area and approached the 3,200 mark in the morning. Although its upward momentum is weaker than Bitcoin's, it maintains a steady upward trend overall.
Behind this round of rebound, the capital market provided crucial support. After New Year's Day, European and American institutions resumed trading, and the capital flow for Bitcoin and Ethereum spot ETFs completely reversed, achieving net inflows of 471 million USD and 161 million USD respectively in a single week. BlackRock's IBIT and ETHA funds became the main contributors to the capital inflow, driving the asset management scale of both types of ETFs to rise simultaneously. The combination of capital inflow and liquidity recovery after the holiday has injected momentum into the breakout trend.
II. Technical Analysis: Bullish Structure Formed, but Overbought Risks Emerge
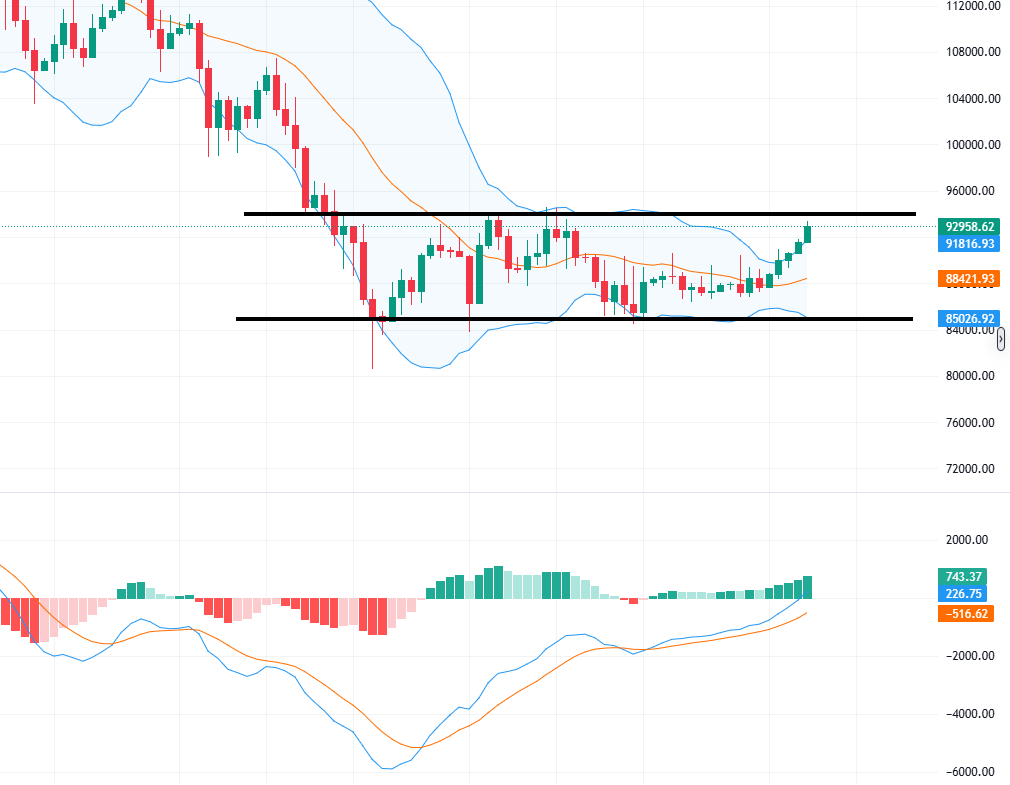
Bitcoin: The daily chart shows a series of small consecutive bullish candles, with the MA5 and MA10 moving averages forming a golden cross and diverging upwards, indicating a short-term bullish trend. The MACD indicators on the four-hour and hourly charts maintain a bullish expansion state, with good volume-price coordination. However, it is important to note that the RSI indicator has entered the overbought zone, and the price is approaching the previous resistance selling pressure zone of 93,000-95,000, which concentrated the trapped positions from December, making short-term breakthroughs challenging.
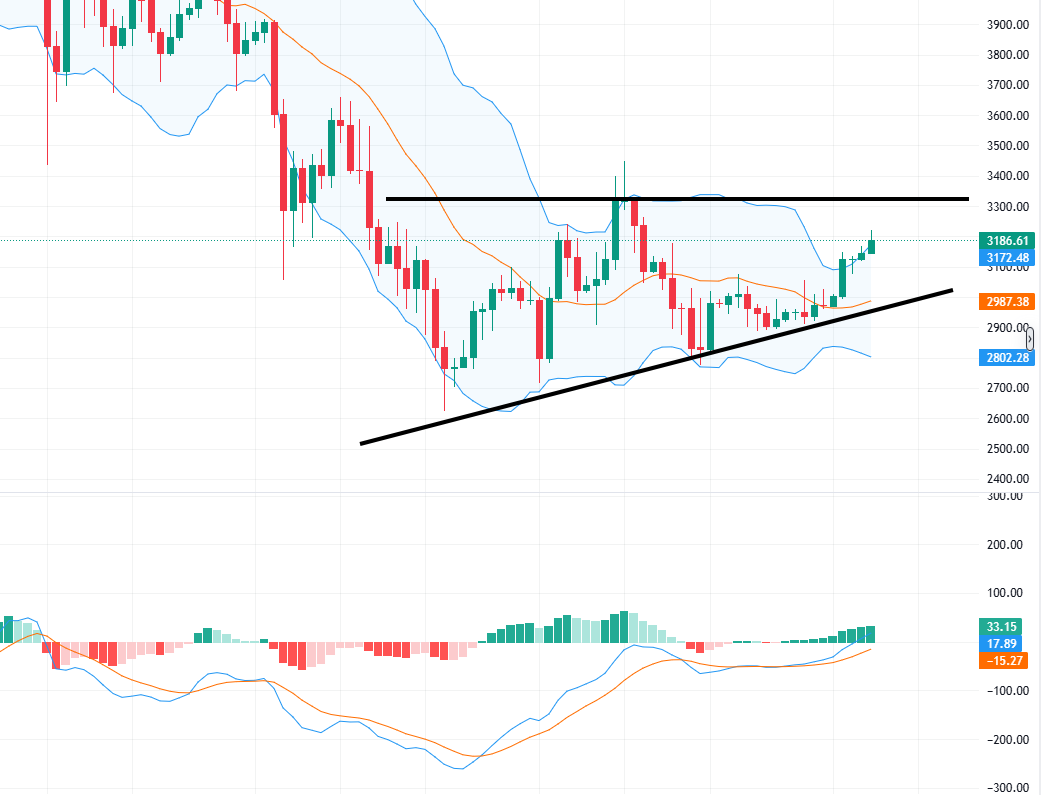
Ethereum: The daily chart's moving average system has formed a golden cross at the bottom, providing solid support for the price. The four-hour moving averages also show an upward divergence, indicating that there is still upward momentum in the short term. However, the 3,200-3,250 area above is also a dense selling pressure zone, and the relative momentum gap compared to Bitcoin reflects that the market's risk appetite for second-tier mainstream coins has not fully recovered.
III. Key Price Levels and Potential Risk Alerts
1. Core Bull-Bear Divide
Bitcoin: The short-term resistance is focused on the 93,000 mark, with further pressure levels looking towards the 94,000-95,000 range. The support below has also moved up to the 91,200-90,700 area, with the 90,000 mark serving as an important psychological defense line, remaining the core defense level after a pullback. If it is breached, it may trigger short-term profit-taking.
Ethereum: Short-term resistance is focused on the 3,200 mark and the 3,250 area, while support is concentrated in the 3,110-3,080 range, with the 3,000 mark as a key psychological support that needs to be firmly defended.
2. Potential Risk Factors
Currently, there is a clear divergence between market sentiment and price. Despite the continuous price increase, the Fear and Greed Index remains in the "extreme fear" zone around 20, reflecting investors' doubts about the sustainability of the rebound. Additionally, the uncertainty surrounding the Federal Reserve's policies persists, with a 20% probability of a rate cut in January and a 45% probability in March. Policy divergence may trigger volatility in risk assets. Furthermore, the selling pressure from trapped positions in the 93,000-95,000 resistance zone, combined with short-term overbought pullback demands, may lead to price fluctuations in that area.
IV. Future Outlook: Continuation of Bullish Trend Requires Breakthrough Confirmation, Beware of Fluctuations and Pullbacks
In the short term, the bullish trend has not reversed, but if Bitcoin cannot break through the key resistance of 95,000 with volume, it is likely to fluctuate in the 93,000-95,000 range to digest profit-taking and trapped position pressures. Ethereum needs to stabilize above the 3,200 mark to further open up upward space. In the medium term, expectations of Federal Reserve rate cuts and the narrative of scarcity brought by Bitcoin's 20 million circulating milestone remain the core logic supporting the market, but uncertainties before policy implementation may lead to fluctuations in the market.
In terms of operations, in the short term, one can hold long positions based on key support levels, but it is necessary to appropriately reduce positions near resistance zones to avoid pullback risks. If the price breaks through resistance and confirms with volume, one can follow the trend; if it falls below core support, timely stop-loss measures should be taken.

This article is exclusively published by (public account: Jian Crypto) and is for reference only. Trading itself is not difficult; the challenge lies in human psychology and self-discipline. I hope we can all continuously improve ourselves through learning, refine ourselves, and become stronger for a longer time.
Market conditions fluctuate in real-time and are time-sensitive. Feel free to scan the QR code to follow the public account for daily market information and real-time communication.
Friendly reminder: This article is solely owned by the column public account (as shown above) of Jian Crypto. Other advertisements at the end of the article and in the comments section are unrelated to the author! Please be cautious in distinguishing between true and false, thank you for reading.
免责声明:本文章仅代表作者个人观点,不代表本平台的立场和观点。本文章仅供信息分享,不构成对任何人的任何投资建议。用户与作者之间的任何争议,与本平台无关。如网页中刊载的文章或图片涉及侵权,请提供相关的权利证明和身份证明发送邮件到support@aicoin.com,本平台相关工作人员将会进行核查。


