Interest rate cuts have almost become a "sure thing," but the real variables lie elsewhere.
Written by: David, Deep Tide TechFlow
This Thursday (Beijing time), the Federal Reserve will announce its last interest rate decision of the year. Market expectations are very consistent:
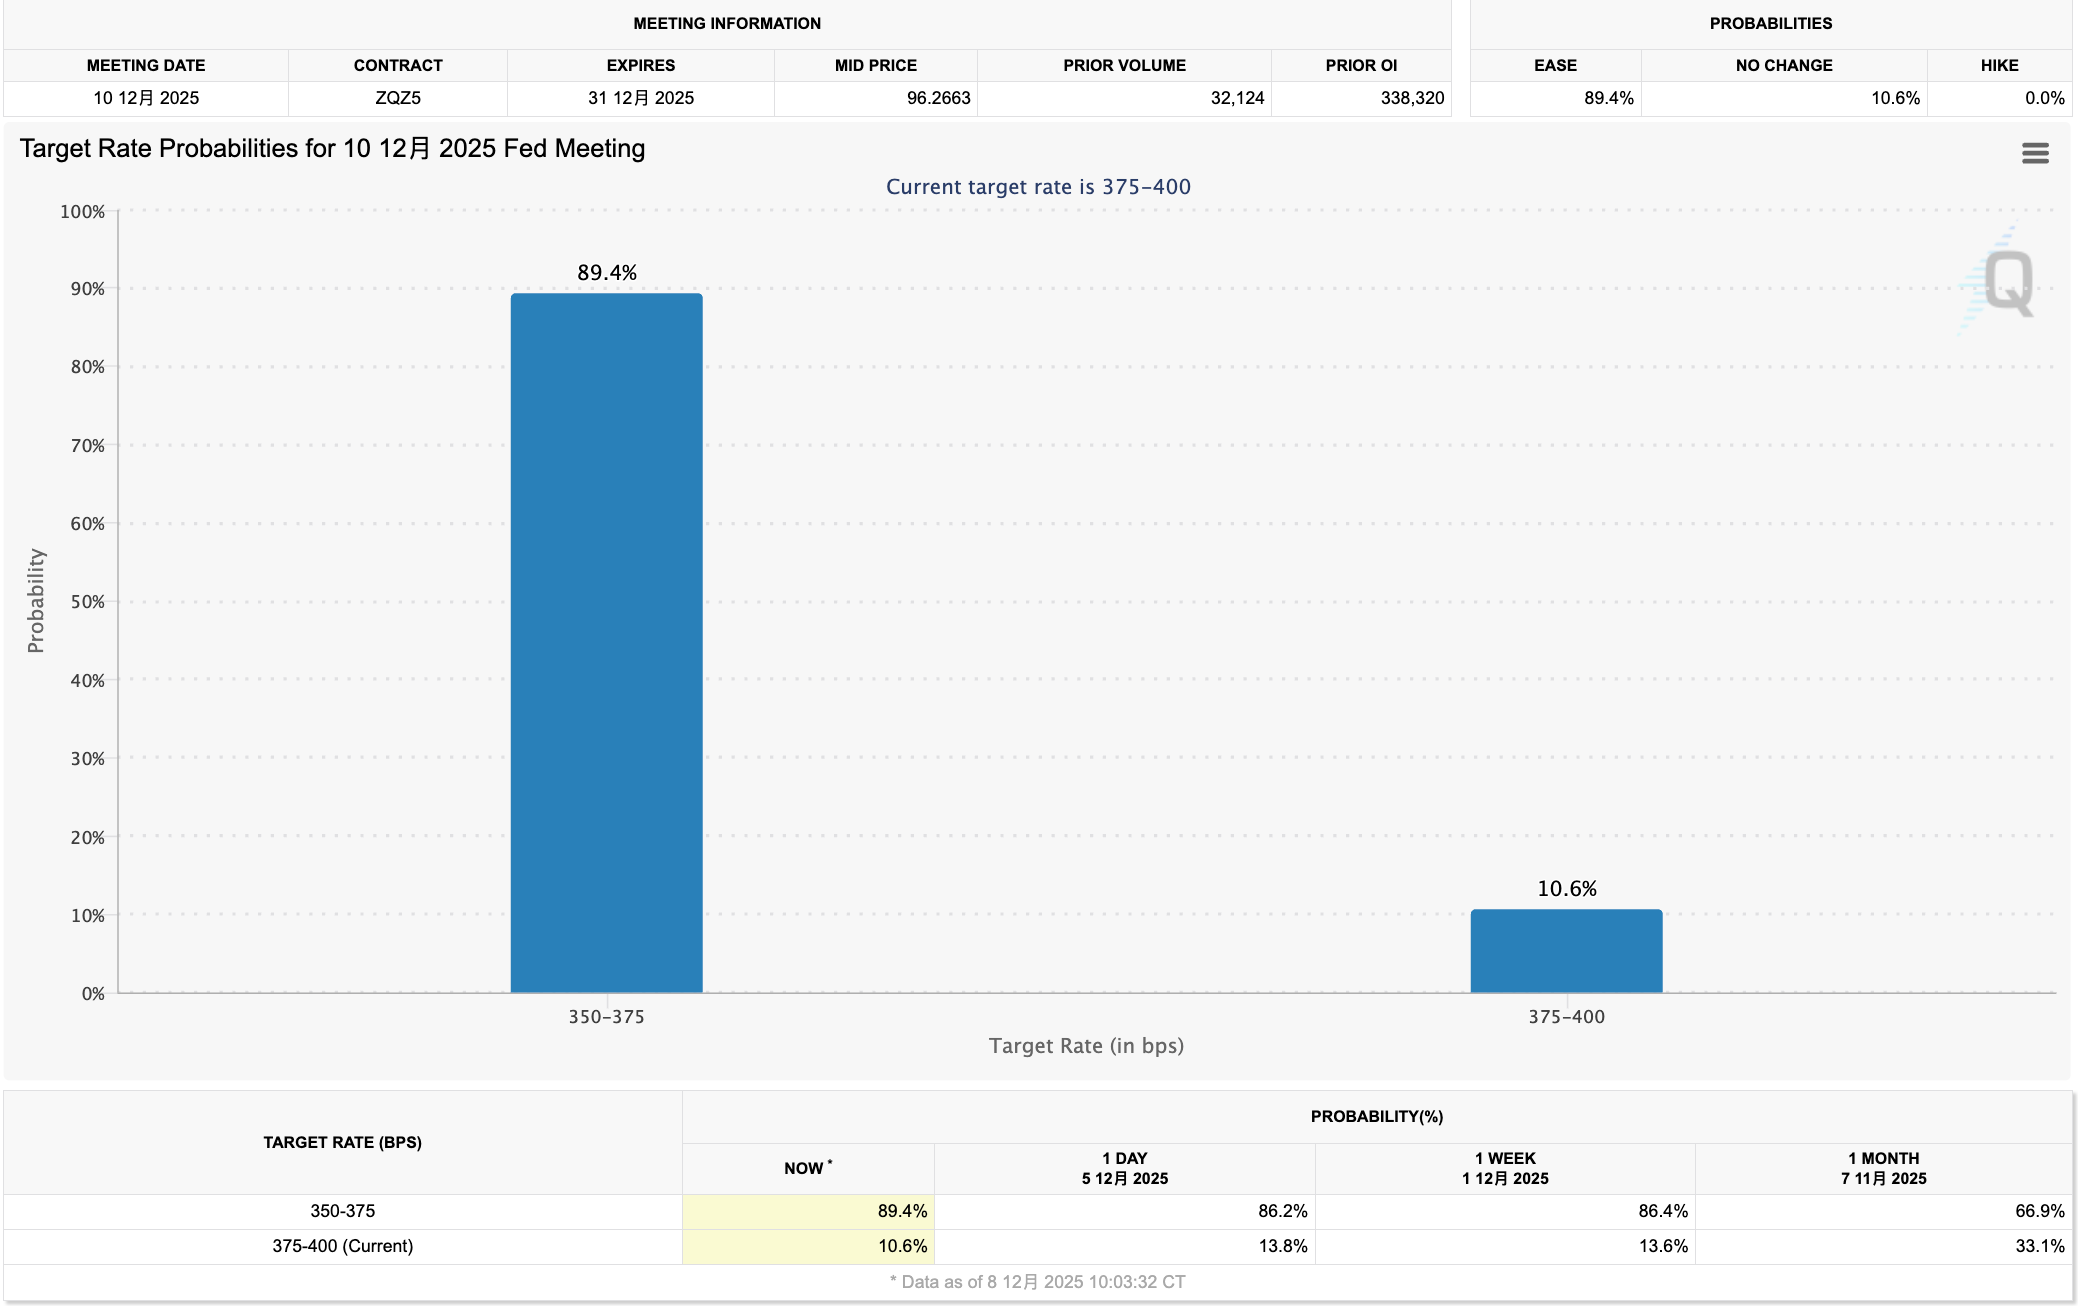
According to CME FedWatch data, the probability of a 25 basis point rate cut exceeds 85%.
If this materializes, it will be the third consecutive rate cut since September, bringing the federal funds rate down to a range of 3.5%-3.75%.
For crypto investors accustomed to the narrative of "rate cuts = good news," this sounds like good news.
However, the problem is that when everyone expects a rate cut, the cut itself is no longer a factor driving the market.
Financial markets are expectation machines. Prices reflect not "what has happened," but "what has happened relative to expectations."
An 85% probability means that the rate cut has already been fully priced in; when it is officially announced on Thursday morning, unless there is an unexpected development, the market is unlikely to react significantly.
So what is the real variable?
The Federal Reserve's stance for next year. A 25 basis point cut is basically certain, but how long the rate cut cycle can last and how many more cuts there will be in 2025 are what the market is truly betting on.
On Thursday morning, the Fed will simultaneously update its forecast for the future path of interest rates, and this forecast often has a greater impact on market direction than the current rate cut decision.
But this time there is an additional issue: the Fed itself may not have a clear view.
The reason is that from October 1 to November 12, the U.S. federal government was shut down for 43 days. During this period, the statistical department paused operations, leading to the cancellation of the October CPI release, and the November CPI has been postponed to December 18, a full week later than this week's FOMC meeting.
This means that Fed officials will be missing the inflation data from the last two months when discussing the outlook for interest rates.
When decision-makers are themselves groping in the dark, the guidance they provide will be more ambiguous, and ambiguity often means greater market volatility.
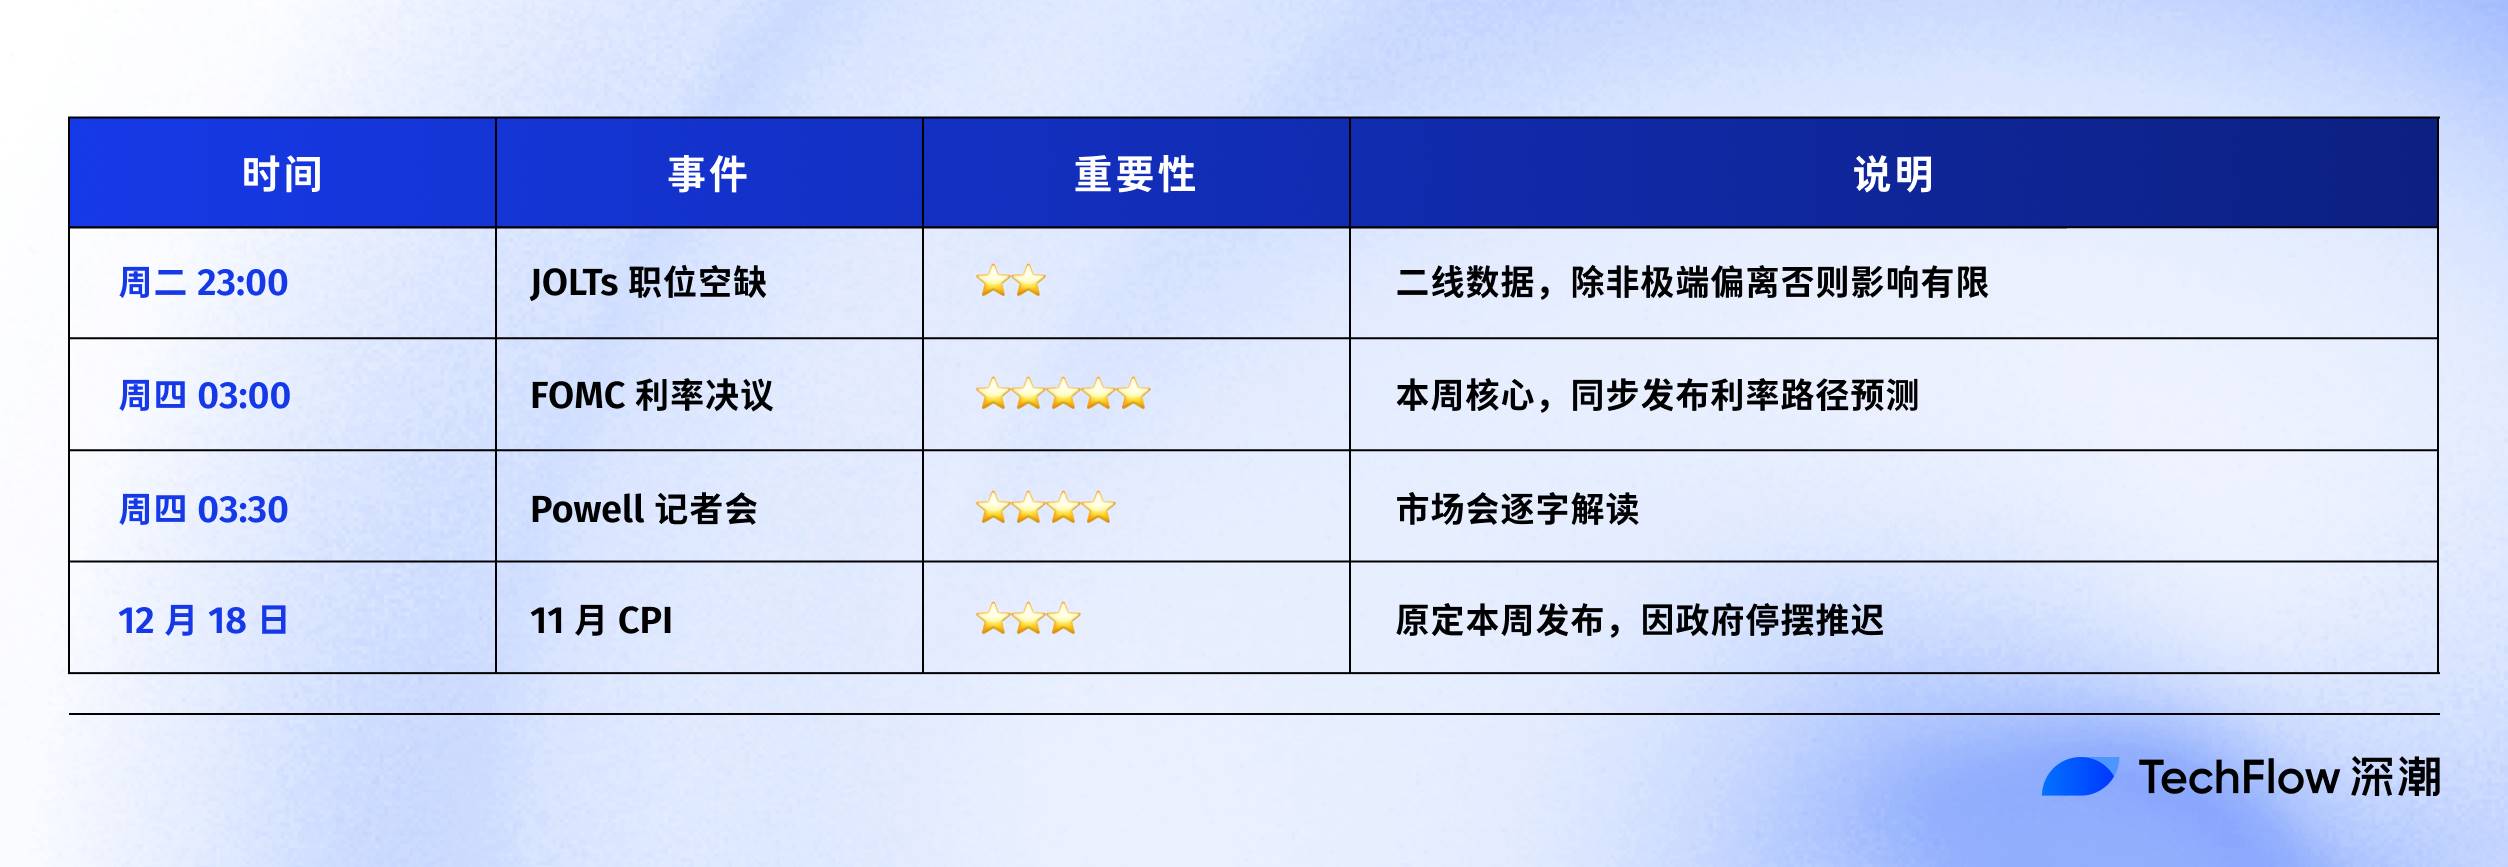
Let's first look at this week's timeline:
We can analyze the possible signals the Fed might give and what kind of market reactions they correspond to.
Betting on next year's expectations
After each FOMC meeting, the Fed releases a "Summary of Economic Projections."
It includes a chart showing all Fed officials' expectations for future interest rates.
Each official marks a point indicating where they believe the interest rate should be at the end of the year. Because it looks like a bunch of scattered dots, the market habitually calls it the "dot plot." You can find the original dot plots from previous meetings on the Federal Reserve's official website.
The chart below is from the dot plot released during the FOMC meeting on September 17.
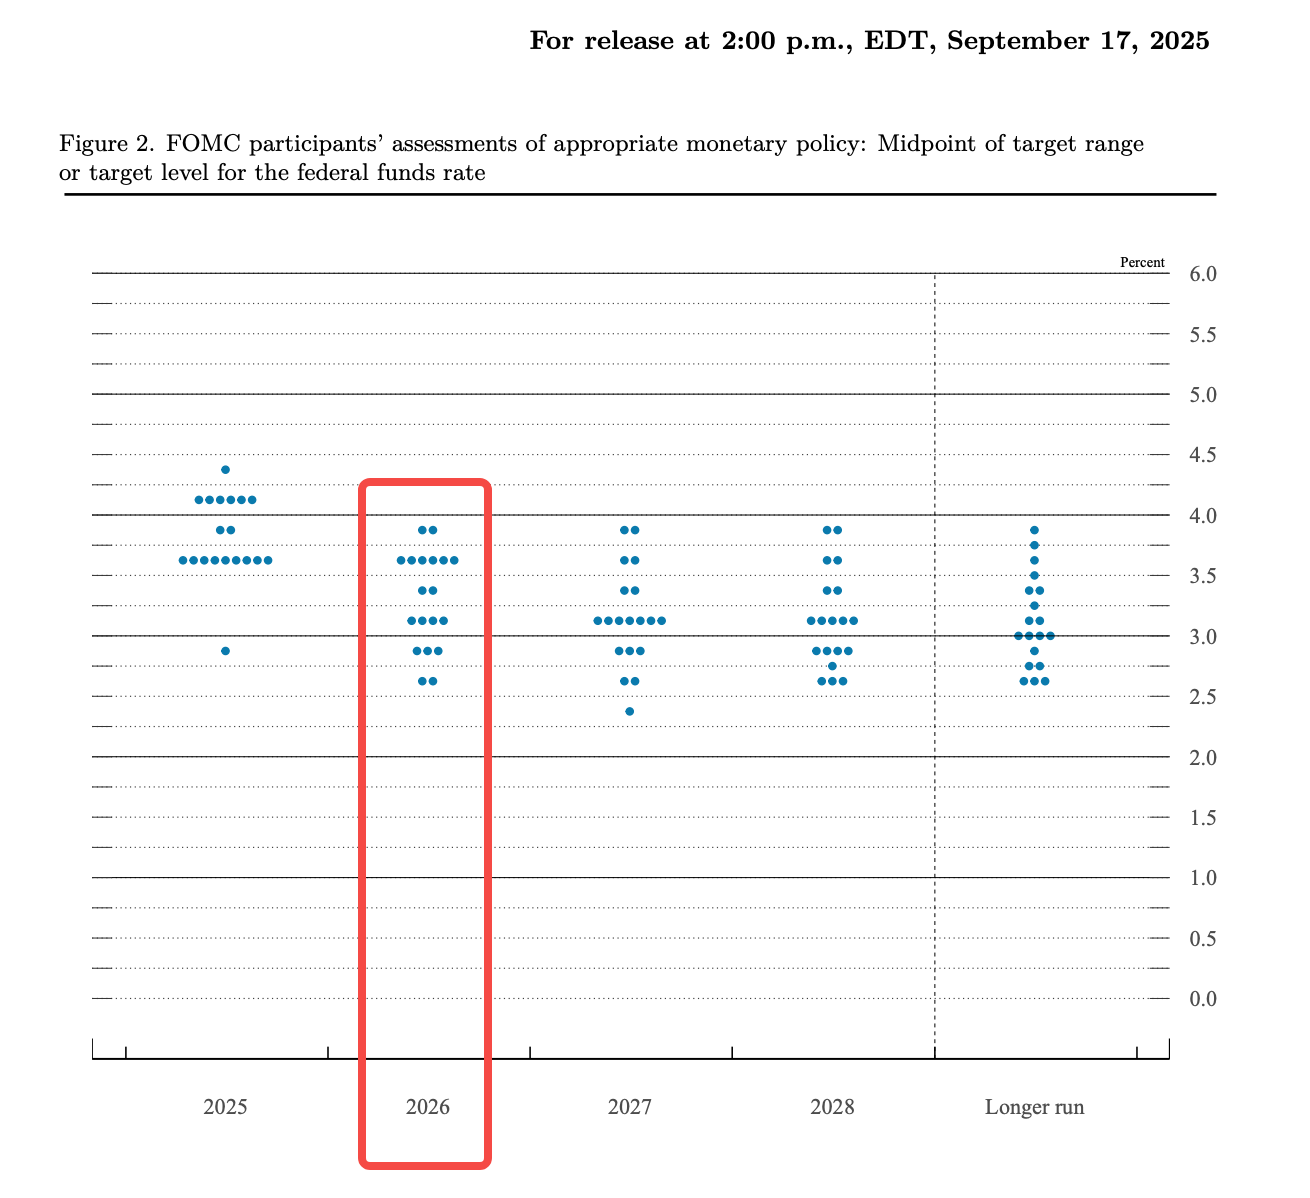
It shows the divisions and consensus within the Fed. If the points are clustered together, it indicates that the officials have a unified view, and the policy path is relatively clear;
If the points are widely scattered, it indicates internal disputes, and the future is full of uncertainties.
For the crypto market, uncertainty itself is a risk factor. It suppresses risk appetite, causing funds to lean towards waiting rather than entering the market.
From the chart, we can see that the points for 2025 are mainly concentrated in two areas: around 3.5%-3.625% there are about 8-9 points, and around 3.75%-4.0% there are also 7-8 points. This indicates that the committee is divided into two factions:
One faction believes there should be 1-2 more cuts this year, while the other believes there should be a pause or only one cut. The median falls around 3.6%, meaning the baseline expectation for most is that there will be 2 more cuts in 2025 (including this week's cut).
Looking at 2026, the divisions among Fed members are even greater.
The current rate is 3.75%-4.00%. If it drops to around 3.4% by the end of next year, it means only 1-2 cuts for the entire year. However, from the chart, some officials believe it should drop to 2.5% (equivalent to 4-5 cuts), while others believe it should remain at 4.0% (not cut at all).
Within the same committee, the most aggressive and the most conservative expectations differ by the space of 6 rate cuts. This is a "highly divided" Federal Reserve committee.
This division itself is a signal.
If the Fed officials cannot reach a clear consensus, the market will naturally vote with its feet. Currently, traders' bets are more aggressive than the official guidance. CME FedWatch shows that the market is pricing in 2-3 rate cuts in 2026, while the official median from the dot plot only shows 1 cut.
Thus, Thursday's FOMC meeting is, to some extent, a "check-in" between the Fed and the market. Will the Fed align with the market or stick to its own pace?
Three scenarios, three reactions
Based on the current information, there are roughly three possible directions for this week's FOMC.
- The most likely scenario is "in line with expectations": a 25bp cut, the dot plot maintains the guidance from the last September meeting, and Powell repeatedly emphasizes "data dependence" in the press conference, without providing a clear direction.
In this case, the market is unlikely to see significant volatility. Since the rate cut has been priced in, and there is no change in guidance, there is a lack of new trading signals. The crypto market will likely follow the U.S. stock market with slight fluctuations before returning to its original trend.
This is also the baseline expectation of most Wall Street institutions, including recent reports from Goldman Sachs and Raymond James pointing in this direction.
- The second possible scenario is "dovish": a 25bp cut, but the dot plot indicates that there may be 2 or more cuts in 2026, and Powell's language is soft, emphasizing that the risks in the labor market outweigh the risks of inflation.
This would mean the Fed is aligning with market expectations, confirming a path of easing. A weaker dollar would boost dollar-denominated assets, while improved liquidity expectations would lift market sentiment. BTC and ETH may follow the U.S. stock market rebound, with the former likely testing recent highs.
- The less likely but not to be ruled out scenario is "hawkish": although there is a 25bp cut, Powell emphasizes inflation stickiness, suggesting limited room for rate cuts next year; or there are multiple dissenting votes, indicating internal resistance to continued easing.
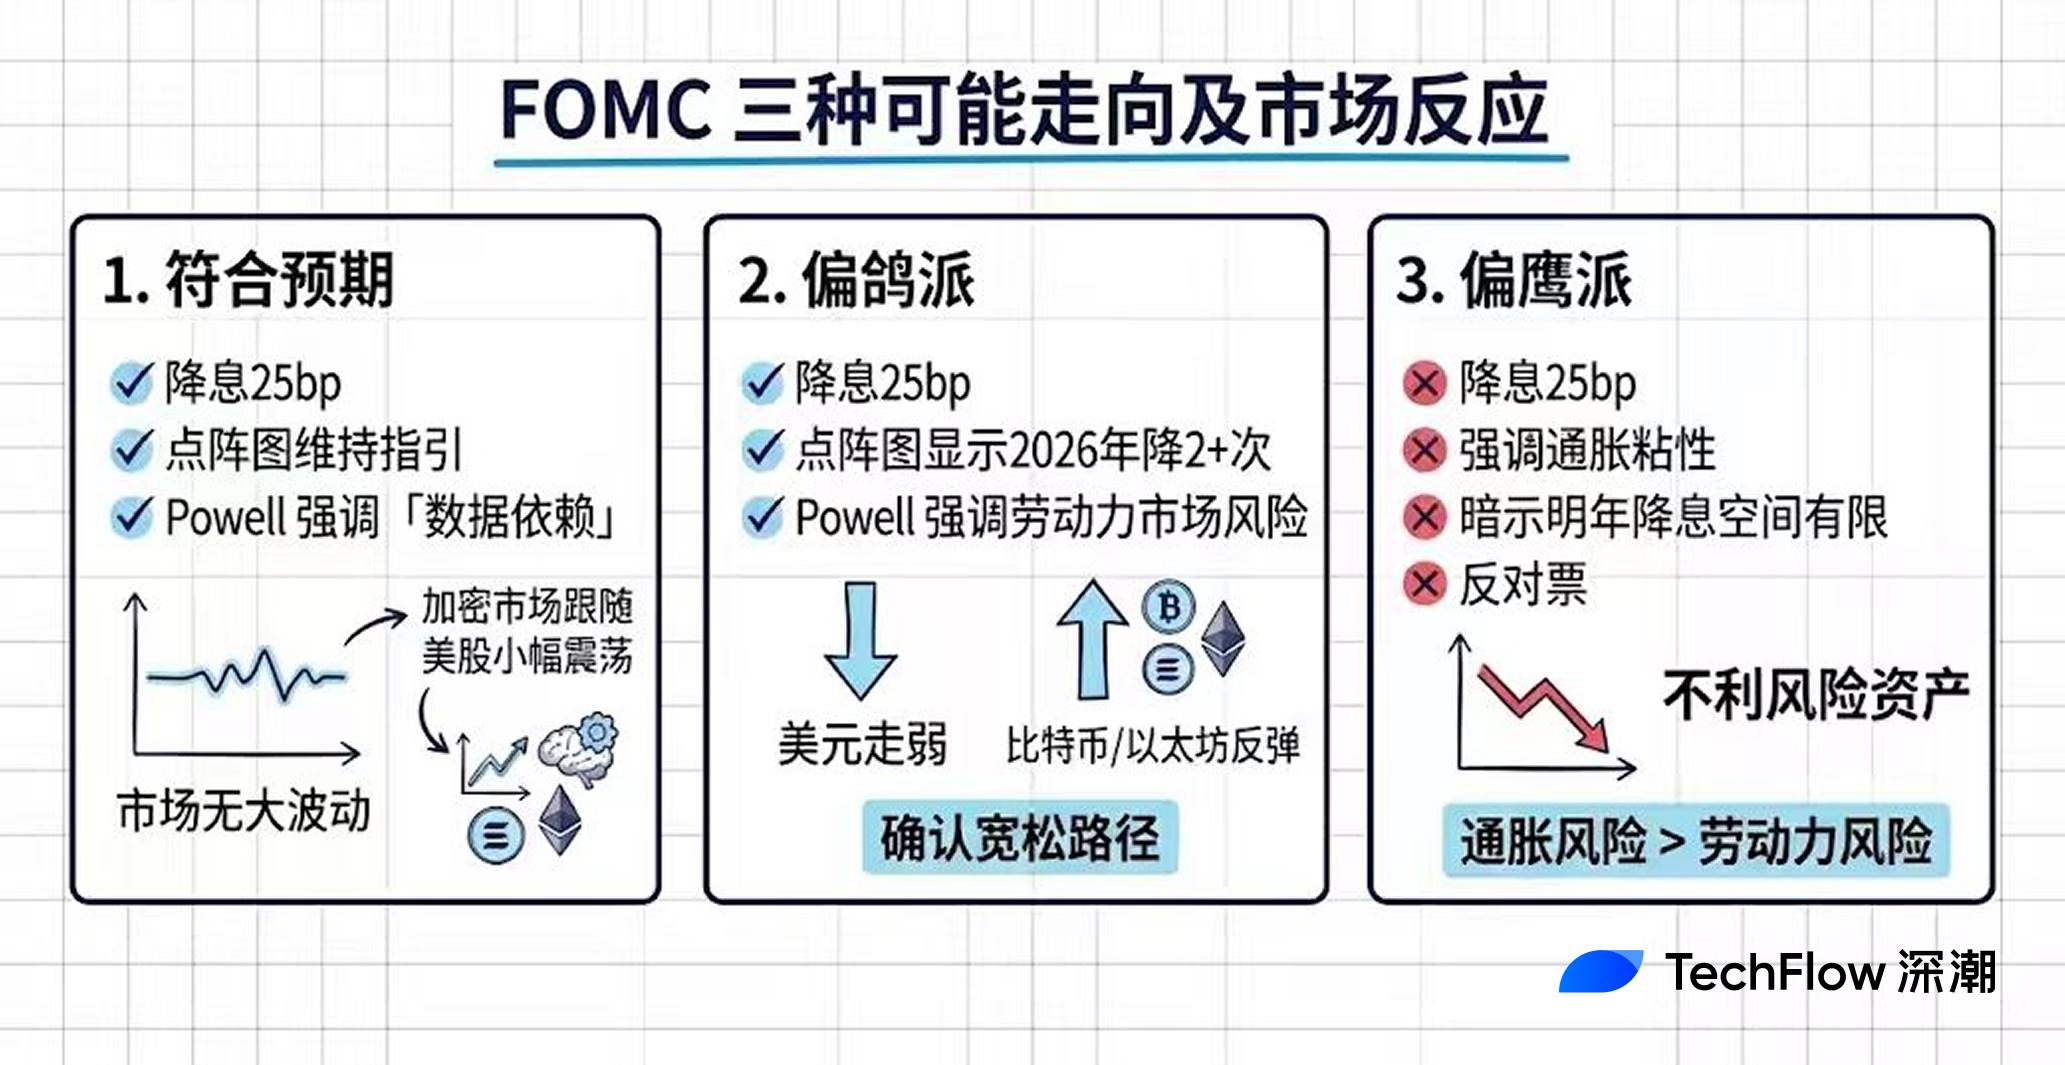
This would effectively tell the market "you are thinking too much," leading to a stronger dollar, tighter liquidity expectations, and pressure on risk assets. The crypto market may face a short-term correction, especially for high beta altcoins.
However, if the language is merely hawkish rather than a substantive policy shift, the declines are often limited and may even present an entry opportunity.
Under normal circumstances, the Fed would adjust the dot plot based on the latest data. But this time, due to the government shutdown, they are missing two months of CPI data and can only make judgments based on incomplete information.
This brings several chain reactions. First, the reference value of the dot plot itself is discounted; if the officials are uncertain, the points they draw may be more scattered.
Secondly, the weight of Powell's press conference will be higher, and the market will look for direction from every word he uses. If the tendencies shown in the dot plot are inconsistent with Powell's tone, the market will be even more confused, and volatility may increase.
For crypto investors, this means that the market on Thursday morning may be harder to predict than usual.
Rather than betting on direction, it is better to focus on the volatility itself. When uncertainty rises, controlling positions is more important than betting on price movements.
Tonight's job openings data is not as important as you think
What we've discussed so far is Thursday's FOMC, but tonight (Tuesday at 23:00 Beijing time) there is another data release: JOLTs.
Occasionally, social media will hype it up, saying things like "quietly determining the direction of liquidity." But to be honest, the importance of JOLTs in macro data is not high. If you have limited time, just keep an eye on Thursday's FOMC;
If you want to know a bit more about the labor market background, you can continue reading.
JOLTs stands for Job Openings and Labor Turnover Survey. It is released monthly by the U.S. Bureau of Labor Statistics (BLS) and tracks how many job openings there are in U.S. companies, how many people were hired, and how many people left their jobs.
The most closely watched figure is the "number of job openings": the higher the number, the stronger the demand for hiring, indicating a tighter labor market.
During the peak in 2022, this number exceeded 12 million, meaning companies were frantically hiring, and wages were rising rapidly, which worried the Fed about inflation. Now, this number has fallen to around 7.2 million, basically returning to pre-pandemic normal levels.
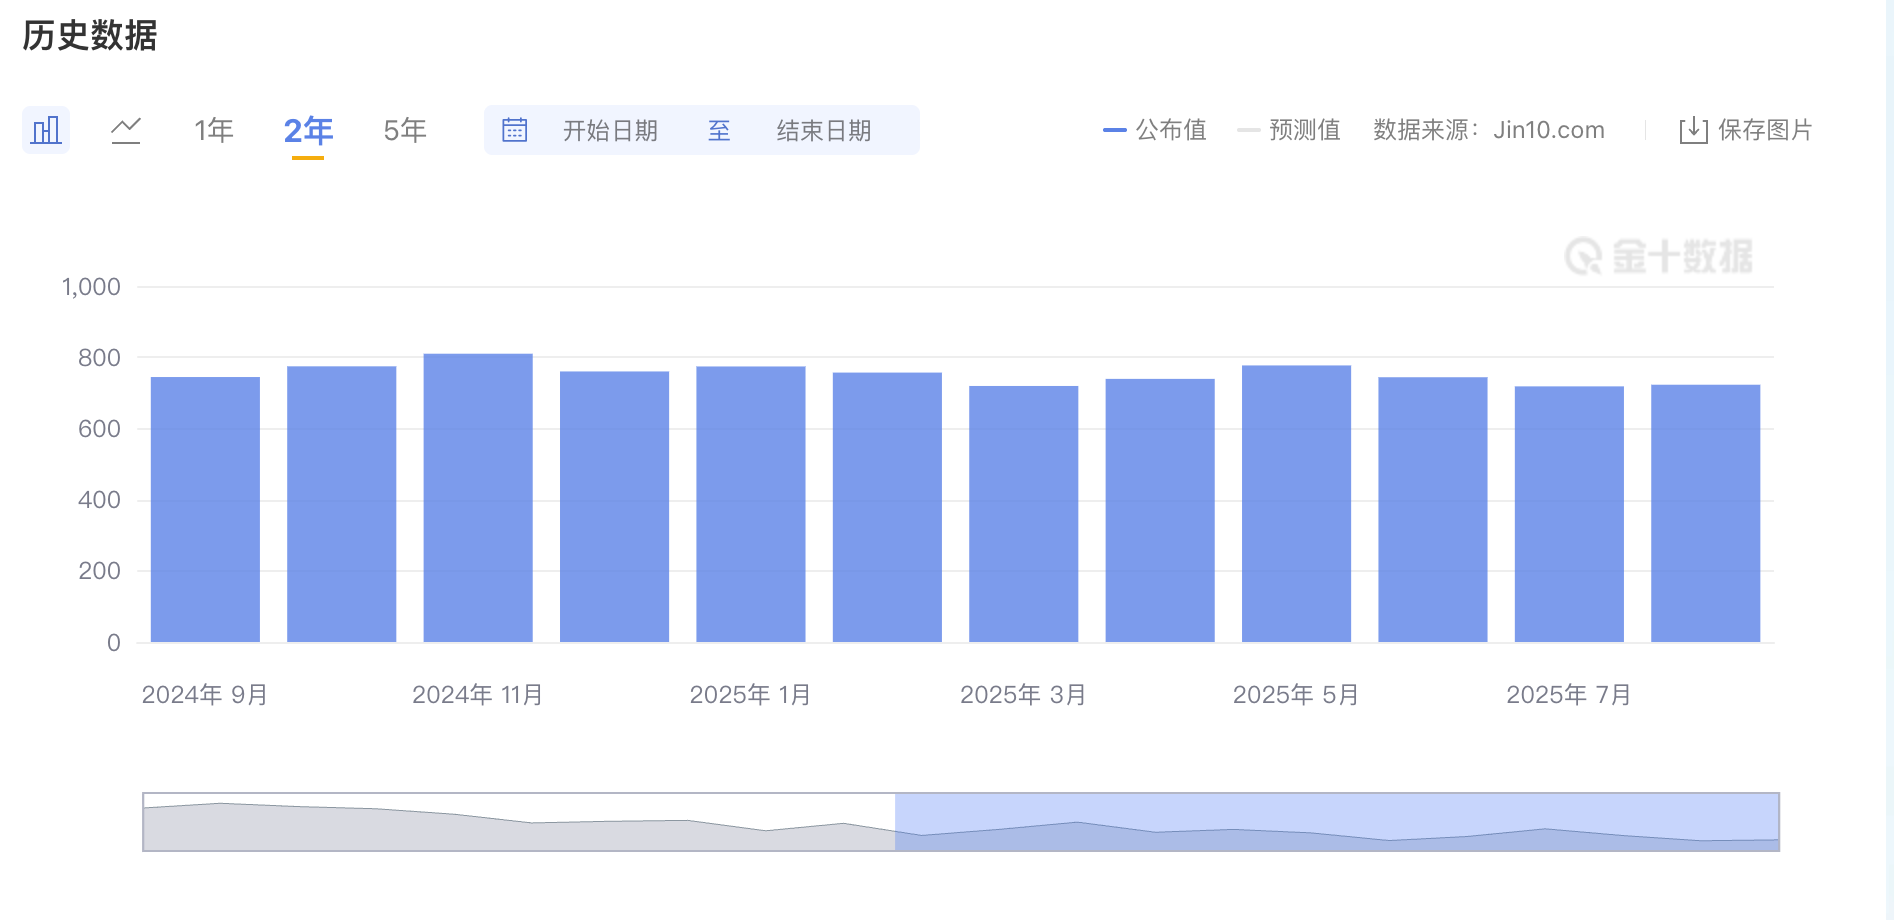
Image source: Jinshi Data
Why is the importance of this data possibly overestimated?
First, JOLTs is a lagging indicator. The data being released today is for October, but it is already December. The market pays more attention to more timely data, such as the weekly initial jobless claims and the monthly non-farm payroll report released at the beginning of each month.
Second, the expected number of job openings around 7.1 million is not considered "overheated." Analysts have pointed out that the ratio of job openings to unemployed persons fell below 1.0 in August, meaning there is not even one job opening for every unemployed person.
This is completely different from the situation in 2022, where "one unemployed person corresponded to two job openings." The narrative of a "hot" labor market is actually outdated.
According to predictions from LinkUp and Wells Fargo, the October JOLTs data released tonight is likely to be around 7.13-7.14 million, not much different from the last figure of 7.2 million.
If the data meets expectations, the market is unlikely to react; it merely confirms the existing narrative of "the labor market continues to cool slowly" and will not change anyone's expectations of the Fed.
Tonight's data is more like an "appetizer" before the FOMC, with the real main course coming on Thursday morning.
How will my BTC perform?
The previous chapters discussed macro data, but you might be more concerned about one question: how do these factors actually affect my BTC and ETH?
To start with the conclusion, they will have an impact, but it's not as simple as "rate cuts = price increase."
The Fed's interest rate decisions influence the crypto market through several channels.
The first is the U.S. dollar. A rate cut means lower yields on dollar-denominated assets, prompting funds to seek other opportunities. When the dollar weakens, dollar-denominated assets (including BTC) often perform better.
The second is liquidity. In a low-interest-rate environment, borrowing costs are low, leading to more money in the market, some of which flows into risk assets. The bull market from 2020 to 2021 was largely a result of the Fed's unlimited quantitative easing.
The third is risk appetite. When the Fed signals a dovish stance, investors are more willing to take risks, moving funds from bonds and money market funds into stocks and cryptocurrencies; conversely, hawkish signals will cause funds to flow back into safe assets.
These three channels together form the transmission chain of "Fed policy → dollar/liquidity → risk appetite → crypto assets."
Theoretically, BTC currently has two popular identities: "digital gold" or "risk asset."
If it is digital gold, it should rise during market panic, negatively correlating with the stock market. If it is a risk asset, it should rise and fall with the Nasdaq, performing well in a liquidity-rich environment.
The reality is that BTC has behaved more like the latter in recent years.
According to CME research, since 2020, the correlation between BTC and the Nasdaq 100 has jumped from nearly zero to around 0.4, sometimes even exceeding 0.7. The Kobeissi Letter recently pointed out that BTC's 30-day correlation reached 0.8, the highest level since 2022.
However, an interesting phenomenon has emerged recently. According to CoinDesk, the correlation between BTC and the Nasdaq has dropped to -0.43 over the past 20 days, showing a clear negative correlation.
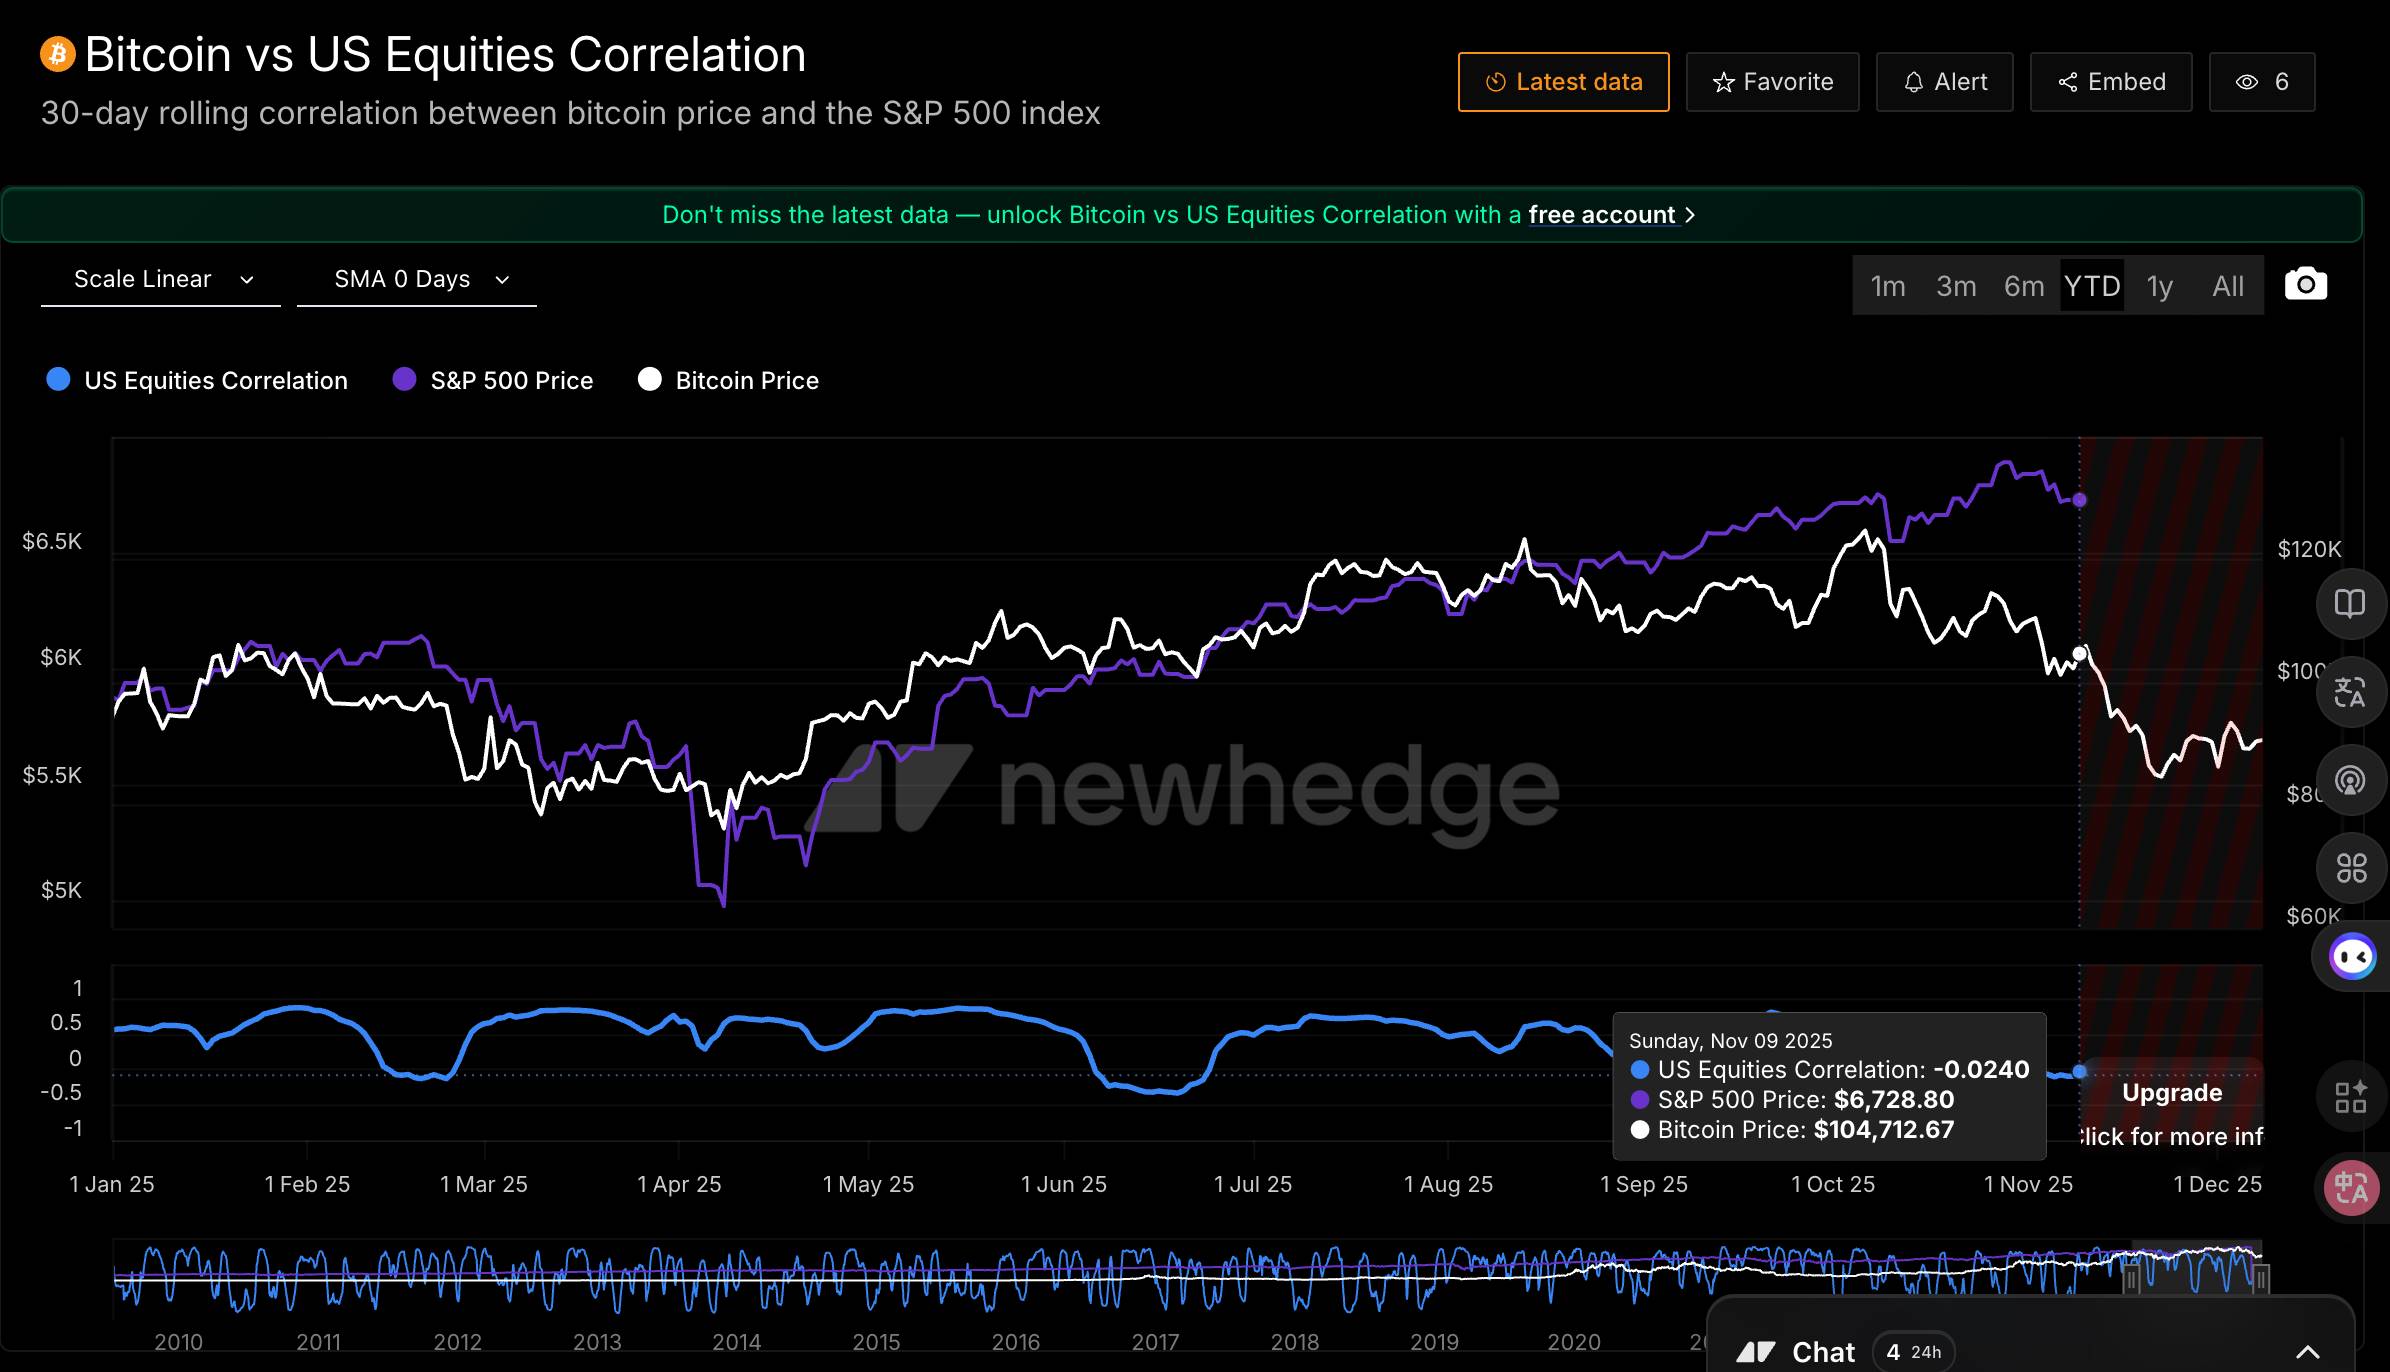
Data source: https://newhedge.io/
The Nasdaq is only 2% away from its historical high, while BTC has dropped 27% from its October peak.
Market maker Wintermute has an explanation for this: BTC currently exhibits a "negative skew," falling more when the stock market declines and reacting sluggishly when the stock market rises. In their words, BTC "only shows high beta in the wrong direction."
What does this mean?
If the FOMC releases dovish signals this week and the U.S. stock market rises, BTC may not necessarily rebound in sync; however, if hawkish signals are released and the stock market falls, BTC could drop even more. This creates an asymmetric risk structure.
Summary
After discussing all this, here’s a framework for ongoing tracking.
What to focus on this week (December 9-12)?
The core focus is on Thursday morning's FOMC. Specifically, look for three things: whether there are changes in the dot plot, especially the median interest rate expectations for 2026; whether Powell's press conference language is dovish or hawkish; and whether there are multiple dissenting votes in the voting results.
What to focus on in mid to late December?
On December 18, the November CPI will be released. If inflation data rebounds, the market may reprice expectations for rate cuts next year, challenging the narrative of the Fed "continuing to ease."
What to focus on in Q1 2026?
First, personnel changes at the Fed chair position. Powell's term ends in May 2026.
Second, the ongoing impact of Trump’s policies. If tariff policies expand further, they may continue to raise inflation expectations, constraining the Fed's easing space.
Additionally, continue to monitor whether the labor market accelerates its deterioration. If layoff data begins to rise, the Fed may be forced to accelerate rate cuts, leading to a different scenario.
免责声明:本文章仅代表作者个人观点,不代表本平台的立场和观点。本文章仅供信息分享,不构成对任何人的任何投资建议。用户与作者之间的任何争议,与本平台无关。如网页中刊载的文章或图片涉及侵权,请提供相关的权利证明和身份证明发送邮件到support@aicoin.com,本平台相关工作人员将会进行核查。


