Author: Stephen Perrenod, Technical Analyst
Translated by: Felix, PANews
The largest bubbles in Bitcoin's history (bull markets) occurred in 2011, 2013, 2017, and 2021. Despite many Bitcoin investors firmly believing in a four-year cycle, no bubble has appeared in 2025.
Why? Because everyone has been brainwashed by the narrative of "bubbles occurring linearly every four years," expecting peaks after the halving events in 2012, 2016, 2020, and 2024. This narrative has been further reinforced by the U.S. business cycle and presidential election years.
I too was once trapped in the assumption of a four-year linear cycle.
Over the past year, I have increasingly focused on modeling bubbles, analyzing the "core power law zone" (long-term trend) separately from the "bubble zone" (short-term deviations).
The results are becoming clearer: the "energy" of bubbles is diminishing, roughly inversely proportional to Bitcoin's "age," or decaying at the -0.83 power of age.
People also mistakenly believe that the percentage increase of each bubble will be equally large, but the intensity of bubbles is clearly diminishing. Furthermore, this study indicates that the intervals between bubbles are also lengthening over time.
What about the bubble in 2011? People tend to ignore the large bubble of 2011 as an "early anomaly." However, the 2011 bubble is just as important as those in 2013 and 2017 and should be treated equally. What if bubbles do not appear in a linear cycle but rather in a logarithmic cycle? This phenomenon is known as logarithmic cycle behavior.
Logarithmic Cycle Bubbles Arise from Power Laws
After all, Bitcoin itself is a power law asset, exhibiting scale invariance over time. To achieve the same price increase, there must be a proportional increase in time. For example, if the relationship between price and age is Price ~ Age^k, then in dollar terms, if k = 5.7, when age doubles, the price will increase by 52 times. To achieve the same 52-fold price increase, Bitcoin's age would need to grow from 2 years to 4 years, then from 4 years to 8 years, and then from 8 years to 16 years, and so on.
Therefore, it is not surprising that the intervals between bubbles are becoming longer. A logarithmic time interval may correspond to only one major bubble, while the intervals in linear time will continue to lengthen.
In fact, as early as 2019, Giovanni Santostasi (who discovered Bitcoin's power law nature before the second halving) proposed a logarithmic cycle model around the power law trend (the curved/oscillating line in Figure 1). It almost corresponds to the three bubbles of 2011, 2013, and 2017, even predicting that the next bubble peak will occur at x=3.817 (i.e., 10^3.817 ≈ 6561 days, about 18 years), which is around the end of 2026 to early 2027.
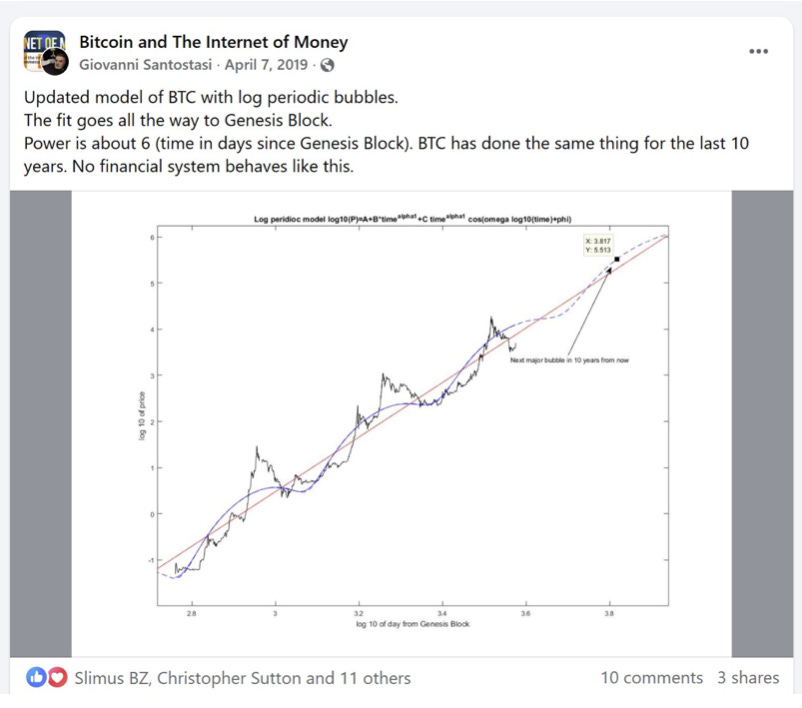
Figure 1
This post from six years ago deserves more likes; although the amplitude fitting is generally poor, the timing is very accurate, and we will see that the prediction for the fourth peak may be extremely accurate.
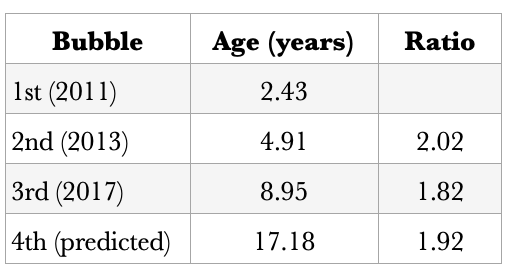
Roughly observing the age ratios, the ratios between the first two adjacent major bubbles are 2.02 and 1.82, averaging 1.92, with the fourth bubble occurring at an age of about 17.18 years (early 2026). Of course, this is just a rough preliminary guess .
Whether it is Giovanni's fitting model or my model run with an additional six and a half years of data, neither predicted that a bubble would occur in 2021 or 2025. This raises the question: was the double bubble in 2021 a fundamental bubble or caused by other reasons?
Complete Logarithmic Cycle Analysis
Next, it is important to note that the complete logarithmic cycle algorithm (full log-periodic algorithm) is much more precise than simply analyzing the intervals between two peaks.
It relates to a more complex logarithmic cycle analysis promoted by geophysicist Didier Sornette, which was originally used for earthquakes, other natural phenomena, and financial time series. The complete equation contains seven parameters, including a local power law index and a harmonic (cosine) term with logarithmic time dependence.
In this article, a Fourier and wavelet analysis of the logarithmic time of the complete price history will be conducted. Bitcoin is measured in ounces of gold, and a scale invariance test was performed. In the logarithmic price residuals with base 10, the power law index is 5.30, R² is 0.94, and the standard deviation is 0.314.
A Fourier transform analysis of the compressed residuals after removing the 5.30 power law yields a logarithmic cycle characteristic wavelength parameter λ = 2.07. In the previously mentioned peak interval formula, this roughly corresponds to the ratio of "age" between bubbles, but it is a more global estimate that also considers harmonics. Wavelet analysis found that λ ranges between 2.00 and 2.10.
The final best-fit λ value corresponds to the fundamental mode, which fits well with the bubbles of 2011, 2013, and 2017. It also predicts that the first fundamental mode bubble after 2017 will occur in 18.4 years, or late May 2027. If we take the lower limit of λ=2.0 from the wavelet analysis, the predicted age is 17.9 years, which is about a year later (late 2026), very close to Giovanni's prediction in 2019.
“The discrete age ratio model and your LPPL fit describe the same underlying discrete scale invariance (λ≈2), just in different coordinate systems; once you consider ln(t_c − t) with age t, noise, and half harmonics, the two are completely consistent, both pointing to the fourth fundamental mode bubble occurring around 2026-2027, with the LPPL model leaning slightly later (around 2027) and the rough age ratio method leaning slightly earlier (around 2026).” — GPT5
What about the bubble in 2021?
In this framework, 2021 is not a fundamental mode but the first harmonic of the fundamental mode (higher frequency but shorter wavelength, as in the LPPL model, where the angular frequency of logarithmic cycle behavior satisfies λ = e^{2π/ω}). The corresponding ratio is the square root of 2.07, which is 1.44. 8.95 × 1.44 = 12.89 years, which corresponds exactly to the end of 2021, highly consistent with the actual age of 12.85 years during the double top bubble.
What about 2025? The logarithmic cycle sequence does not predict a bubble will occur. This year, Bitcoin's performance relative to gold has been weak, which aligns with the expectations of this framework.
Figure 2 shows the complete mapping of the fundamental mode and half harmonic (frequency-wise a first harmonic, wavelength-wise a half harmonic) patterns. The red vertical lines represent the bubble peaks of the fundamental mode, while the blue lines represent the half harmonic. The three red lines fit very well, but the blue lines also reflect the smaller bubbles of that harmonic well. This is not a complete mapping, as there are higher-order harmonics, but they contribute less.
The fourth red line corresponds to the predicted age of 18.4 years, which is the next major bubble of Bitcoin relative to gold. Bitcoin may start rising in value against gold from early 2026 and peak in the second quarter of 2027.

Figure 2
Why does this behavior occur? Continuous Scale Invariance + Discrete Scale Invariance.
To understand Bitcoin's price movements, one must understand both continuous scale invariance and discrete scale invariance. Continuous scale invariance refers to the long-term power law trend that readers are already familiar with. Discrete scale invariance corresponds to intermittent bubbles, which can be described using the LPPL (log-periodic power law) model. The inclusion of "logarithmic cycle power law" in the name can lead to confusion.
The LPPL model is suitable for medium to short-term financial sequences and is specifically used to simulate those large fluctuations that deviate from the core power law trend. Thus, two situations coexist: the overall power law trend (continuous) and the high volatility deviations occurring above it (discrete).
In the long term, Bitcoin's adoption rate follows Metcalfe's law and grows according to a power law.
The emergence of bubbles is triggered by new participants becoming interested when Bitcoin's price breaks through new orders of magnitude (Bitcoin's price has risen over 7 orders of magnitude in its brief but impactful history, i.e., 7 tens).
Bitcoin will only be adopted when it can change your (or an institution's) fate.
In the early days when prices were low, it mainly attracted crypto-punk enthusiasts, retail trading, and investment; over time, it attracted increasingly higher levels of institutional capital: first miners, then exchanges, futures trading, followed by some listed companies, and now sovereign wealth funds, ETFs, and other institutional tools. Currently, institutional capital is a net buyer, and most of their holdings are managed for a large number of clients and shareholders.
When Bitcoin's price and market cap are high enough, pension funds, sovereign wealth funds, and even national treasuries will be tempted to invest. Each subsequent bubble is far higher in terms of gold ounces than the previous one (even higher in fiat terms), leading to a massive adoption of Bitcoin by a large influx of new capital.
Even with a market cap of $2 trillion, Bitcoin is still too cheap for the treasuries of large corporations and mid-sized to large countries to have a significant impact. Even if they could buy 1 million Bitcoins for about $100 billion, it would not "change their fate."
The power law effect of Bitcoin drives larger and larger participants into the market. This effect stems from its protocol itself: attracting hash power, enhancing security, first-mover advantage, etc., all of which will inevitably push prices higher.
Thus, fiat currency is incentivized to flow into Bitcoin, even fiat currency that might have originally flowed into gold is now turning towards Bitcoin. Indeed, Bitcoin's performance relative to gold has been weak in 2025, but according to the analysis above, this is likely a low year for Bitcoin relative to gold.
A new wave of larger players' adoption will arrive in the form of LPPL bubbles, meaning they must collapse at their local critical time points. Therefore, the price trajectory will revert to the long-term power law.
Due to the power law relationship P ~ T^k, where k is the exponent and T is the age, and its first derivative δP / P ~ k/T, the spacing of bubbles is expected to follow a logarithmic relationship. The relative growth rate decreases with the inverse of Bitcoin's age, but the emergence of bubbles requires δP / P >> k/T. By definition, a bubble forms when the price growth rate far exceeds the long-term power law trend.
This expression can be rewritten as δ (log P) ~ k * δ (log T), thus it can be expected that large fluctuations in logarithmic prices (larger multiplicative ratios) require increasingly longer linear time, meaning they need to increase in logarithmic time proportionally, with a magnitude equal to the 1/k root of the required multiplicative fluctuation.
In fact, when calculated in terms of gold prices, the median peak of the bubbles in 2011, 2013, and 2017 is 10.1 times relative to the power law trend, with a power law index of 5.31. It is expected that λ is approximately 10.1^(1/5.31) = 1.55, which is about three-quarters of the value 2.07 obtained from the logarithmic cycle fitting of peak times. Therefore, empirically, when calculated in terms of gold prices, λ ~ (4/3) F^(1/k), where F is the typical ratio of the peak to the power law trend price.
Summary
The main price movements of Bitcoin consist of the following two aspects:
- Continuous scale invariance can be represented by a power law, with an index of about 5.3 when priced in gold and about 5.7 when priced in dollars.
- Discrete scale invariance (DSI) is reflected in intermittent bubble events, as only when the price and market cap reach levels sufficient to attract new capital and the regulatory environment allows, will larger new capital tiers adopt Bitcoin. These discrete scale invariant events can be described using the LPPL model to characterize bubbles and their subsequent crashes.
The 2013 bubble was primarily driven by retail investors, early miners, early Bitcoin startups, and first-generation exchanges. The 2017 bubble attracted participation from hedge funds, family offices, and other high-net-worth individuals, with GBTC trading starting as early as 2015. The peak of the bubble occurred after the launch of futures on the Chicago Mercantile Exchange (CME) in December 2017, enabling efficient shorting and hedging. The 2021 bubble received recognition from some corporate finance departments and a few small government agencies. Due to increased institutional participation and related mechanisms, the ability to hedge and short was also stronger, leading to the eventual collapse of the bubble, allowing prices to spring back to the power law trend.
The next wave of large-scale adoption is expected to concentrate around 2026 and 2027, when Bitcoin's market cap is anticipated to approach $5 trillion, attracting long-term allocations from large corporations, sovereign wealth funds, and governments (national pension funds and national treasuries). The phase bubbles of Bitcoin reflect different tiers of global capital: from retail to funds, then to corporations, and finally to sovereign nations, leading to DSI behavior and a decrease in volatility associated with increased market cap and institutional participation.
“Each tier of capital will only be unlocked when Bitcoin is large enough, liquid enough, and credible enough—due to its returns growing in a power law manner and decaying at k/t, this process requires increasingly longer time.” — ChatGPT 5
The fundamental mode wavelength parameter λ = 2.07 (logarithmic time) roughly corresponds to twice the bubble intervals. The 2017 bubble was the last fundamental mode, the 2021 bubble was the first harmonic, and under this framework, no bubble is expected in 2025. The next peak of Bitcoin priced in gold is expected to occur between the fourth quarter of 2026 (the lower limit of wavelet analysis) and the second quarter of 2027 (the value from Fourier analysis).
Related reading: Bull or Bear? 5 Major Signals Dominating Bitcoin's New Cycle
免责声明:本文章仅代表作者个人观点,不代表本平台的立场和观点。本文章仅供信息分享,不构成对任何人的任何投资建议。用户与作者之间的任何争议,与本平台无关。如网页中刊载的文章或图片涉及侵权,请提供相关的权利证明和身份证明发送邮件到support@aicoin.com,本平台相关工作人员将会进行核查。


