Why Many Trusted Bitcoin Top Indicators Failed in This Cycle and How New Dynamic Models Can Better Track the Ever-Changing Market Structure
Author: Bitcoin Magazine Pro
Translation: Baihua Blockchain

In the recent bull market, many of the most popular Bitcoin top indicators failed to trigger, leading observers to question whether the underlying data has "failed." This article analyzes some widely used tools, explores the reasons for their poor performance in this cycle, and outlines how to adjust them based on Bitcoin's ever-evolving market structure.
Price Tool Predictions
On Bitcoin Magazine Pro's price prediction tool indicators, the recent bull market never reached several historically reliable top models, such as Delta Top, Terminal Price, and Top Cap (not even in the previous cycle). The Bitcoin Investor Tool, which uses two moving averages multiplied by 5, also went untested, while the Pi Cycle Top Indicator, although closely watched by many traders, failed to provide accurate timing or price signals. This has led to understandable questions: Have these models stopped working, or has Bitcoin surpassed them?
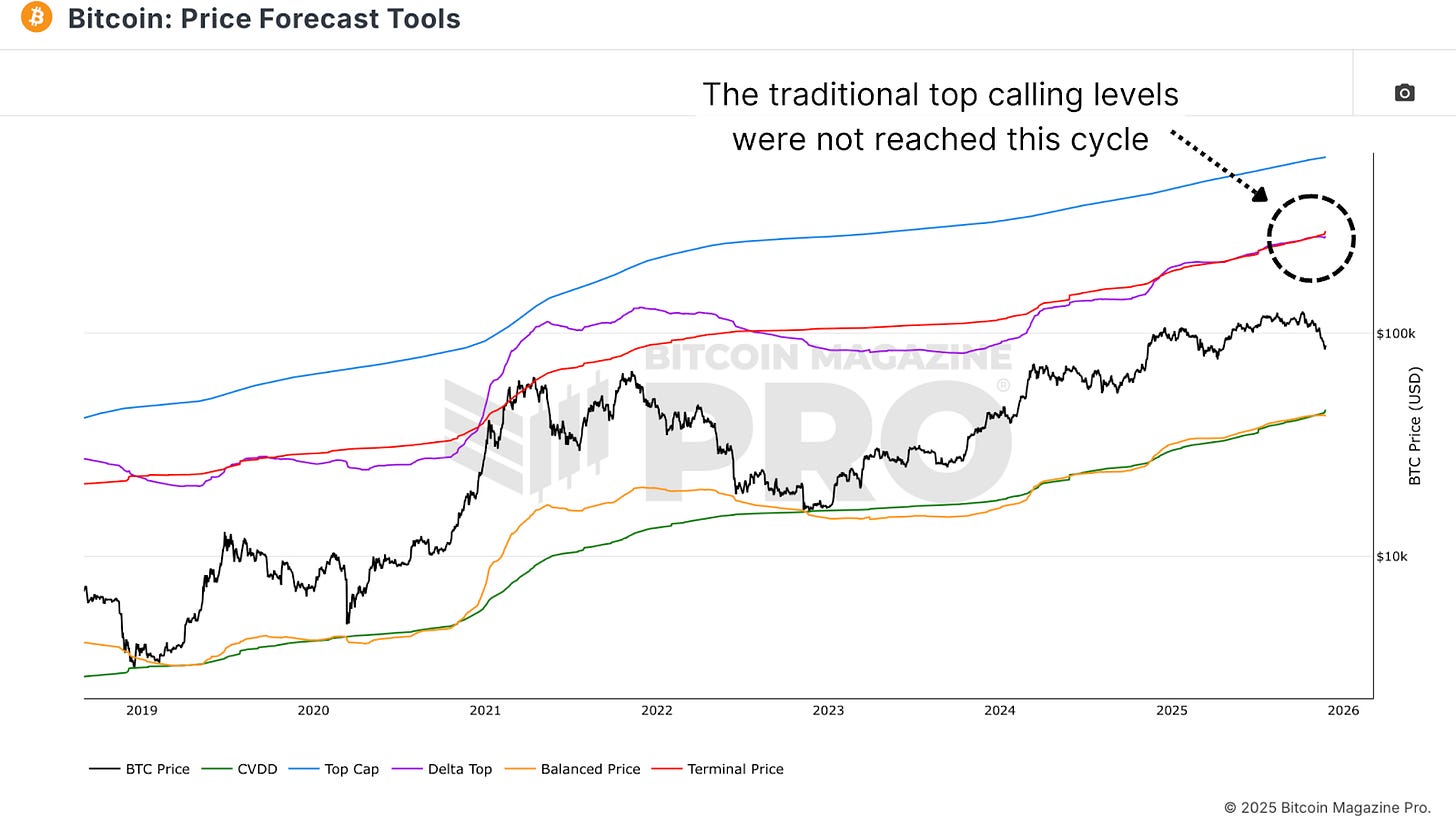 Figure 1: Historically reliable top models, such as Top Cap, Delta Top, and Terminal Price, did not trigger in this bull market cycle.
Bitcoin is an ever-evolving asset, with its market structure, liquidity, and participant engagement all changing. Rather than assuming the data has worked, it is more appropriate to adjust these indicators from different perspectives and time frames. The goal is not to abandon these tools but to make them more robust and responsive to a market that no longer provides the same exponential rises and cycle tops as it did in previous years.
From Fixed to Dynamic
The MVRV Z-Score 2-Year Rolling Indicator has been a core tool for identifying market overheating, but it did not lead the bull market peaks well in this cycle. When Bitcoin first broke through the $73,000–$74,000 range, the indicator saw a significant spike but failed to provide a clear exit signal for the later rise. Currently, the indicator is showing the most oversold readings on record.
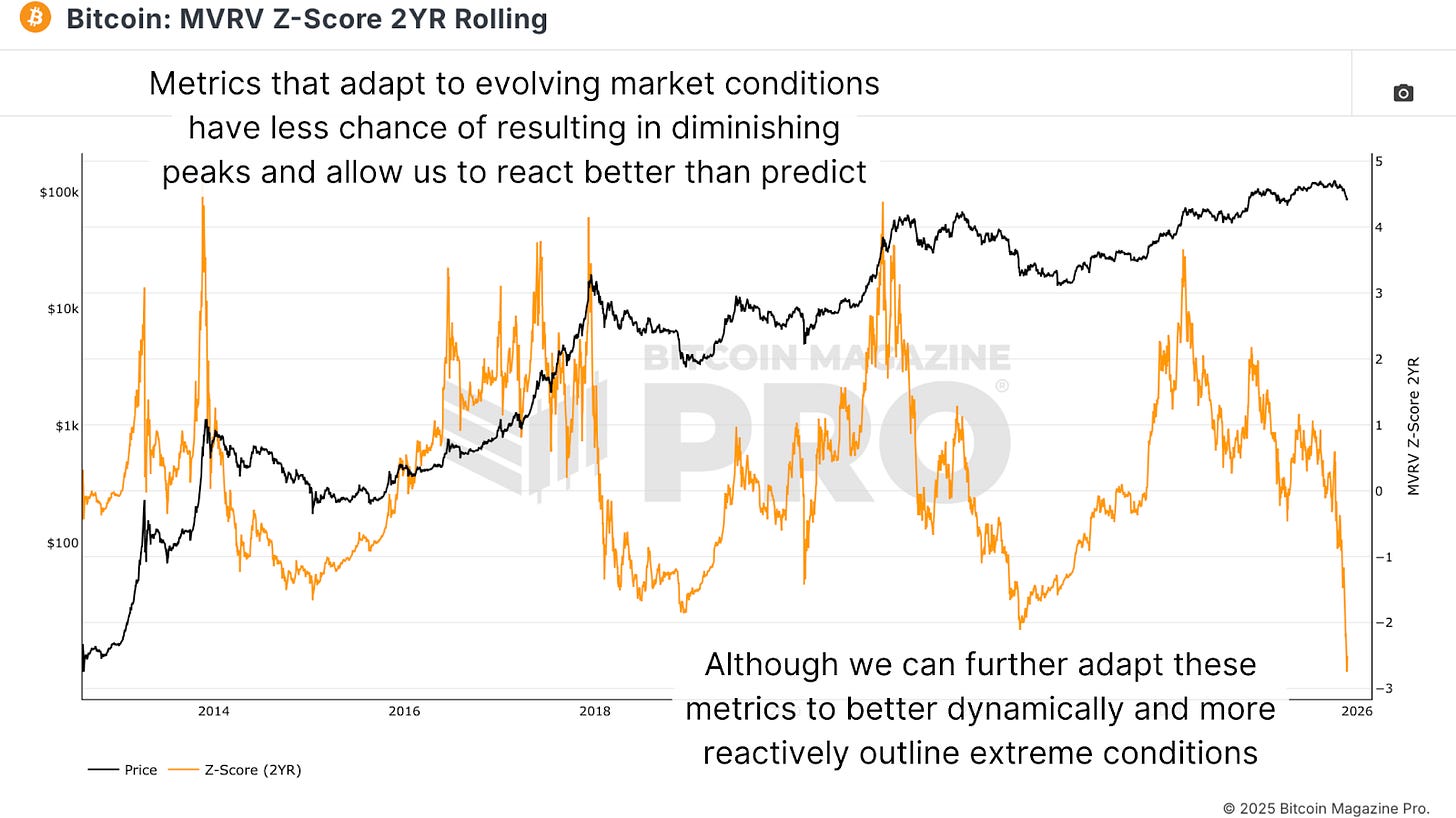 Figure 2: The usually reliable MVRV Z-Score 2-Year Rolling Indicator failed to trigger an exit signal in the cycle.
To address this flaw, the MVRV Z-Score can be restructured on a 6-month rolling basis instead of two years, making it more sensitive to recent conditions while still based on realized value dynamics. In addition to a weekly lookback period, abandoning fixed thresholds in favor of a dynamic distribution-based range is also helpful. By marking the proportion of days spent above or below different Z-Score levels, one can identify, for example, the top 5% region, as well as the bottom 5%. In this cycle, when Bitcoin first broke through $100,000, the indicator did signal in the upper region, and historically, the trend of entering the top 5% region has correlated quite well with cycle recoveries, even if they did not capture the ideal peak.
 Figure 3: The readjusted 6-month MVRV Z-Score, with targeted upper and lower percentages, provides more timely buy/sell signals.
Faster Reactions
In addition to valuation tools, activity-based indicators like Coin Days Destroyed can enhance their utility through the entire cycle's lookback period. The 90-day moving average of Coin Days Destroyed has historically tracked large sell-offs by long-term holders, but due to the more cautious and volatile trends in the current cycle, the 30-day moving average often provides more relevant information. As Bitcoin no longer offers the same parabolic rises, indicators need to react faster to reflect shallower but still significant profit-taking and investor rotation waves.
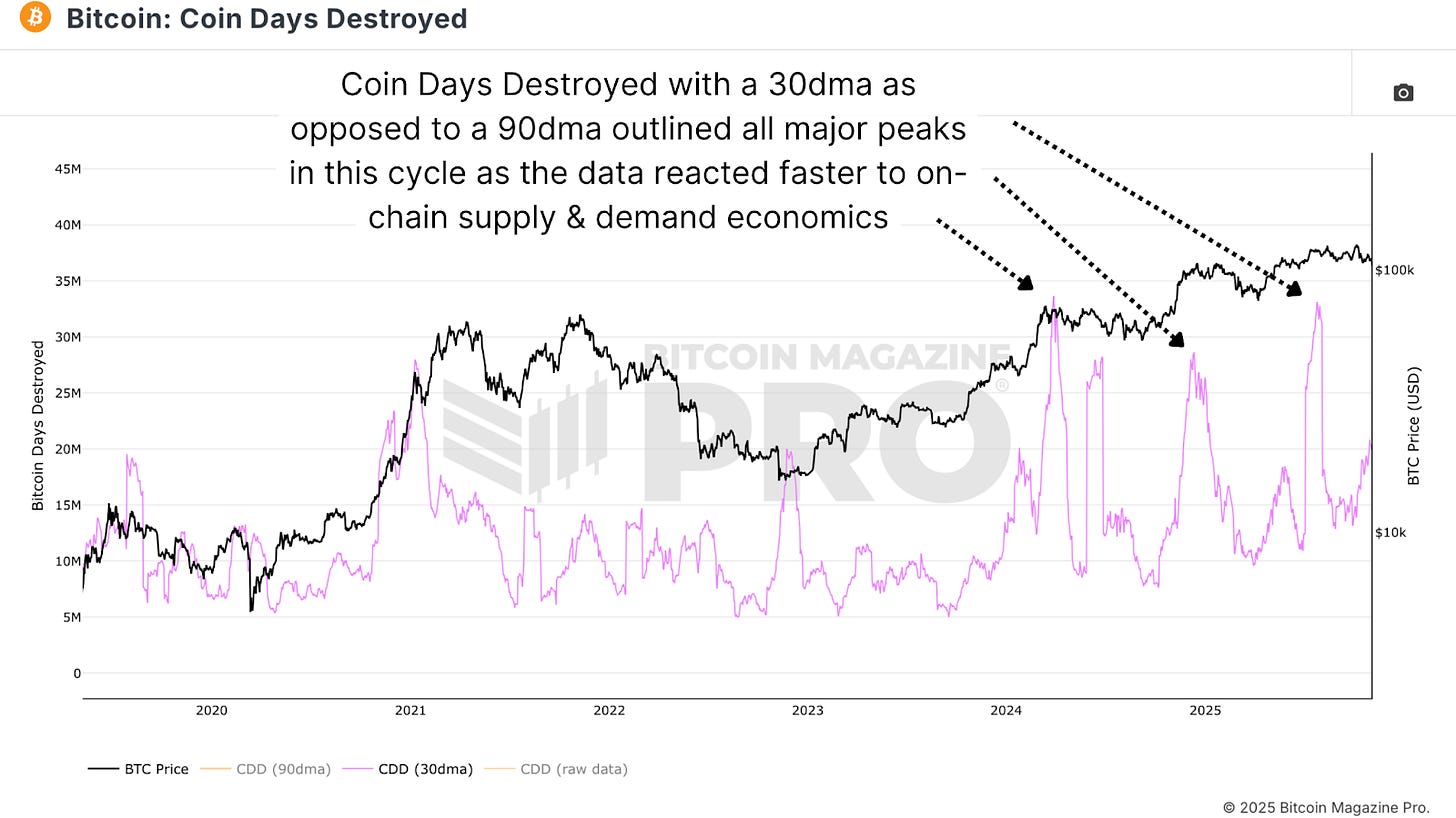 Figure 4: The 30-day moving average of Coin Days Destroyed has proven to respond more quickly to on-chain dynamics.
Fixing recent readings and potentially capturing the rise before new historical highs in this cycle, the 30-day Coin Days Destroyed indicator almost triggered at the cycle peak. It marked the price breakout when Bitcoin first crossed approximately $73,000–$74,000 and when it broke $100,000, effectively marking all key sell-off waves. While this is easy to observe in hindsight, it reinforces a point: on-chain supply and demand signals remain relevant; the task is to infer them based on current volatility and market depth.
Spent Output Profit Ratio (SOPR)
The Spent Output Profit Ratio (SOPR) provides another perspective on realized profit and loss, but the raw data can be quite messy, with volatile spikes, mean reversion of profits and losses, and significant fluctuations during rallies and mid-bull market capitulations. To extract more actionable information, the SOPR changes can be smoothed using a 28-day (monthly) average. This smoothed alternative highlights that in short-term windows, the final realization trend reaches extreme levels, leading to volatility in cycle fluctuations.
 Figure 5: Applying a 28-day moving average to the SOPR indicator can smooth the data, reduce excess "noise," and accurately identify local tops.
Evaluating the recent cycle, monthly SOPR changes produced notable peaks when Bitcoin first broke the $73,000–$74,000 range, again when it broke $100,000, and around the $120,000 area. While none of these perfectly captured the ultimate peak, they strongly correlated with the fatigue phase of the cycle, promoting the end pressure stage. Utilizing monthly changes instead of the raw indicator makes the signals clearer, especially when cross-asset observations are made against Bitcoin's purchasing power relative to stocks and gold.
Conclusion
In hindsight, the top indicators popular throughout the bull market, if simplified through the correct perspective and appropriate time frames, did indeed play a role. The key principle remains: react to the data, do not try to predict. Rather than waiting for any single indicator to perfectly predict a top, it is better to use a basket of adjusted indicators and interpret them through the lens of strength and the ever-changing market dynamics, which can increase the probability of identifying when Bitcoin is overheated and when it transitions to a more favorable accumulation phase. The coming months will focus on refining these models to ensure they remain effective not only historically but also maintain their integrity and accuracy in the future.
Article link: https://www.hellobtc.com/kp/du/12/6144.html
Source: https://bmpro.substack.com/p/are-bitcoins-top-calling-metrics
免责声明:本文章仅代表作者个人观点,不代表本平台的立场和观点。本文章仅供信息分享,不构成对任何人的任何投资建议。用户与作者之间的任何争议,与本平台无关。如网页中刊载的文章或图片涉及侵权,请提供相关的权利证明和身份证明发送邮件到support@aicoin.com,本平台相关工作人员将会进行核查。


