TL, DR

In November 2025, the U.S. faced a government shutdown that led to missing key economic data. Coupled with weak employment, declining consumption, and unclear policy direction, market expectations fluctuated repeatedly, revealing a divergence between economic growth and inflation signals. Although external risks eased somewhat, the overall recovery remained moderate, increasingly reliant on policy transparency, data recovery, and market confidence.
In November, the average daily trading volume in the crypto market was approximately $180.8 billion, characterized by short-term activity with frequent inflows and outflows of funds but lacking a sustained trend. During the same period, the total market capitalization fell from about $3.88 trillion to a low of $2.98 trillion, with several brief rebounds failing to reverse the overall downward trend. Newly launched popular tokens like Monad, Pieverse, and Allora saw active trading, while meme projects remained relatively inactive.
In November, BTC spot ETFs experienced a significant net outflow of $35.8 billion, while ETH spot ETFs saw a net inflow of $8.34 billion. At the same time, the overall circulation of stablecoins decreased by $2.34 billion, indicating that the crypto market was significantly affected by price declines and low market sentiment, leading to notable fluctuations in capital flow.
Last week, BTC fell by about 8%, but the pullback attracted bargain hunters, and it is currently attempting to return above $88,000. Whether it can break through the 20-day EMA ($94,620) in the short term will determine the dominant direction between bulls and bears. ETH and SOL are also oscillating near key moving averages, with ETH facing resistance in the $3,148–$3,350 range, while SOL is testing bullish strength in the $126–$145 range. If both can break through their respective key moving averages, market sentiment may shift to bullish; otherwise, bears will remain dominant, and the risk of downward correction will persist.
This month, Coinbase launched its token public offering feature for the first time, Monad showed significant volatility, and Uniswap proposed the "UNIfication" proposal, aiming to enhance the protocol value and long-term competitiveness of UNI through a deflationary mechanism and governance restructuring. Looking ahead to next month, Circle is accelerating its Arc ecosystem layout and exploring native token issuance, while Dogecoin and XRP ETFs have been approved for listing, marking the official opening of the altcoin ETF market, with more token products likely to accelerate their launch in the future.
1. Macroeconomic Perspective
In November 2025, the U.S. faced a government shutdown that led to missing key economic data, causing market judgments on fundamentals to reverse multiple times, with clear divergence in economic expectations. Although the earnings reports of AI and high-tech companies were decent, weak employment, declining consumption, and unclear policy direction complicated the overall economic performance.
Policy Direction
In November, the Federal Reserve emphasized patience in the face of missing data to avoid new shocks to the fragile economic environment. The statistical interruptions caused by the government shutdown created an information gap for policymakers, leading to fluctuating market expectations regarding future interest rate paths. On one hand, weak employment pushed some market participants to bet on earlier rate cuts; on the other hand, persistent inflation and fiscal risks reinforced arguments for maintaining rates longer. Policy expectations continuously switched between easing and caution, becoming a major source of volatility in the financial markets in November.
U.S. Stock Market Trends
In November, U.S. stocks experienced a noticeable pullback under the pressure of changing policy expectations. The uncertainty regarding the timing of rate cuts, the data gap caused by the government shutdown, and weakening employment and consumption collectively suppressed market risk appetite. At the end of the month, driven by renewed expectations for rate cuts and a decline in long-term U.S. Treasury yields, the three major stock indices saw a brief rebound. The future trajectory of U.S. stocks will depend on whether core data confirms economic slowdown and inflation retreat, allowing the Federal Reserve to continue cutting rates in December. If policies are clear and liquidity improves, the market is expected to regain upward momentum; otherwise, the technology and growth sectors may still face further valuation correction pressure.
Inflation Remains Above Target
The government shutdown led to missing data in some inflation components, increasing short-term instability in market judgments on price trends. Although the latest data shows slight relief in price pressures, prices in sectors such as services and housing remain strong, indicating that structural inflation has not fully dissipated. The Federal Reserve reiterated that, in the context of discontinuous data, it cannot rely on a single signal for judgment, and the inflation path still requires several months of complete samples for verification.
Employment Market Further Weakens
The interruption of employment market statistics in November obscured the true situation, making judgments more difficult. The delayed September non-farm report from the U.S. Bureau of Labor Statistics showed a significant addition of 119,000 jobs, exceeding expectations, but the unemployment rate rose to a four-year high of 4.4%, with substantial downward revisions to the previous two months' data. The reports for October and November will be released together on December 16, meaning the September report will be the last employment report the Federal Reserve sees before its December 10 meeting, making December's decision more challenging.
Political, Fiscal, and External Risks Persist
Although the government shutdown has ended and fiscal spending and statistical work are gradually resuming, the previously accumulated contract delays and budget pressures will still take time to digest. Meanwhile, the external environment showed significant improvement in November: the U.S. and China resumed and reached a phased agreement in negotiations, helping to reduce tensions in the technology and trade sectors; the Russia-Ukraine conflict also showed signs of nearing a ceasefire, significantly reducing geopolitical spillover risks. The shift towards improvement in external uncertainties creates conditions for stabilizing global supply chains and restoring corporate expectations.
Outlook
As the government returns to normal operations, missing data will gradually be filled in over the coming weeks. The future recovery path depends on whether inflation can continue to decline with complete data support, whether employment can stabilize under policy support, and whether easing policies can regain a clear direction after repeated expectations. Overall, the U.S. is in a loosening cycle, with moderate economic recovery but increasing volatility, and the recovery process is increasingly dependent on policy transparency and market confidence.
2. Overview of the Crypto Market
Currency Data Analysis
Trading Volume & Daily Growth Rate
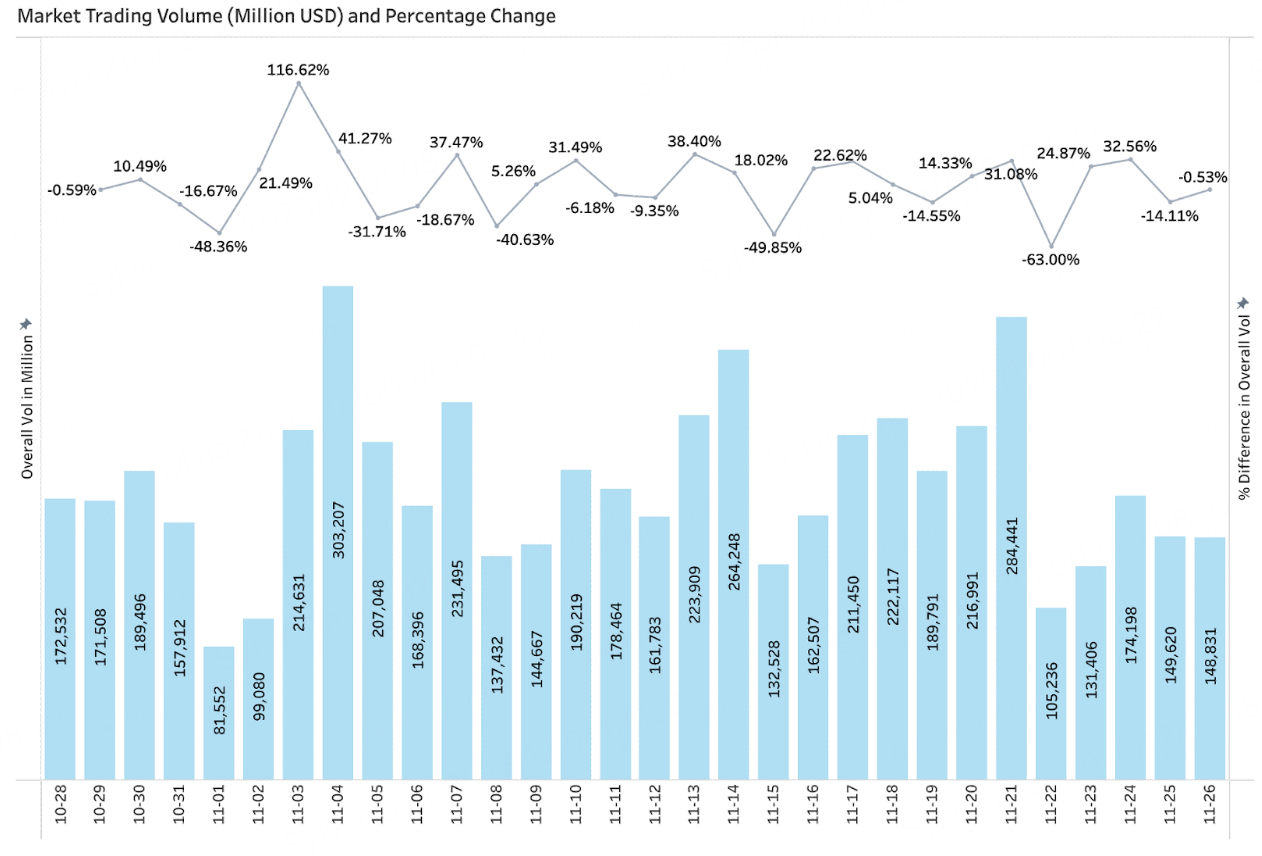
According to CoinGecko data, as of November 26, the overall trading volume in the crypto market showed significant fluctuations, with an average daily trading volume of approximately $180.8 billion. Overall, at the beginning of November, there was a rapid rebound in trading volume after a brief pullback, maintaining a high range of oscillation in the middle of the month with frequent inflows and outflows of funds. Although there were again local peaks in trading volume in the latter part of the month, they failed to create sustained momentum, and trading volume subsequently fell significantly, indicating that funds preferred short-term speculation rather than establishing trend-based positions.
Total Market Capitalization & Daily Growth
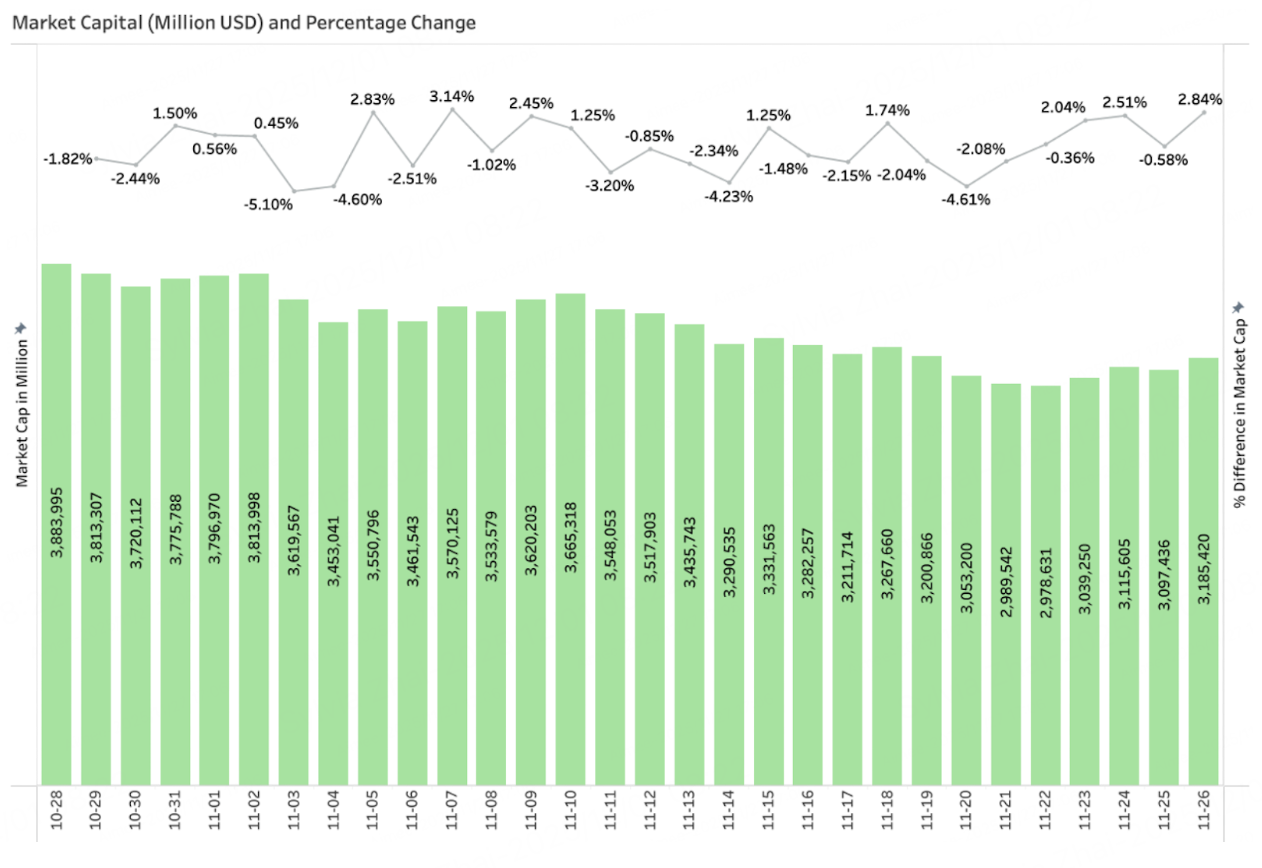
According to CoinGecko data, as of November 26, the overall market capitalization of the crypto market showed a downward trend. At the beginning of the month, the market capitalization was about $3.8 trillion, which subsequently continued to decline through several small rebounds and pullbacks, with the low points being refreshed (falling from $3.88 trillion to a low of $2.98 trillion). During this period, there were several brief rebounds of 2%–3%, but none reversed the overall downward structure. Overall, the market capitalization performance in November was weak, showing structural correction characteristics, with panic sentiment spreading in the market.
Newly Launched Popular Tokens in November
The newly launched popular tokens in November were still mainly VC-backed projects, with low activity in meme tokens. Among them, projects like Monad, Pieverse, and Allora performed prominently, with active trading after their launch.
Token
Token Fullname
CoinGecko/CoinMarketCap
Exchange
Monad
MON
https://coinmarketcap.com/currencies/monad/
Bitmart, Bybit, Gate, Coinbase, Bitget, Crypto.com, Huobi, Kucoin, Mexc
Kite
KITE
https://coinmarketcap.com/currencies/kite/
Bitmart, Binance, OKX, Gate, Coinbase, Bitget, Crypto.com, Huobi, Kucoin, Mexc, Lbank, Phemex
Allora
ALLO
https://coinmarketcap.com/currencies/allora/
Bitmart, Binance, OKX, Gate, Coinbase, Bitget, Huobi, Kucoin, Mexc, Lbank, Phemex
UnifAI Network
UAI
https://coinmarketcap.com/currencies/unifai-network/
Bitmart, Gate, Bitget, Kucoin, Mexc, Phemex
Pieverse
PIEVERSE
https://coinmarketcap.com/currencies/pieverse/
Bitmart, Bybit, Gate, Mexc, Lbank, Phemex
Irys
IRYS
https://coinmarketcap.com/currencies/irys/
Bitmart, Coinbase, Bitget, Kucoin, Mexc, Lbank
Datagram Network
DGRAM
https://coinmarketcap.com/currencies/datagram-network/
Bitmart, Gate, Bitget, Mexc, Lbank, Phemex
Planck
PLANCK
https://coinmarketcap.com/currencies/planck/
Bitmart, Gate, Bitget, Huobi, Kucoin, Phemex
3. On-Chain Data Analysis
Analysis of BTC and ETH ETF Inflows and Outflows
November BTC Spot ETF Net Outflow of $35.8 Billion
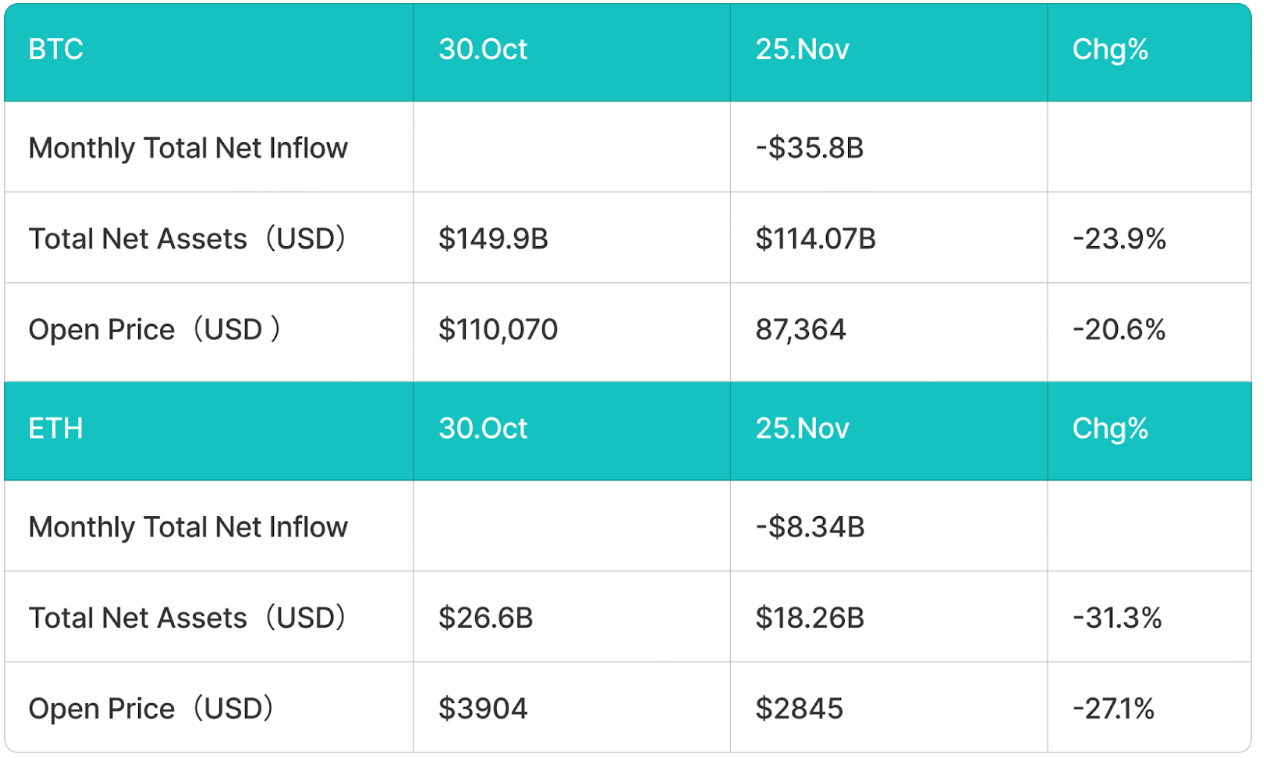
This month, the BTC spot ETF experienced significant outflows, with a net outflow of $35.8 billion, a decrease of 23.9% compared to the previous month. This trend was primarily influenced by the decline in BTC prices, which fell by 20.6% during the month, triggering redemption pressures and simultaneously shrinking the total asset value of the ETF. Since the black swan event on October 11, the overall rebound of crypto assets has been weak, with BTC and other token prices insufficiently recovering, leading to persistently low market sentiment and further exacerbating capital outflows.
November ETH Spot ETF Net Inflow of $8.34 Billion
This month, the ETH spot ETF also saw significant outflows, with a net outflow of $8.34 billion, a decrease of 31.3% compared to the previous month. The decline in BTC prices led to a substantial drop in the overall crypto market, and the continued market weakness intensified the outflow of ETH ETF funds.
Analysis of Stablecoin Inflows and Outflows
November Stablecoin Total Circulation Decreased by $2.34 Billion
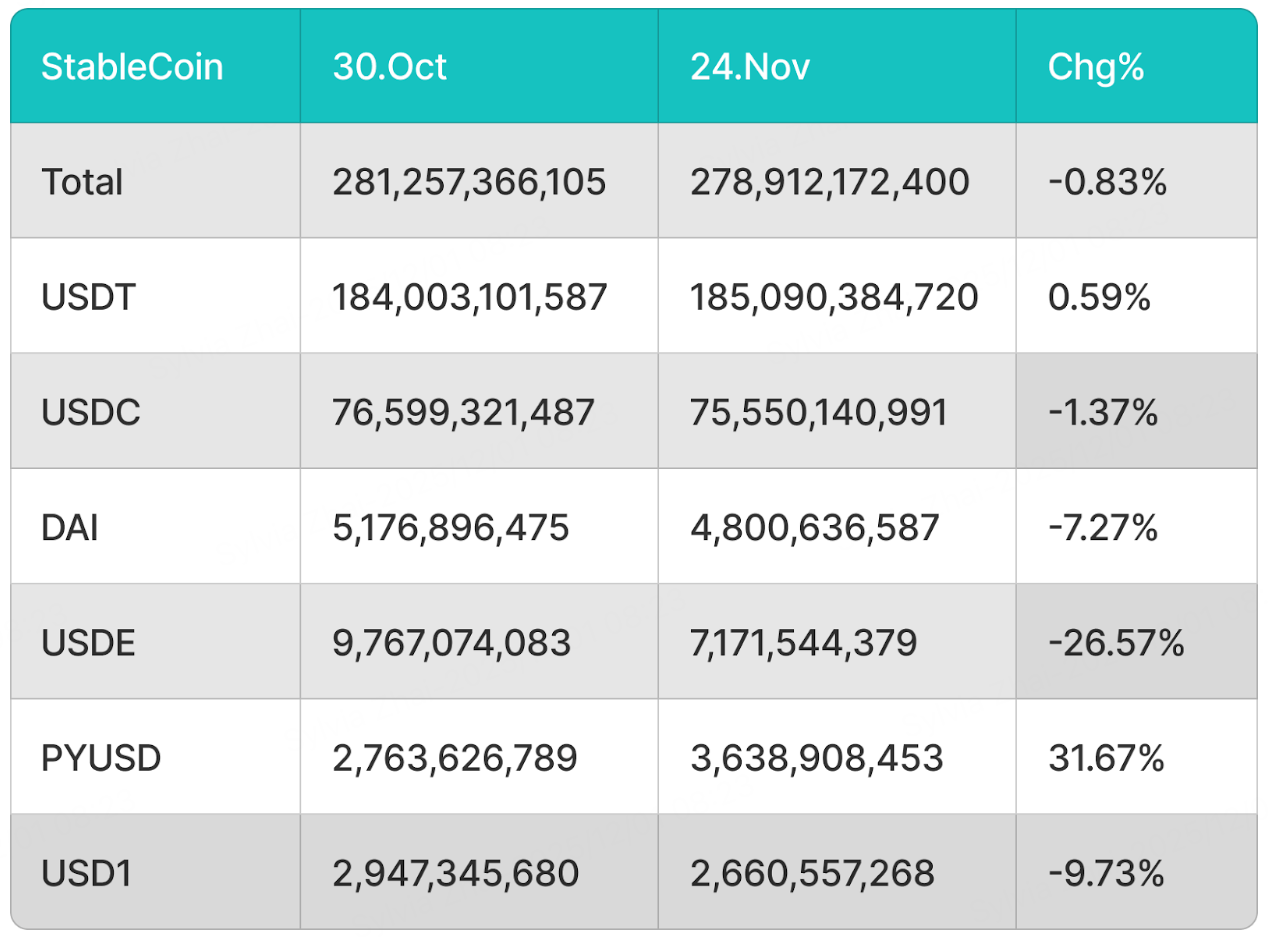
Due to the significant downturn in the crypto market, the inflow of incremental funds from the over-the-counter market has noticeably slowed, resulting in a decline in the overall circulation of stablecoins for the first time since 2025. Except for USDT and PYUSD, which still maintained a slight net inflow, other mainstream stablecoins recorded significant outflows. Among them, USDE was severely impacted by the black swan event on October 11 and the de-pegging of several algorithmic stablecoins, leading to a sharp decline in market confidence and a monthly circulation drop of about 26.5%. Additionally, leading stablecoins like USDC and DAI also experienced varying degrees of contraction due to low market sentiment.
4. Price Analysis of Mainstream Currencies
BTC Price Change Analysis
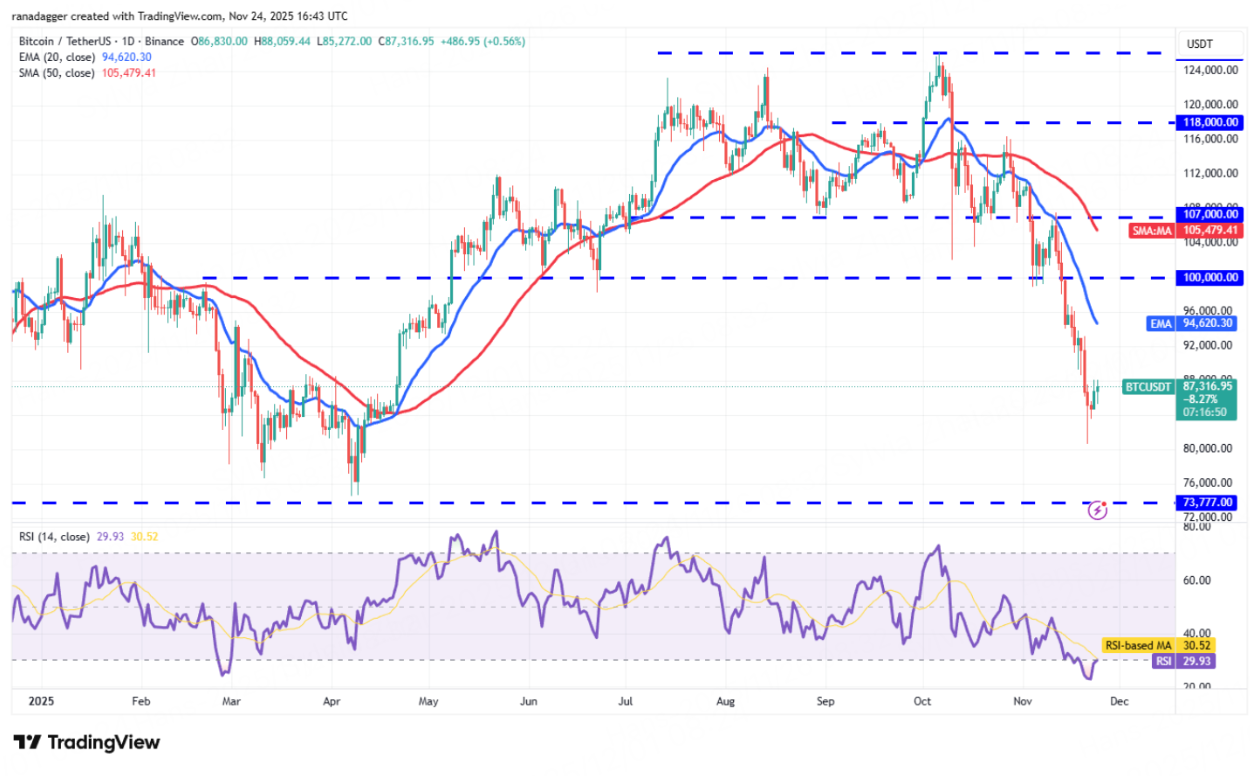
BTC fell about 8% last week, influenced by the overall weakening market sentiment, but the pullback successfully attracted bargain hunters. As the new week begins, bulls are attempting to push the price back above $88,000, indicating a recovery in confidence after last week's volatility.
Currently, BTC is rebounding from a sharp drop to a low of $80,600, but the upward path remains challenging. The 20-day Exponential Moving Average (EMA, $94,620) remains a key resistance level that may determine the short-term trend. If the price encounters strong rejection at this moving average, it would indicate that bearish sentiment still dominates, with sellers likely to exit positions during the rebound. In this scenario, a downward correction may accelerate, targeting the historically significant support area at $73,777, where buying interest may attempt to regain control.
If bulls hope to gain substantial momentum, BTC must effectively break through and hold above the 20-day EMA to prove that recent selling pressure has significantly weakened. Once the price stabilizes above this level, market sentiment may shift noticeably towards bullish, giving BTC/USDT the opportunity to further approach the next important psychological level: $100,000.
ETH Price Change Analysis
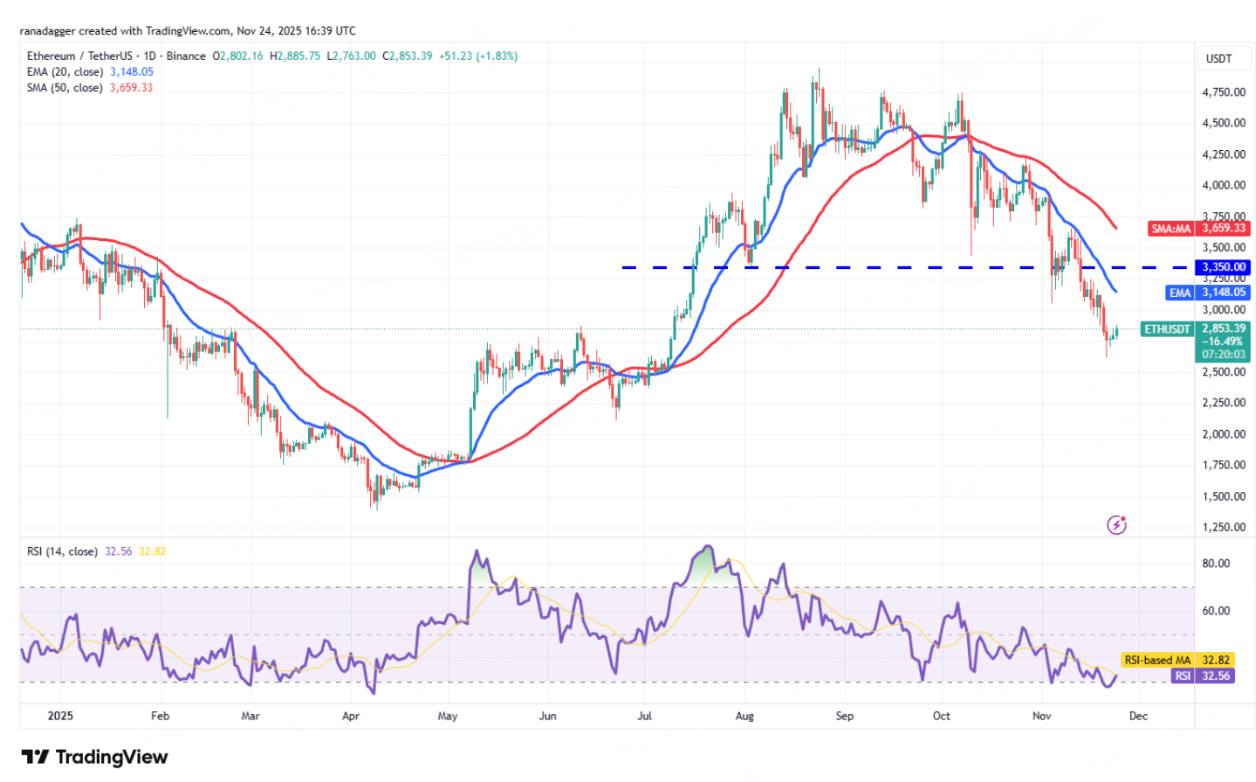
ETH is attempting to recover from its recent downtrend, but it faces significant supply pressure between the 20-day EMA ($3,148) and $3,350. This area has previously constituted resistance multiple times, and buyers need stronger momentum to effectively break through. If ETH fails to surpass this upper resistance zone, bears may quickly regain the advantage. A drop below $2,623 would strongly confirm the beginning of a new downward trend and could lead ETH to further decline to $2,400, or even as low as $2,111.
Conversely, if ETH strongly breaks through $3,350, it would indicate a resurgence in buying momentum, with buyers willing to support at higher price levels. In this scenario, ETH/USDT would have the opportunity to challenge the 50-day Simple Moving Average (SMA, $3,659). If the closing price can stabilize above the 50-day SMA, it would further validate the reversal of market sentiment, suggesting that bulls are preparing for a larger-scale rebound.
SOL Price Change Analysis
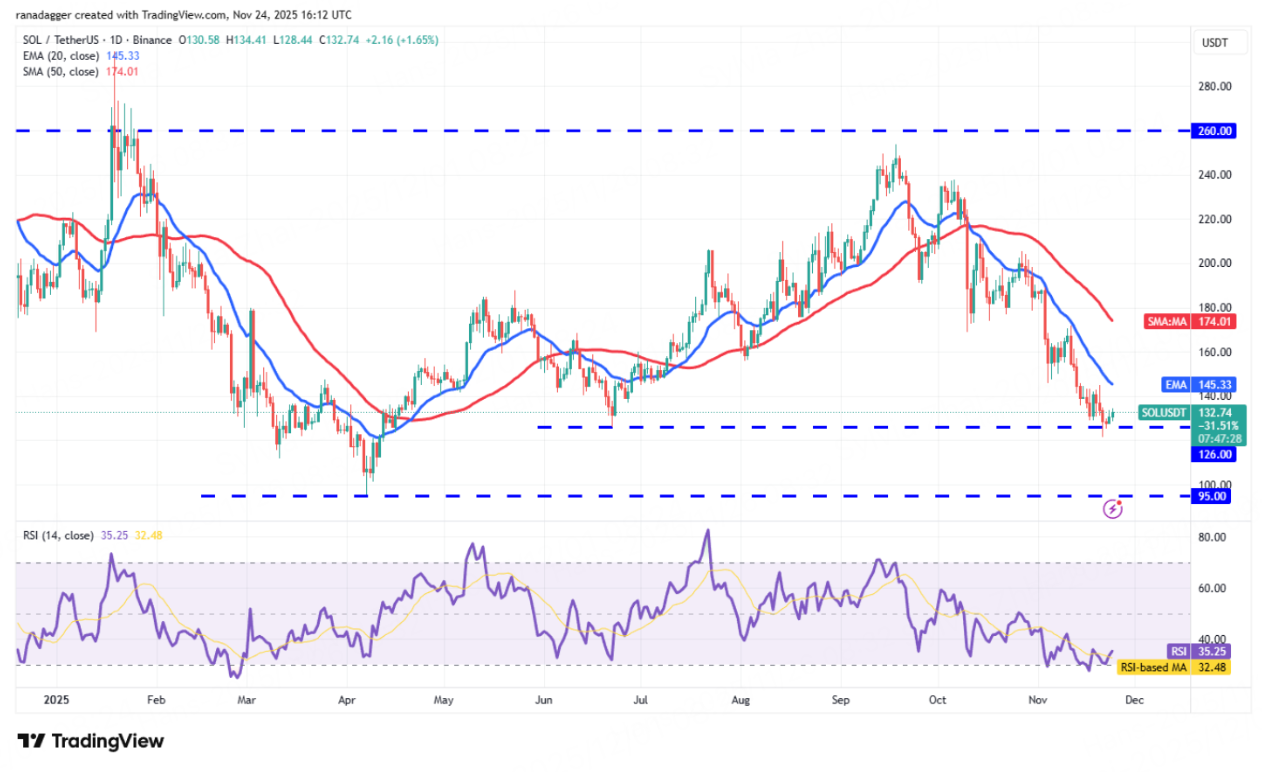
SOL is attempting to stabilize at the $126 support level, but the current rebound strength is weak, indicating insufficient buying interest. This cautious attitude suggests that bulls remain hesitant in the face of recent market weakness. If SOL fails to build momentum and retreats from the current price level or the 20-day EMA ($145), it would indicate that bears still firmly control the high price area. A drop below $126 could trigger further accelerated declines, targeting $110, and potentially even dropping to $95—an area that has historically served as significant support.
However, if buyers successfully push SOL above and stabilize above the 20-day EMA, it could be seen as an early signal of bullish return. If the closing price can stabilize above this key moving average, SOL is expected to further rebound to the 50-day SMA ($174), where bulls will face the next significant test.
5. Hot Events This Month
Coinbase Launches Public Sale Function for the First Time, Monad Underperforms Expectations
This month, Coinbase announced the launch of its token public offering feature, with Monad as the first project. Starting from November 17, the platform offered 7.5 billion MON to the public at a price of $0.025, accounting for 7.5% of the total token supply, valuing the project at approximately $2.5 billion. Before the launch, MON reached a peak trading price of about $0.051 on Binance's over-the-counter market, corresponding to a market capitalization of nearly $5.1 billion, reflecting relatively optimistic market sentiment.
However, after officially opening on November 24, MON's price plummeted, hitting a low of about $0.0204, briefly falling below the public offering price and triggering panic selling. After the selling pressure was digested, the price quickly rebounded, reaching as high as $0.048. As of November 28, Coinbase's first public offering project recorded approximately 92% in maximum returns, showing a clear volatile market structure.
Uniswap Launches "UNIfication" Proposal: Restructuring Protocol Value and Governance Framework
This month, Uniswap founder Hayden Adams and Uniswap Labs officially submitted the "UNIfication" proposal, which focuses on activating the protocol fee switch and introducing a deflationary mechanism, transitioning UNI from a governance token to an asset that can actually capture protocol value. The proposal initially plans to burn 100 million UNI as retroactive compensation, followed by the launch of a long-term deflationary mechanism: extracting a portion of LP trading fees from v2 and v3 pools to inject into TokenJar, with the contract achieving value recapture through the burning of UNI; simultaneously, a protocol fee discount auction will be introduced, with proceeds also used to burn UNI.
In terms of governance, the proposal suggests restructuring Uniswap's governance framework into a Wyoming DUNA entity called "DUNI," enhancing legal liability protection; Labs will also integrate the ecosystem and product teams and eliminate interface, wallet, and API fees, focusing entirely on protocol growth. The market reacted positively, with UNI significantly rising after the announcement. However, the activation of the fee switch may lead to a decline in LP earnings, prompting some liquidity migration. But in the long run, Uniswap is attempting to leverage its brand and technological advantages (especially v4) to expand from a single DEX to a platform-level ecosystem. Overall, "UNIfication" marks a comprehensive upgrade in Uniswap's economic model and organizational structure, and if progress goes smoothly, it will reshape UNI's value logic and enhance the protocol's long-term competitiveness.
6. Outlook for Next Month
Circle Accelerates Arc Ecosystem Layout, Exploring Native Token Issuance as a Strategic Turning Point
This month, stablecoin issuer Circle released its Q3 financial and business progress report, focusing on the expansion of its new public chain Arc and potential token plans. Arc launched its public testnet at the end of October, with over 100 institutions currently participating. In the report, Circle explicitly stated that it is exploring the issuance of a native token on the Arc network, indicating that the company is transitioning from a single stablecoin issuer to a blockchain infrastructure builder, and is attempting to complete the ecological loop of Arc through token incentives to consolidate its competitive advantages in stablecoin payments, foreign exchange, and capital markets.
In terms of financial performance, Circle's Q3 revenue grew by 66% year-on-year to approximately $740 million, with net profit increasing by 202% year-on-year, and USDC's market capitalization surpassing $73 billion, firmly holding the position of the second-largest stablecoin globally. As global regulations tighten, the compliance advantages of MiCA become prominent, and the narrative around stablecoins continues to heat up, Circle views the Arc layout as a key strategy to respond to Tether's public chain ecosystem expansion. If the native token is successfully launched, it will become a core lever to drive the adoption and community participation of the Arc network, potentially forming a new growth engine in DeFi, RWA, and cross-border payment sectors.
Doge and XRP ETFs Approved, Altcoin ETF Season Officially Opens
On November 26, the spot ETFs for Dogecoin and XRP were officially launched, marking the entry of altcoin assets into the ETF era. Data shows that the DOGE spot ETF had a net inflow of $365,000 on its first day, while the XRP spot ETF saw a net inflow of as much as $21.81 million on its launch day. This not only signifies that mainstream altcoins have officially entered compliant financial channels but also indicates that the issuance of altcoin ETFs will enter a phase of intensive explosion, with more token products likely to accelerate regulatory completion.
At the same time, Bitwise is advancing the process of the Avalanche spot ETF, submitting an application update to the SEC. The ETF code is BAVA, with a management fee of 0.34%, planning to use 70% of the AVAX holdings for staking, making it one of the first crypto ETFs in the U.S. market with a yield generation mechanism. In contrast, VanEck's Avalanche ETF has a fee of 0.40%, while Grayscale's product is as high as 0.50%. As ETF competition enters a phase of fee and yield structure comparison, crypto assets are rapidly integrating into traditional financial valuation systems, evolving from a single asset exposure to an investment category that can generate returns.
免责声明:本文章仅代表作者个人观点,不代表本平台的立场和观点。本文章仅供信息分享,不构成对任何人的任何投资建议。用户与作者之间的任何争议,与本平台无关。如网页中刊载的文章或图片涉及侵权,请提供相关的权利证明和身份证明发送邮件到support@aicoin.com,本平台相关工作人员将会进行核查。