Market Overview
To systematically present the current funding behavior and trading structure changes in the cryptocurrency market, this report analyzes five key dimensions: the price volatility of Bitcoin and Ethereum, the Long/Short Ratio (LSR), contract open interest, funding rates, and market liquidation data. These five indicators cover price trends, funding sentiment, and risk conditions, providing a comprehensive reflection of the current market's trading intensity and structural characteristics. The following sections will analyze the latest changes in each indicator since November 4:
1. Analysis of Bitcoin and Ethereum Price Volatility
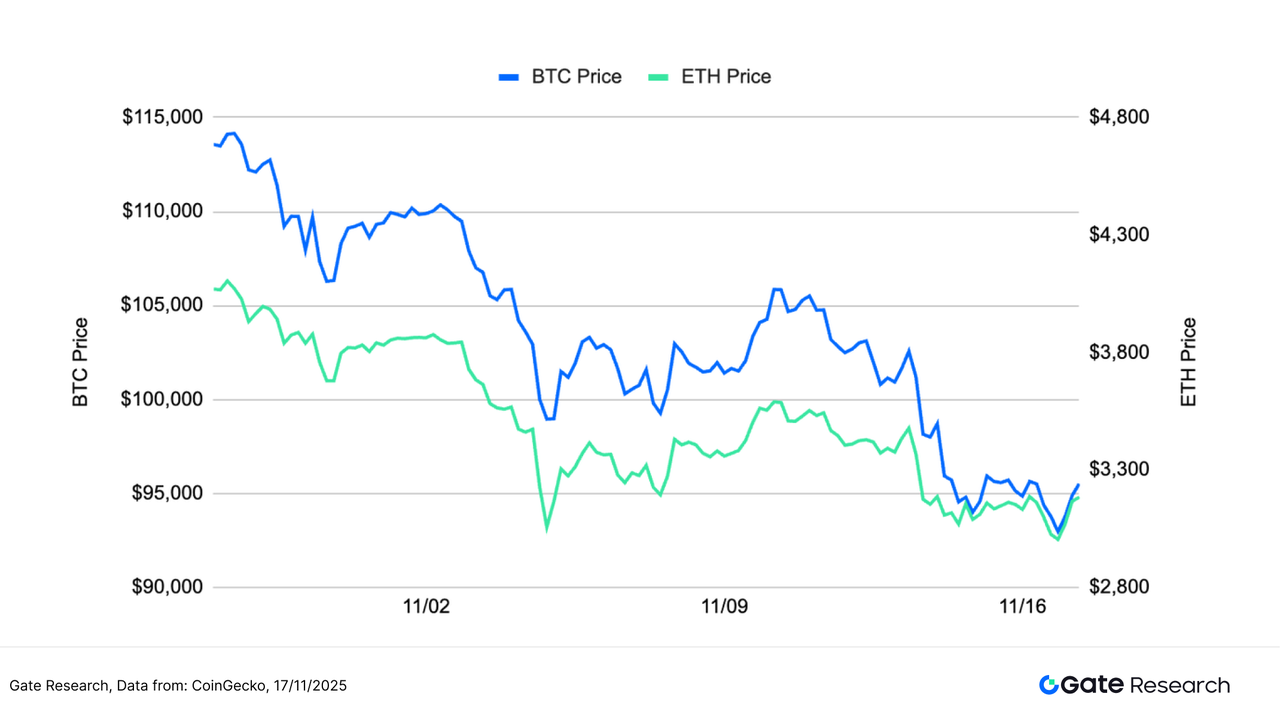
According to CoinGecko data, from November 4 to November 17, BTC and ETH maintained a weak oscillation pattern overall, with prices continuing to decline since October, and market sentiment leaning towards caution. After BTC fell from a high point above $125,000, it weakened further, attempting short-term rebounds several times but failing to break through previous highs, with the overall trend still downward; ETH's movement was roughly in sync with BTC, continuously declining from above $4,000, with rebound strength appearing even milder. During this period, BTC briefly fell below $95,000 and attempted to stabilize, but buying momentum was limited; ETH found temporary support around $3,000, but its rebound was significantly weaker than BTC. Overall, both have not escaped the downward structure, and short-term rebounds are mostly due to short covering, without forming a trend reversal signal.
Macroeconomic and on-chain factors intertwine to exacerbate downward pressure. Although the government ended its shutdown last week, liquidity has not returned, and the crypto market has instead come under pressure. The expectation for a rate cut in December dropped significantly from about 67% to 46%, with ETFs experiencing a net outflow of $3.6 billion for two consecutive weeks; long-term holders on-chain reduced their holdings by approximately 815,000 BTC over the past 30 days, marking the largest sell-off in nearly a year, further dragging down the market. High leverage liquidations amplify volatility, keeping market sentiment cautious. In the medium term, as deleveraging progresses, structural opportunities are gradually accumulating, which investors should pay attention to.
Overall, BTC and ETH remain in a weak consolidation phase following a mid-term decline. If BTC cannot effectively reclaim the $115,000 range, or if ETH fails to rise back above $3,800–$4,000 with increased volume, the short-term market is likely to maintain a weak oscillation tone.
Figure 1: BTC and ETH have continued to decline from their highs, with a weak rebound structure throughout the period, and the overall trend continues to oscillate downward.
The short-term volatility of BTC and ETH shows a high-frequency oscillation pattern, with several rapid spikes in price. The chart shows that BTC's volatility spiked significantly on several key trading days, even exceeding that of ETH, indicating a more intense emotional response from the market during the decline; ETH's volatility also remained active, but its peak amplitude was generally slightly lower than BTC's, reflecting that while short-term fluctuations were frequent, the strength was relatively mild.
Overall, market volatility remains in a volatile phase, with BTC's high amplitude spikes indicating intensified competition between bears and bulls at key price levels, while ETH's continuous volatility increase represents ongoing short-term capital inflows and outflows, with heightened sensitivity to sentiment. If the volatility of both continues to synchronize and increase along with trading volume, it may signal the market entering a new directional trend, and it is advisable to continue observing the linkage structure between volatility and trading volume.
Figure 2: BTC's volatility spikes multiple times, reflecting a strong emotional response; ETH's volatility remains active but with relatively mild peaks.

Recently, BTC and ETH's prices have continued to weaken, with volatility rapidly increasing during the downward process, indicating fragile sentiment and heightened market sensitivity to key price levels. If volatility continues to rise and resonates with trading volume, the short-term market may face a directional choice.
2. Analysis of Bitcoin and Ethereum Long/Short Trading Size Ratio (LSR)
The Long/Short Trading Size Ratio (LSR) measures the proportion of active long and short funding in the market. An LSR greater than 1 indicates a bullish market, dominated by long positions, while an LSR less than 1 indicates a bearish market. This indicator reflects the strength of trading sentiment and momentum changes.
According to Coinglass data, from November 4 to November 17, the LSR for BTC and ETH oscillated narrowly around 1, indicating that market sentiment continued to compete in a weak market, with funds not forming a consistent direction.
BTC's LSR repeatedly switched between the 0.9–1.0 range, with short-term buying and selling alternating in dominance, only briefly rising above 1 at a few points, reflecting that the momentum for chasing long positions remains weak, with the market primarily in a wait-and-see and rebound-testing mode. ETH's LSR exhibited relatively higher volatility, frequently dipping to around 0.9 before quickly rebounding to the 1.0–1.05 range, indicating that short-term capital inflows and outflows were more frequent, with a faster conversion speed between bullish and bearish sentiment, especially sensitive in the lower range.
Overall, both BTC and ETH's long/short ratios exhibit a range-bound oscillation pattern. Although sentiment has not fully strengthened, there are signs of a slight increase in the long/short ratio after mid-November, indicating a relief in bearish sentiment. If the LSR can stabilize above 1 and is accompanied by a rebound in trading volume, it may become a precursor signal for market stabilization or even a rebound.
Figure 3: BTC's LSR oscillates repeatedly in the 0.9–1.0 range, with momentum for chasing long positions still weak.
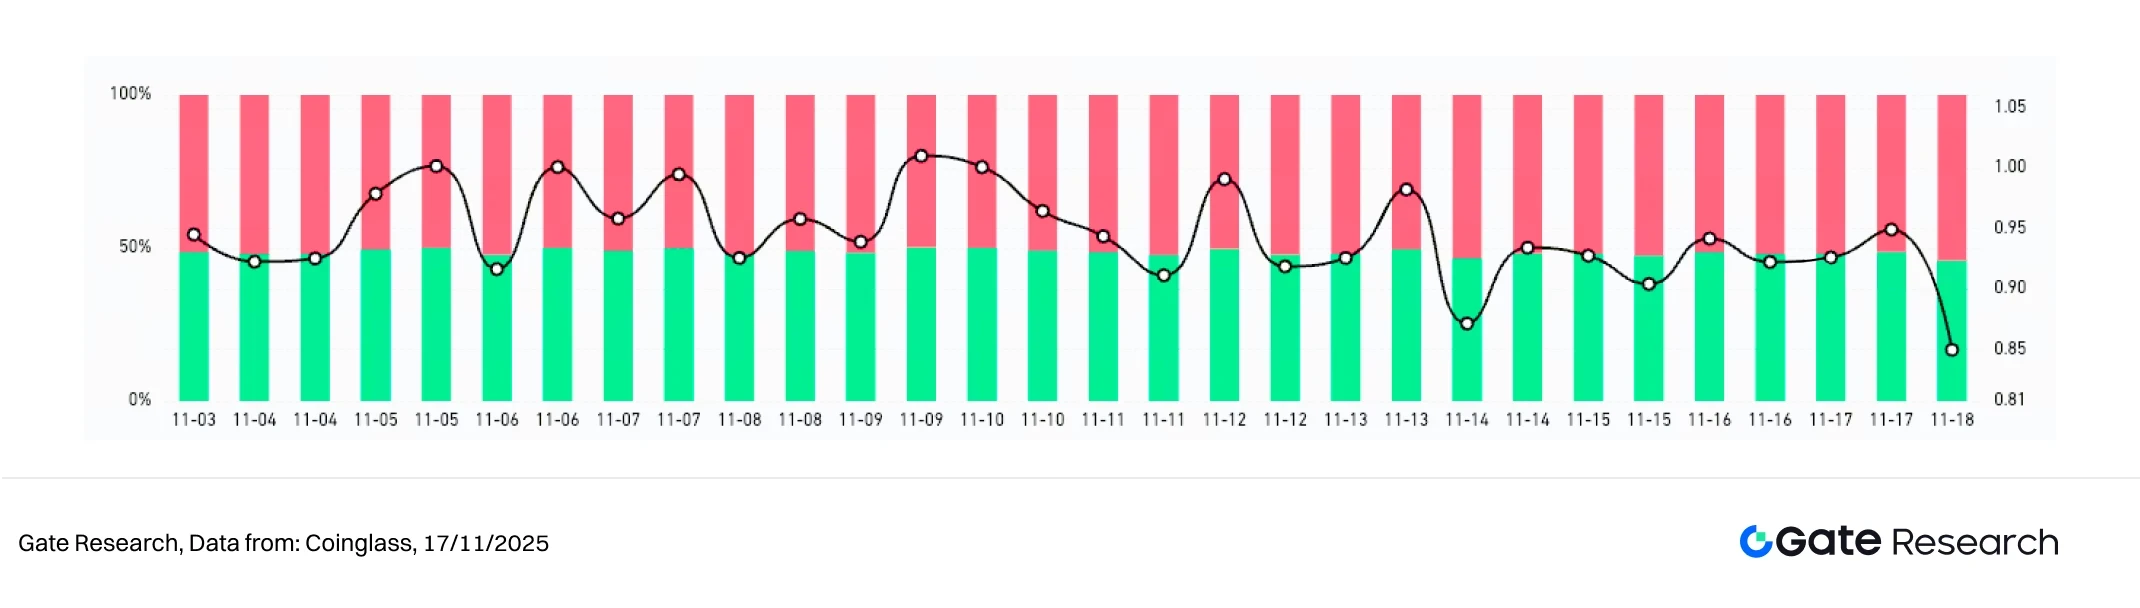
Figure 4: ETH's LSR shows more active fluctuations, with faster conversion of short-term capital sentiment.

3. Analysis of Contract Open Interest
According to Coinglass data, in the past two weeks, the contract open interest for BTC and ETH has continued to weaken, showing no significant recovery after a substantial deleveraging at the end of October, maintaining a low oscillation overall. The current open interest structure indicates that market leverage sentiment is conservative, with funds not re-entering on a large scale.
BTC's open interest has hovered in a relatively low range since rapidly declining from its early October high, showing no significant signs of increased positions, reflecting that bulls remain cautious in a weak market, with institutions and major funds exhibiting strong wait-and-see sentiment. ETH's open interest also shows a stepwise decline, with a noticeable gap in positions at the beginning of November, followed by slight fluctuations at low levels. Compared to BTC, ETH's position recovery has not been stronger, indicating that funds remain conservative regarding mid-term trends.
Overall, the current market leverage structure is still in a "wait-and-see phase after deleveraging," with limited capital inflows and a lack of trend-driving force. If prices stabilize and rebound with increased trading volume, it may lead to a renewed increase in open interest; conversely, if the market weakens again, the low position structure may exacerbate short-term volatility risks.
Figure 5: BTC's open interest has maintained low oscillation after a significant drop from its high, with weak capital entry willingness.
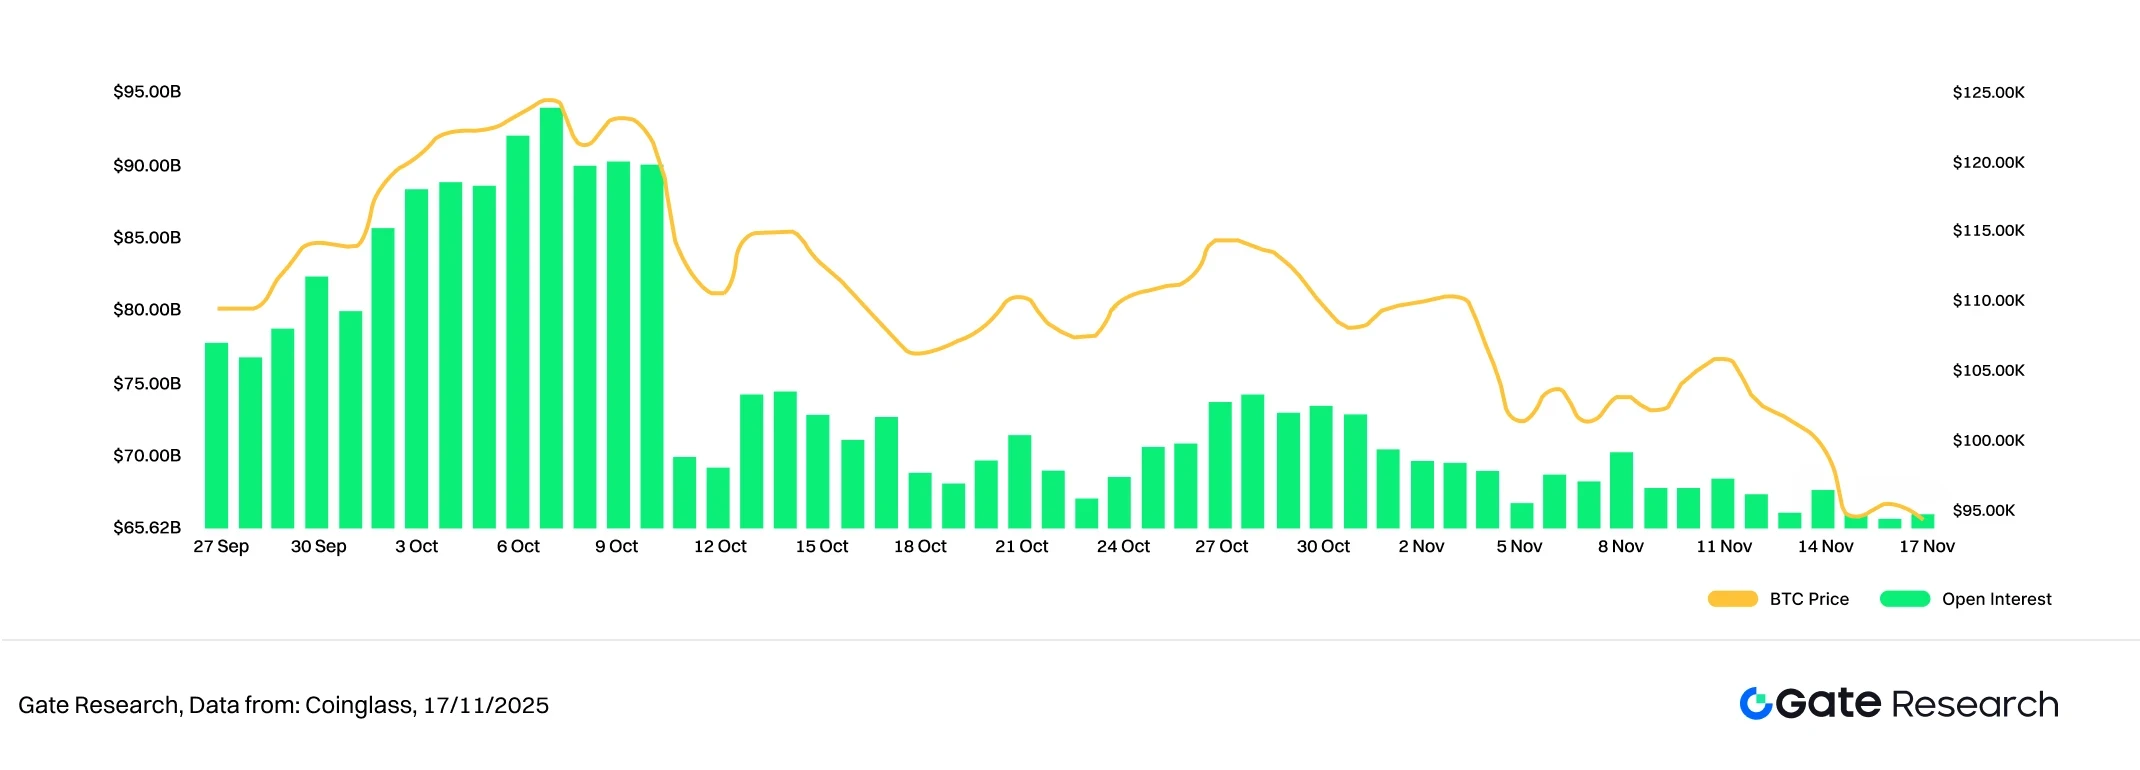
Figure 6: ETH's open interest continues to decline and enters a low range, with leveraged funds still in a wait-and-see state.

4. Funding Rates
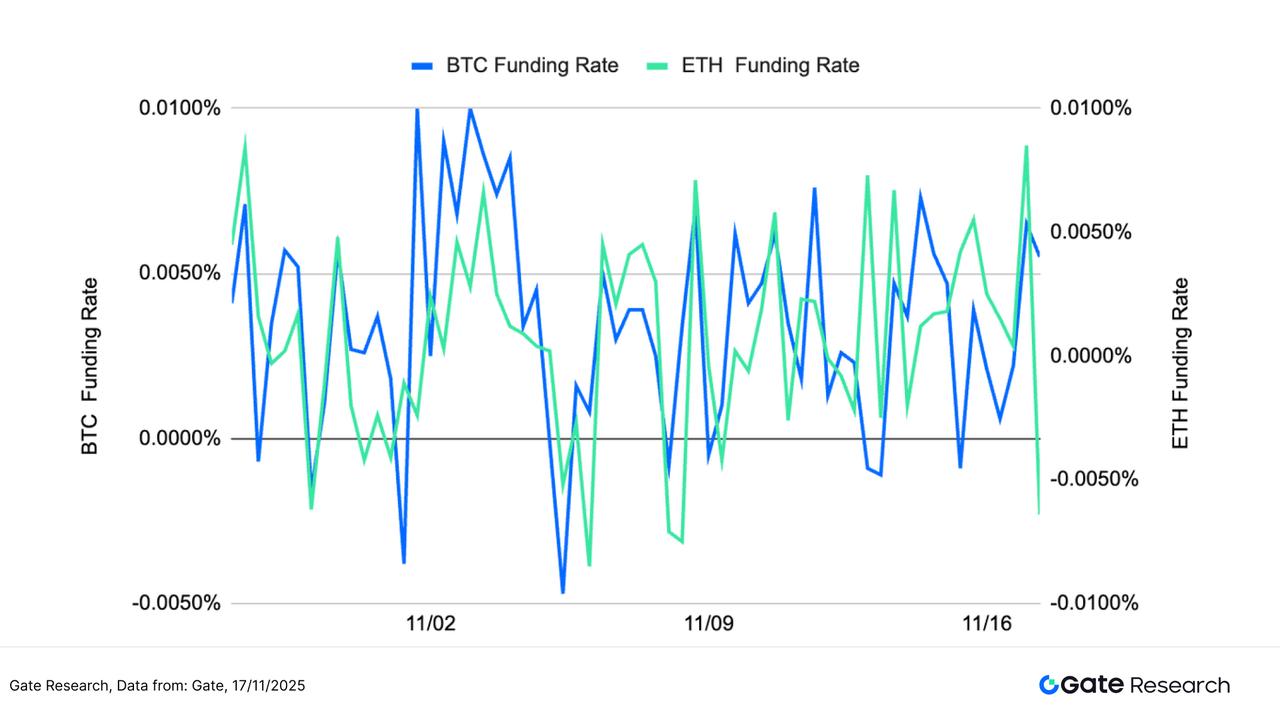
The funding rates for BTC and ETH both exhibit a high-frequency oscillation pattern, rapidly switching between positive and negative around 0, reflecting repeated bullish and bearish market sentiment and insufficient directional consensus. The chart shows that BTC's funding rate has significantly increased in volatility, frequently turning negative before quickly rebounding, indicating that leveraged funds are continuously adjusting their positions in a weak market, with short-term sentiment leaning towards caution.
ETH's funding rate also shows severe fluctuations, quickly turning negative during several pullback phases, then rapidly returning above 0, representing that short-term capital inflows and outflows are more sensitive and react faster to price changes. Overall, ETH's volatility is slightly higher than BTC's, with stronger short-term trading drivers.
In summary, the market's funding rates are in a "directionless, fast-paced" oscillation state, with open interest continuing to decline and entering a low range. If the funding rates can stabilize above the positive range and are accompanied by a rebound in trading volume, it may signal market stabilization or even a rebound; conversely, if negative values persist, caution should be exercised regarding the strengthening of bearish momentum and further price pressure.
Figure 7: BTC and ETH's funding rates oscillate around 0, with market sentiment repeatedly shifting between bullish and bearish, and direction unclear.
5. Cryptocurrency Contract Liquidation Chart
According to Coinglass data, in the past two weeks, the scale of long liquidations in the crypto market has significantly exceeded that of short liquidations, indicating that high-leverage long positions are under the most pressure as the market continues to weaken. On November 3 and 4, the largest liquidation wave of the month occurred, with daily long liquidations rapidly expanding to over $1–1.5 billion, reflecting that after breaking key support levels, long positions were passively liquidated.
In the following two trading weeks, although long liquidations have decreased from their peak, several hundred million dollars in liquidations still frequently occurred, indicating that chasing long funds continue to encounter stop-losses amid failed rebounds. Short liquidations, on the other hand, were generally smaller in scale, only occasionally expanding during brief price rebounds, but overall were not dominant.
Overall, the current liquidation structure shows characteristics of "weak longs, stable shorts," with downward leverage pressure still not fully released. If prices cannot stabilize or volatility continues to increase, the short-term market may face concentrated liquidation risks again; conversely, if liquidation scales continue to converge, it will help the market complete the deleveraging and emotional stabilization process.
Figure 8: In early November, long liquidations concentrated and expanded, with subsequent long liquidations still exceeding shorts, indicating that market downward pressure has not been fully released.

In the current context of weak oscillation and continuous price decline, the overall funding behavior in the crypto market leans towards caution, with a neutral to weak pattern becoming increasingly evident. In terms of price, BTC and ETH have been continuously declining with limited rebound strength, and the market has not formed a trend reversal; volatility has frequently spiked, indicating fragile sentiment and sensitivity to key price levels. The long/short trading size ratio continues to oscillate around 1, with funding direction swinging unpredictably; contract open interest has remained low after significant deleveraging at the end of October, indicating that leveraged funds have not re-entered the market; funding rates have also fluctuated violently around 0, switching between positive and negative multiple times, reflecting a lack of consensus in the market direction. Meanwhile, the liquidation structure is dominated by long liquidations, indicating that downward pressure has not been fully released.
Under the above structure, although market sentiment has not shown systemic deterioration, short-term support has significantly weakened, limiting the continuity of the market. Prices lack trend-driving force, leverage structure is weak, and sentiment is fluctuating, making the current phase closer to a "no trend, weak rebound" consolidation range. In this environment of diverging bullish and bearish sentiment and marginal convergence of leverage, trading key shifts focus on the precise identification of trends and volatility. The following content will focus on the empirical performance of the "Moving Average Trend Breakout Strategy" during weak oscillation and trend-switching phases, assessing its effectiveness in capturing structural breakouts, filtering out short-term noise, enhancing risk control efficiency, and reducing emotional chasing behavior, as well as its stability and applicability under different market rhythms.
Quantitative Analysis - Moving Average Trend Breakout Strategy
Disclaimer: All predictions in this article are based on historical data and market trends, and are for reference only. They should not be considered as investment advice or guarantees of future market trends. Investors should fully consider risks and make cautious decisions when engaging in related investments.
1. Strategy Overview
The Moving Average Trend Breakout Strategy is a medium to short-term trading strategy based on moving average crossovers and price volatility to determine trends. By combining Simple Moving Averages (SMA) and Exponential Moving Averages (EMA), it monitors changes in price direction and uses short-term moving averages crossing above or below long-term moving averages as buy and sell signals. Additionally, the strategy incorporates dynamic stop-loss and take-profit mechanisms to lock in profits or limit losses, making it suitable for application in oscillating markets with trends.
2. Core Parameter Settings
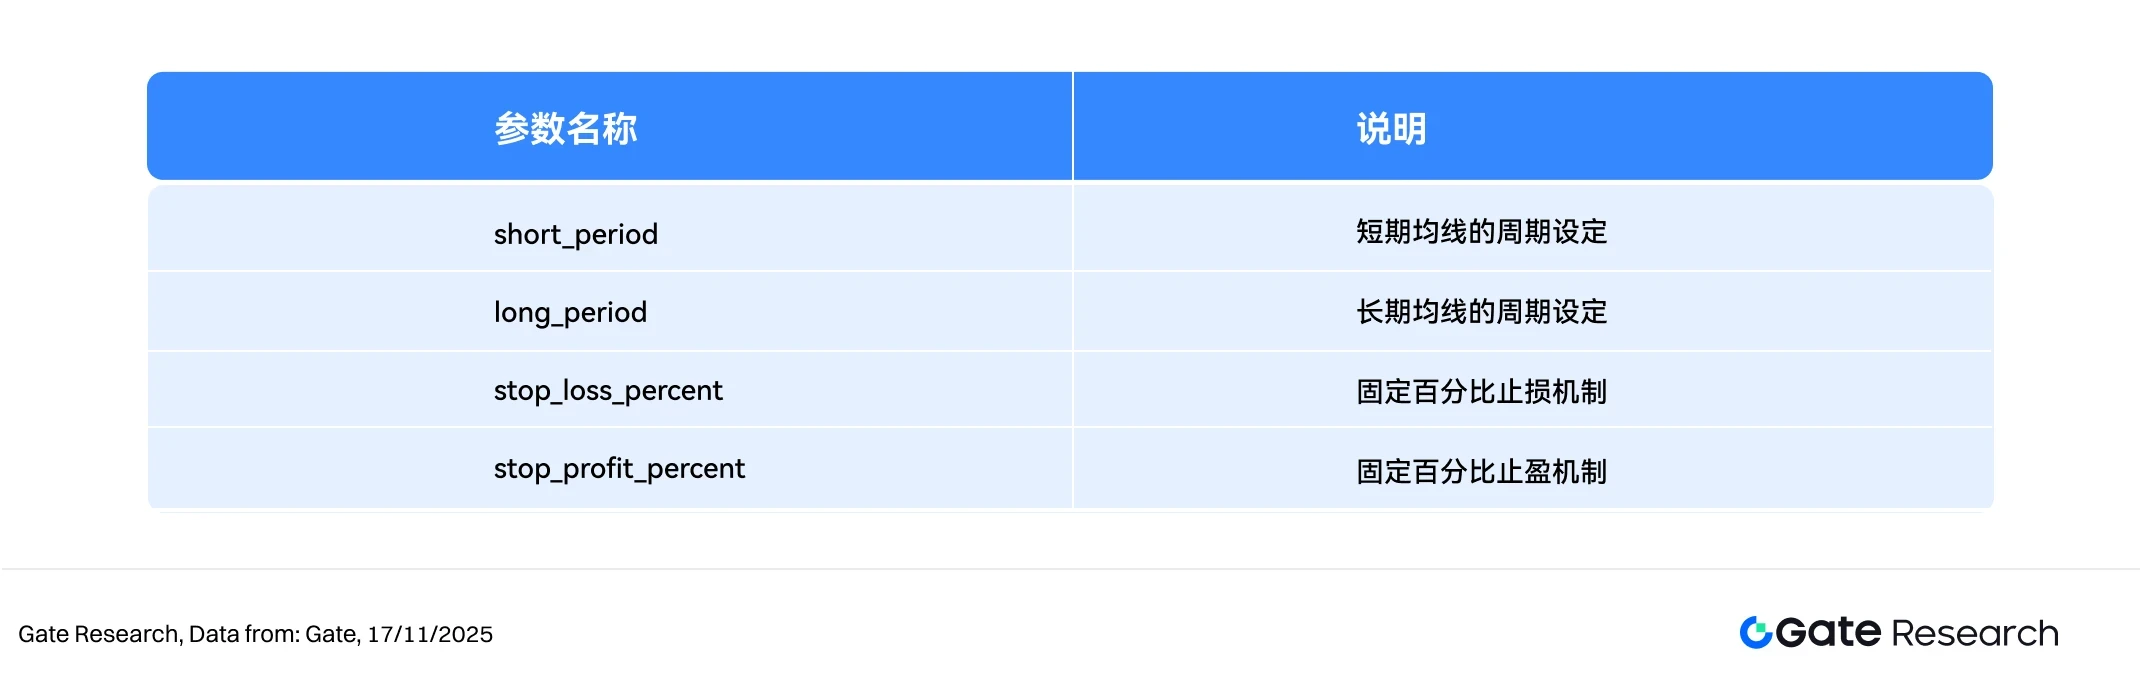
3. Strategy Logic and Operation Mechanism
- Entry Conditions
When there is no open position, a buy operation is triggered when the short-term moving average crosses above the long-term moving average.
- Exit Conditions:
Short-term moving average crosses below long-term moving average: When the short-term moving average falls below the long-term moving average, it is considered a weakening market, triggering a closing signal.
Stop-loss closing: If the price falls to the buy price * (1 - stoplosspercent), a forced stop-loss is triggered.
Take-profit closing: If the price rises to the buy price * (1 + takeprofitpercent), a take-profit closing is triggered.
- Practical Example Chart
Trading signal triggered
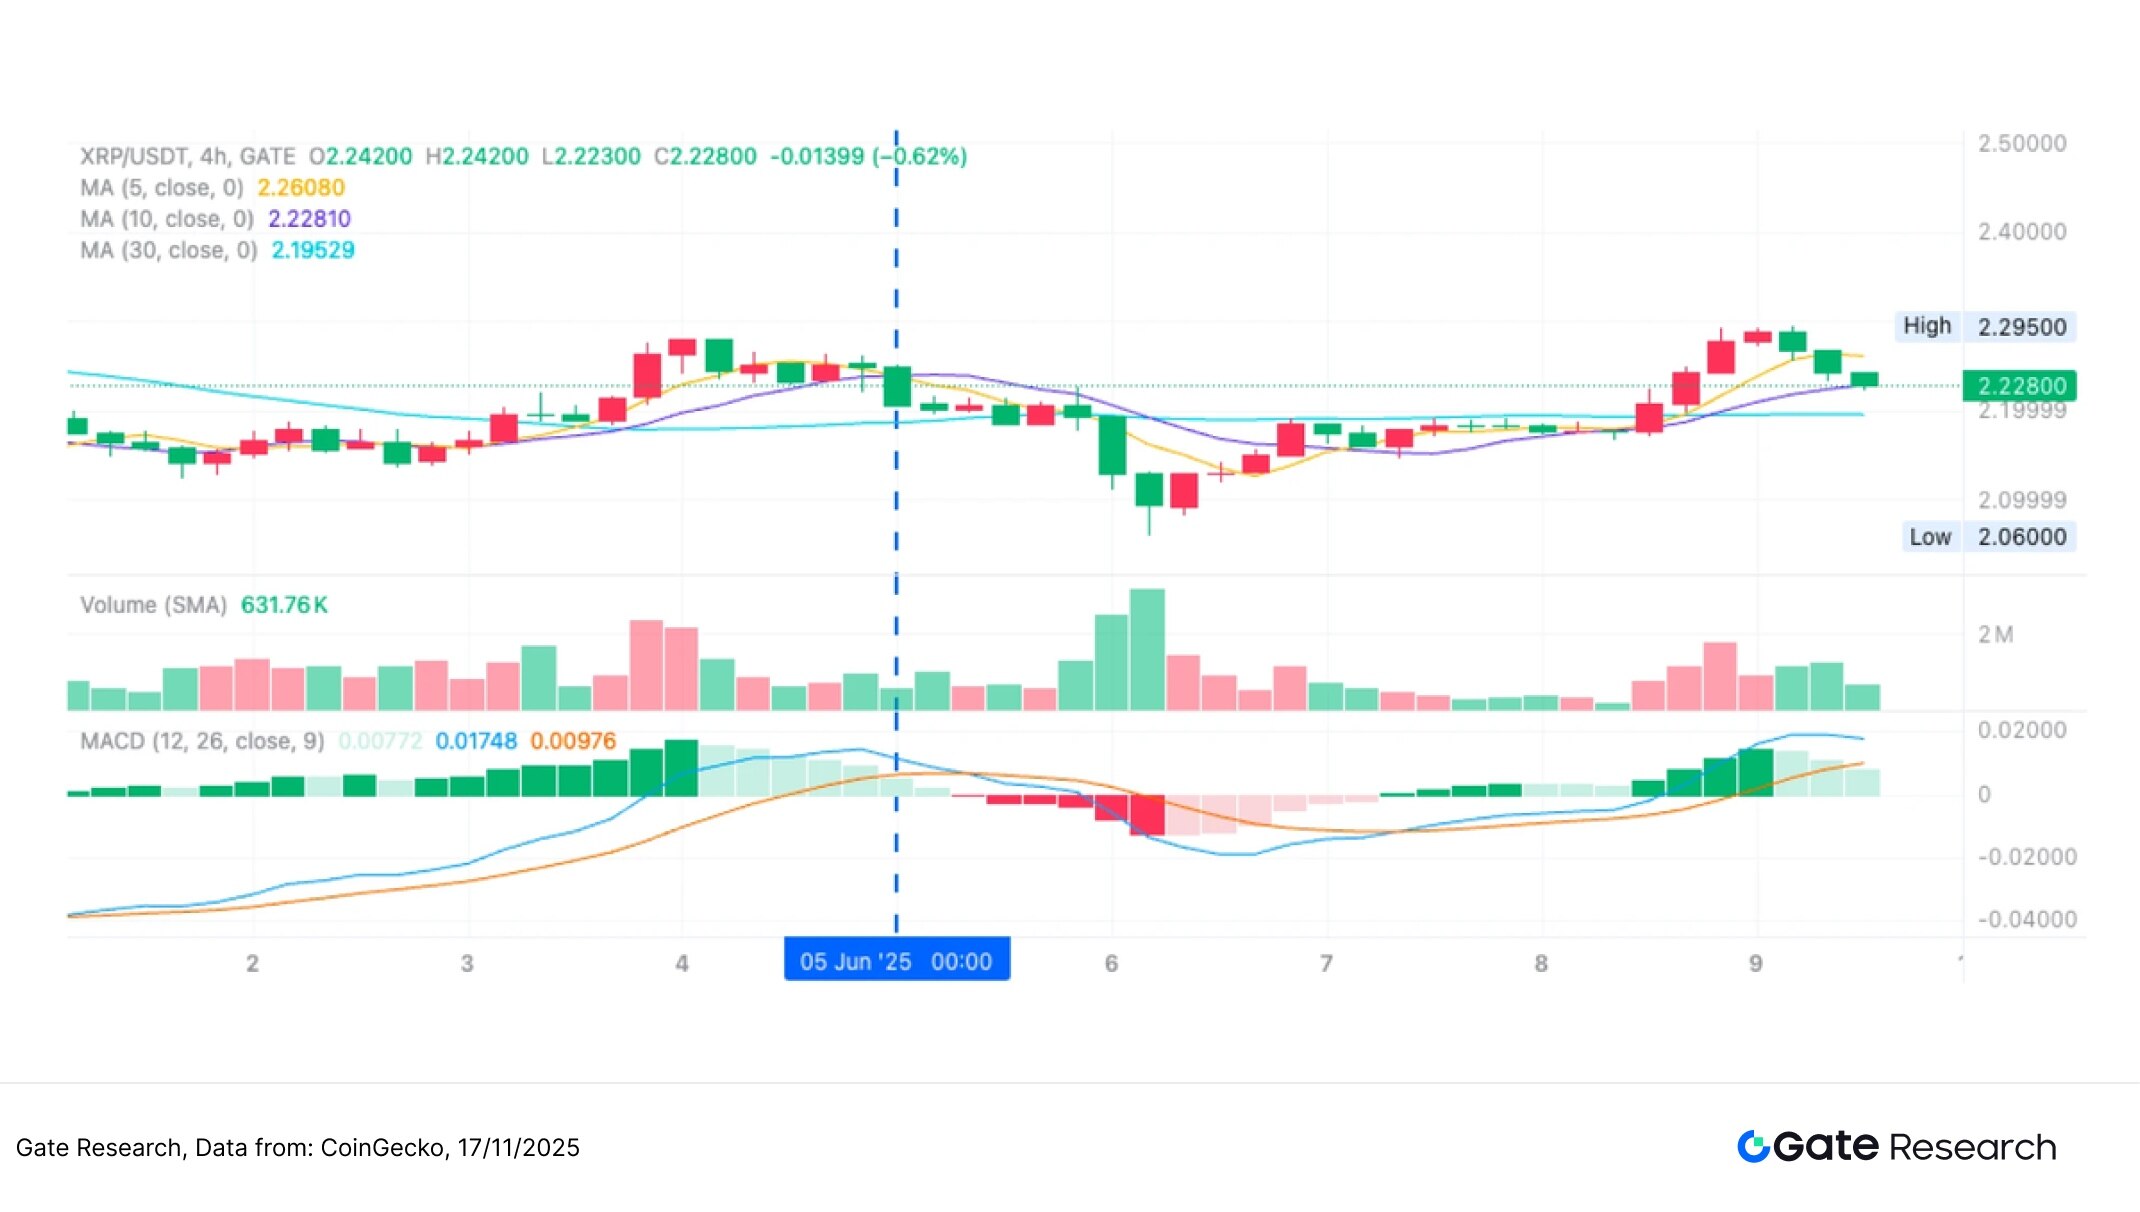
The following chart shows the XRP/USDT 4-hour candlestick chart when the strategy last triggered an entry on June 3, 2025. After a brief price pullback, a technical reversal signal appeared in the early hours of June 3: the short-term moving average MA5 began to cross above the medium-term moving average MA10, the MACD fast line and slow line formed a golden cross, and trading volume increased, indicating enhanced bullish momentum. The strategy triggered a buy at this position, successfully capturing a subsequent significant rebound, aligning with the logic of a trend-following bullish strategy.
Figure 9: Actual entry position when the strategy conditions were triggered for XRP/USDT (June 3, 2025)

Trading actions and results
After a continuous upward movement, XRP showed signs of short-term weakness, with a MACD death cross forming, and the short-term moving average began to press down. The strategy executed a sell operation at this position, successfully locking in profits from the previous rebound. Although the price subsequently only slightly retraced, this exit aligned with the risk control logic of the trend strategy, which states "exit when momentum weakens," demonstrating good discipline in swing trading. If dynamic take-profit or trend-following mechanisms can be combined in the future, it is expected to further enhance overall profit efficiency and profit margins.
Figure 10: Exit position for XRP/USDT strategy (June 5, 2025)
Through the above practical example, we visually demonstrate the entry and exit logic and dynamic risk control mechanism of the trend strategy during changes in price momentum. The strategy judges trend direction based on the crossover of short-term and long-term moving averages and chooses to enter when the short-term moving average crosses above, capturing upward momentum; when the short-term moving average crosses below or momentum indicators weaken, it exits in a timely manner, effectively avoiding retracement risks. While controlling profit and loss fluctuations, the strategy successfully locks in profits from major swings. This case not only validates the operability and disciplined execution of the trend strategy in actual market conditions but also reflects its good profit retention ability and defensiveness in a highly volatile market environment, providing a reliable empirical basis for subsequent parameter optimization and cross-asset applications.
4. Practical Application Example
- Parameter Backtesting Settings
To find the best parameter combinations, we conducted a systematic grid search over the following ranges:
•short_period: 2 to 10 (step size of 1)
•long_period: 10 to 20 (step size of 1)
•stoplosspercent: 1% to 2% (step size of 0.5%)
•takeprofitpercent: 10% to 16% (step size of 5%)
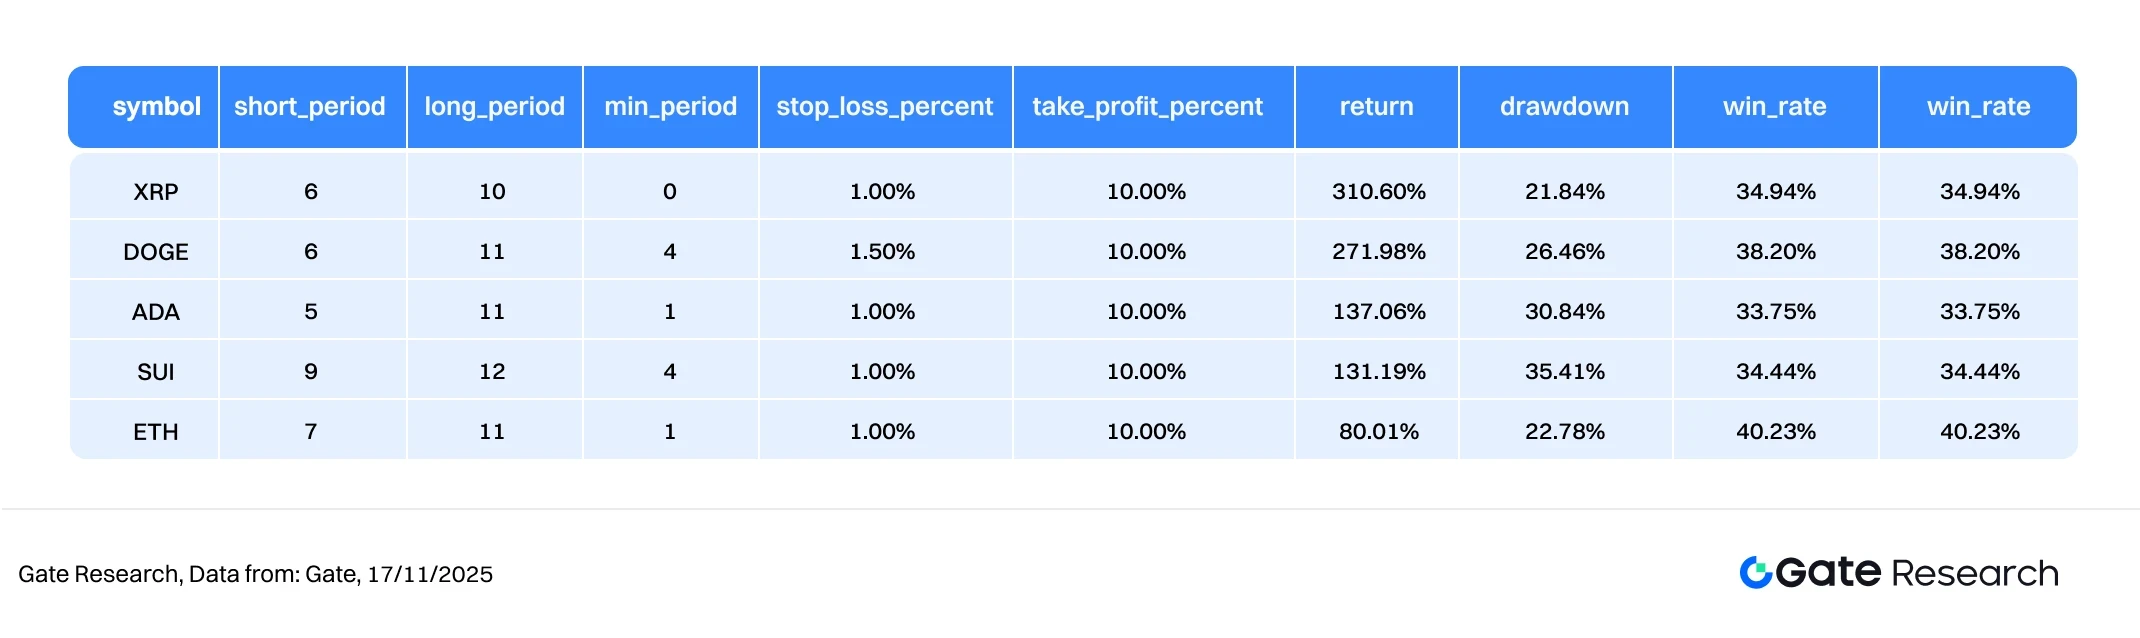
Taking the top ten projects by market capitalization in the crypto space (excluding stablecoins) as an example, this article backtested 2-hour candlestick data from October 2024 to October 2025, testing a total of 891 parameter combinations and selecting the ten with the best annualized return performance. Evaluation criteria included annualized return, Sharpe ratio, maximum drawdown, and ROMAD (return to maximum drawdown ratio) to comprehensively assess the strategy's stability and risk-adjusted performance in different market environments.
Figure 11: Performance comparison table of the five optimal strategies
- Strategy Logic Explanation
When the program detects that the short-term moving average crosses above the long-term moving average, it is considered a trend initiation signal, and the strategy will immediately trigger a buy operation. This structure aims to capture the initial strengthening phase of the market by identifying price trend direction through moving average crossovers and combining dynamic take-profit and stop-loss mechanisms for risk control. If the subsequent short-term moving average crosses below the long-term moving average, or if the price reaches the preset stop-loss or take-profit ratio, the system will automatically execute an exit operation to achieve robust profit locking and risk prevention.
Taking XRP as an example, the settings used in this strategy are as follows:
•short_period= 6 (short-term moving average period for tracking price changes)
•long_period= 10 (long-term moving average period for determining trend direction)
•stoplosspercent= 1%
•takeprofitpercent= 10%
This logic combines trend breakout signals with fixed proportion risk control rules, making it suitable for trading environments with clear market direction and distinct swing structures, effectively controlling retracement while following trends, enhancing trading stability and overall return quality.
- Performance and Result Analysis
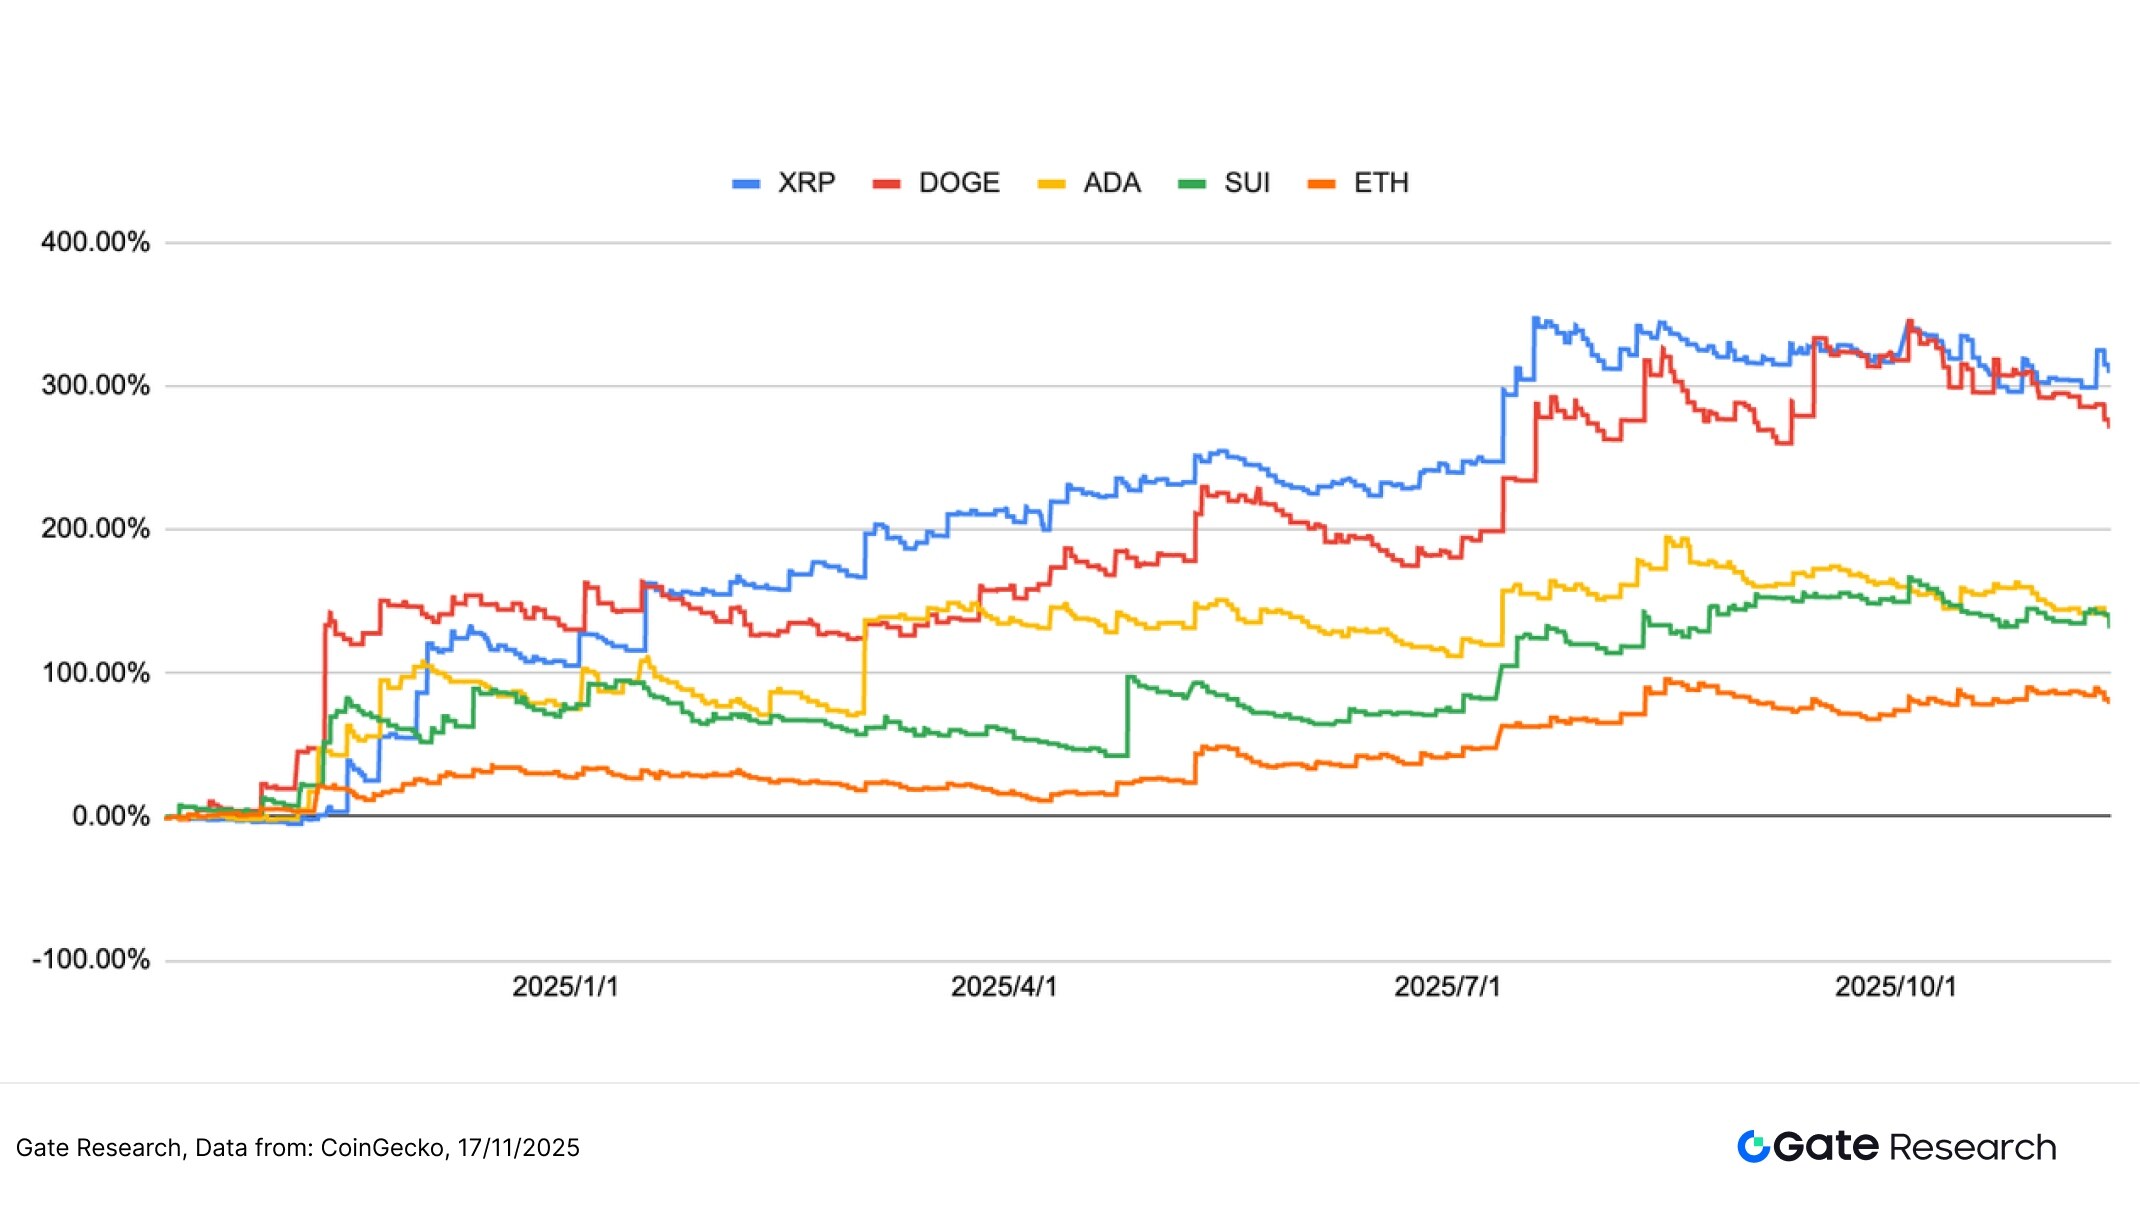
The backtesting period is from October 2024 to November 2025. Based on the cumulative return rate trend over the past year, the performance of the moving average trend breakout strategy shows significant differentiation across different mainstream and secondary mainstream assets, but overall maintains a robust upward structure. The return curves of the five assets in the chart mostly show a stepwise accumulation growth after the strategy triggers a bullish breakout signal, with XRP, DOGE, and ADA performing particularly well, with returns in the highest range exceeding 250%–330%, indicating the strategy's significant ability to capture upward movements in strong sectors.
In contrast, while SUI and ETH showed relatively moderate gains, they also maintained a steady upward trend overall, stabilizing and accumulating returns multiple times after market pullbacks, demonstrating that the moving average trend breakout strategy can maintain a certain trend-following ability across assets with different volatility characteristics. From the curve changes, it can be observed that most assets experience a period of accelerated upward movement after breaking through key moving average arrangements, and through the dynamic stop-loss mechanism, the strategy can effectively protect some of the realized profits during increased volatility, resulting in an overall smooth upward trajectory of returns.
Overall, the strategy's performance from the end of 2024 to 2025 demonstrates good trend capture ability and risk control levels: strong assets can amplify trend returns, while more volatile assets can maintain moderate accumulation, making the overall strategy portfolio less susceptible to significant drawdowns due to the volatility of a single asset. This characteristic also complements neutral hedging quantitative strategies (such as Gate Quant Fund), which focus on stable, low-volatility returns, while the moving average trend breakout strategy is more suitable for enhancing excess return sources during phases of intensified trends or structural rotations.
5. Trading Strategy Summary
The moving average trend breakout strategy uses the arrangement changes of short and medium-term moving averages as the basis for trend judgment, and combines dynamic stop-loss and take-profit mechanisms, demonstrating robust and diffusive return performance across various mainstream crypto assets. From the performance results over the past year, it can be seen that XRP, DOGE, and ADA exhibited significant stepwise cumulative returns after trend breakouts, with the highest gains exceeding 250%–330%, indicating the strategy's good trend capture ability; while SUI and ETH, despite more moderate gains, also maintained a steady upward trend overall, reflecting the strategy's ability to maintain stable cumulative returns across assets with different volatility characteristics.
Backtesting results show that the moving average breakout strategy performs particularly well in markets with clear trend structures and significant capital rotations, able to preserve returns during multiple market pullbacks, resulting in an overall smooth upward return curve. However, in strong one-sided markets, due to the strategy's reliance on moving average confirmations, there may be instances of slightly delayed entries or partial gains not being fully captured, leading to overall performance being somewhat lagging compared to stronger beta assets.
Based on long-term robustness considerations of risk and return, true quantitative asset allocation not only requires sources of excess returns from trend strategies but must also combine lower volatility and a greater emphasis on risk control in asset management. For example, the Gate Quant Fund focuses on neutral arbitrage and hedging strategies to enhance portfolio stability across various market cycles, pursuing long-term compounding while controlling drawdowns through a strict risk control system. Compared to the higher volatility and quicker rebalancing frequency of trend strategies, neutral strategies provide a smoother return structure, making them more suitable as a robust underlying allocation for investment portfolios.
Summary
From November 4 to November 17, 2025, the crypto market continued its weak oscillation pattern, with funding and sentiment weakening in tandem. BTC and ETH prices continued to decline with limited rebounds, and volatility spiked multiple times, indicating that the market is sensitive and fragile to key price levels. The long/short ratio oscillated around 1, and funding rates rapidly fluctuated around 0, showing weak bullish sentiment and a lack of consistent direction in short-term sentiment.
In terms of contract structure, the open interest for BTC and ETH has remained low after significant deleveraging at the end of October, with no noticeable increase in funding; the overall leverage ecosystem is in a "wait-and-see" state post-deleveraging. The liquidation structure is primarily composed of long liquidations, with limited short liquidations, reflecting that downward pressure has not been fully released. Overall, the market is in the later stages of weak consolidation, with structural chip cleaning and alternating sentiment. Without a return of funds or a simultaneous increase in volatility and trading volume, there is still a need to be cautious about the market continuing to decline or forming a new round of liquidation pressure in the short term.
In the current market environment, the moving average trend breakout strategy has shown good real-world potential. Backtesting shows that strong assets like XRP, DOGE, and ADA significantly amplified returns after breaking trends, with cumulative gains exceeding 250%–330%; while ETH and SUI remained relatively stable, they also maintained a smooth upward trend, reflecting the strategy's ability to consistently capture trends across assets with different volatility levels. The strategy may not fully capture gains in strong one-sided markets due to signal delays or stop-losses during pullbacks; in the future, combining volatility filters, slope factors, and volume indicators could further enhance entry precision and cycle adaptability.
In contrast, the Gate Quant Fund focuses on neutral arbitrage and hedging strategies, achieving low drawdowns and stable compounding through diversified allocation and strict risk control, providing a more balanced quantitative option for investors seeking stable returns, and forming a good complement to trend-based strategies.
References:
CoinGecko, https://www.coingecko.com/
Gate, https://www.gate.com/trade/BTC_USDT
Gate, https://www.gate.com/trade/ETH_USDT
Sosovalue, https://sosovalue.com/assets/etf/us-btc-spot?from=moved
Coinglass, https://www.coinglass.com/LongShortRatio
Coinglass, https://www.coinglass.com/BitcoinOpenInterest?utm_source=chatgpt.com
Gate, https://www.gate.com/futuresmarketinfo/BTCUSD/capitalrate_history
Gate, https://www.gate.com/futures/introduction/funding-rate-history?from=USDT-M&contract=ETH_USDT
Coinglass, https://www.coinglass.com/pro/futures/Liquidations
Gate, https://www.gate.com/institution/quant-fund
Gate Research Institute is a comprehensive blockchain and cryptocurrency research platform that provides readers with in-depth content, including technical analysis, hot insights, market reviews, industry research, trend forecasts, and macroeconomic policy analysis.
Disclaimer
Investing in the cryptocurrency market involves high risks. Users are advised to conduct independent research and fully understand the nature of the assets and products they purchase before making any investment decisions. Gate is not responsible for any losses or damages resulting from such investment decisions.
免责声明:本文章仅代表作者个人观点,不代表本平台的立场和观点。本文章仅供信息分享,不构成对任何人的任何投资建议。用户与作者之间的任何争议,与本平台无关。如网页中刊载的文章或图片涉及侵权,请提供相关的权利证明和身份证明发送邮件到support@aicoin.com,本平台相关工作人员将会进行核查。


