Author: Galaxy
Compiled by: Felix, PANews (This article has been edited)
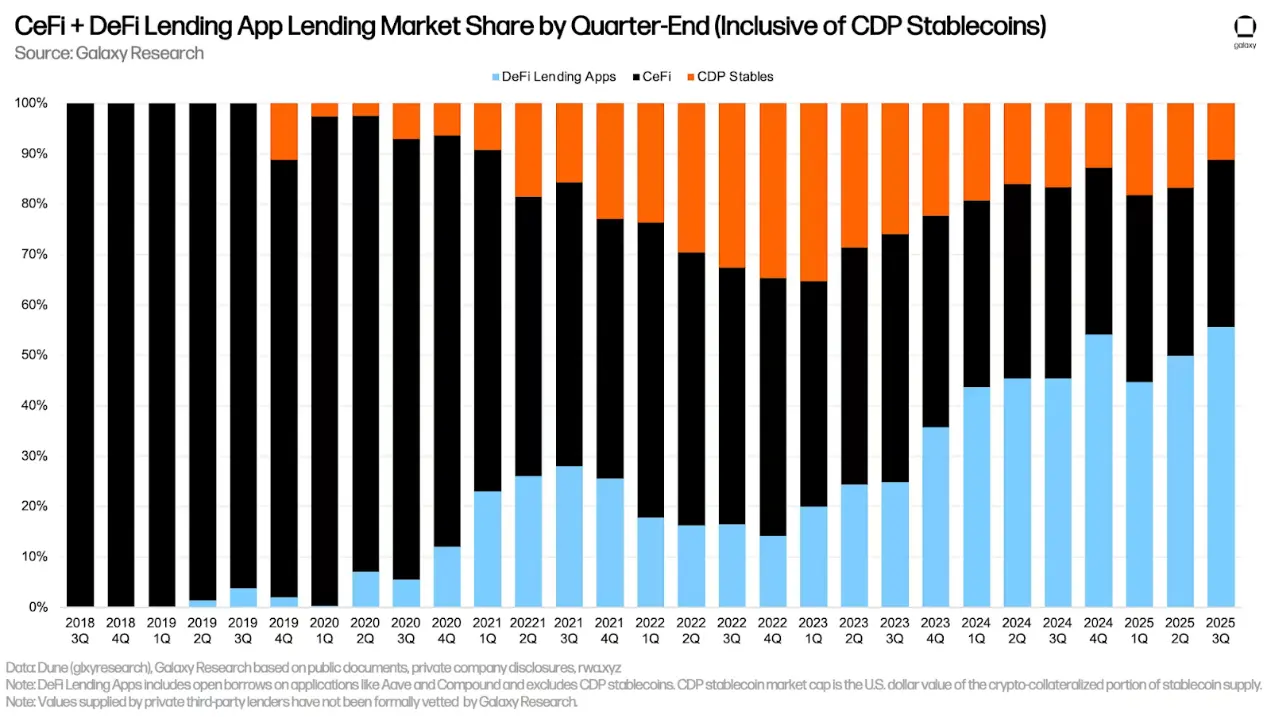
Cryptocurrency collateralized lending reached an all-time high at the end of the third quarter, largely driven by the growth of on-chain lending. Although the long-term peak set in the fourth quarter of 2021 has finally been surpassed nearly four years later, the current market is vastly different. First, the share of on-chain lending in the total lending market has significantly increased; at the end of the fourth quarter of 2021, on-chain lending through lending applications like Aave and collateralized debt position (CDP) stablecoins like DAI accounted for 48.6% of the market. Today, this proportion has risen to 66.9%. In the on-chain lending space, the balance between lending applications and CDP stablecoins has also changed significantly. As of the end of the third quarter of 2025, lending applications accounted for over 80% of the on-chain market, while CDPs accounted for only 16%, down from 53% in the fourth quarter of 2021. This indicates a market shift from synthetic crypto-asset-backed stablecoins to lending with centralized stablecoins like USDT and USDC.
In the centralized lending space, a starkly different situation has emerged compared to the last cycle. As CeFi lending institutions choose to self-regulate, no (or low) collateral lending has become extremely rare. After the credit crisis of 2022, the surviving companies realized that opaque and relationship-based lending had become a reputational and business burden. Today, many companies are seeking to go public or obtain funding from more institutional channels, forcing them to strengthen internal risk controls and adopt fully collateralized standards. Industry sentiment has also shifted, with unsecured lending no longer favored. The result is a contraction in the CeFi credit space, becoming more conservative, with transparency and collateral quality becoming core elements of credibility.
On the surface, the new lending peak should not cause panic; there is no threshold of outstanding loans indicating danger. The key lies in the quality of collateral and the use of borrowed funds. In both aspects, the current cycle is vastly different from that of 2021. The previous peak was characterized by unsecured lending, chasing speculative returns in short-term agreements, and more volatile collateral assets. Today, collateralized lending has become standard practice, with greater visibility in the system (increased share of on-chain loans, and public companies disclosing their accounts), and collateral is more concentrated in BTC and ETH (both of which have lower volatility than in previous cycles) as well as stable and yield-generating assets.
However, shortly after the end of the third quarter, the futures market experienced the largest liquidation event in history. On October 10 (Beijing time October 11), over $19 billion worth of perpetual contract positions were liquidated, with billions more closed due to automatic deleveraging (ADL). Although this event cleared a significant amount of outstanding contracts, it does not necessarily indicate systemic over-leveraging, unlike cryptocurrency collateralized lending. Prices fell so rapidly that even moderately leveraged positions were forcibly liquidated, and many healthy accounts were caught in chain liquidations and ADL due to exchange-level risk controls. The perpetual contract market was liquidated, primarily due to design mechanisms and significant price drops, rather than widespread lending excess.
Key Points
- Overall, cryptocurrency collateralized loans increased by $20.46 billion (+38.5%) in the third quarter of 2025, reaching a new high of $73.59 billion. This is $4.22 billion (6.09%) higher than the historical peak of $69.37 billion set at the end of the fourth quarter of 2021.
- The total dollar value of outstanding loans in DeFi reached a new historical high at the end of the quarter, growing by $14.52 billion (54.84%) to $40.99 billion.
- Galaxy Research tracked over $12 billion in outstanding debt used for direct purchases or funding strategies for DAT. For most of this year, outstanding debt has remained stagnant, with only a $422 million increase in the third quarter.
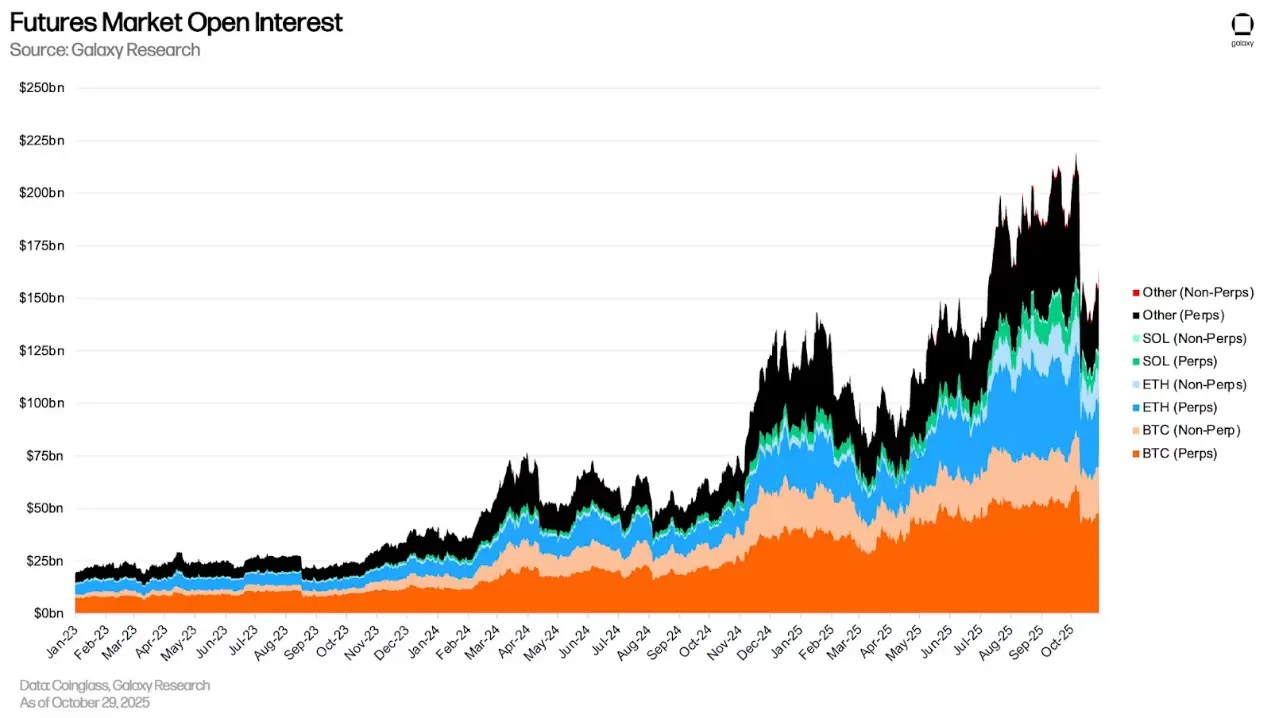
- As of September 30, outstanding futures contracts (OI), including perpetual futures, grew by 41.46% from the previous quarter, rising from $132.75 billion to $187.79 billion, and subsequently reached a historical high of $220.37 billion on October 6. The liquidation of perpetual futures on October 10 caused outstanding contracts to drop by 30% overnight, from $207.62 billion on October 9 to $146.06 billion at the end of October 10.
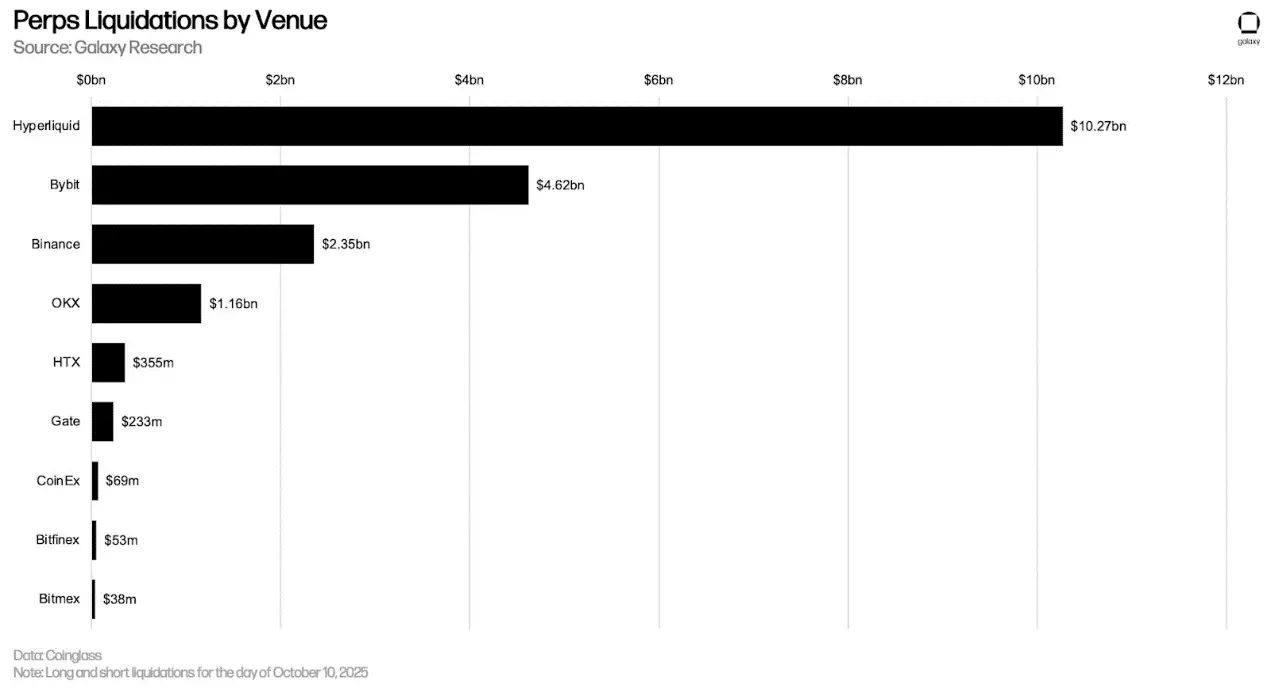
- The liquidation wave on October 10 was the largest single-day futures liquidation event in history, with long and short liquidations exceeding $17 billion. Hyperliquid alone accounted for $10.08 billion in liquidations within 24 hours, followed by Bybit and Binance, which reported liquidations of $4.58 billion and $2.31 billion, respectively.
Cryptocurrency Collateralized Lending
The following chart shows some of the major past and current participants in the CeFi and DeFi cryptocurrency lending markets. With the sharp decline in cryptocurrency asset prices and liquidity exhaustion, some of the largest CeFi lending institutions went bankrupt in 2022 and 2023. These institutions are marked with red warning dots in the chart below. Since Galaxy's last crypto leverage report, a new DeFi application has been added, along with six instances of previously covered DeFi applications. The newly added DeFi application is:
- JupLend (Solana platform)
Existing applications that have expanded their chain coverage include:
- Aave (Plasma platform)
- Fluid (Plasma platform)
- Dolomite (Botanix platform)
- Euler (Linea, Plasma, and Arbitrum platforms)

CeFi
The following table compares CeFi cryptocurrency lending companies in market analysis. Some of these companies offer various services to investors. For example, Coinbase primarily operates as an exchange but also provides credit to investors through over-the-counter cryptocurrency loans and margin financing. However, this analysis only shows the scale of its cryptocurrency collateralized lending business.

As of September 30, Galaxy Research tracked $24.37 billion in outstanding loans in CeFi. This represents a 37.11% increase from the previous quarter, or $6.6 billion, and a growth of $17.19 billion (+239.4%) since the low of $7.18 billion in the bear market of the fourth quarter of 2023. However, outstanding CeFi loans are still 34.3% lower than the historical peak of $37.08 billion in the first quarter of 2022.
In the third quarter, several CeFi lending institutions achieved record growth and loan volumes:
- Based on its self-reported data, TwoPrime's loan volume increased by $394 million.
- According to its self-reported data, Arch's loan volume increased by $49.29 million.
- Based on publicly disclosed financial data, Galaxy's loan volume increased by $693 million.
- According to on-chain data, Maple's loan volume increased by $629.9 million.
- According to its certified report, Tether added a secured loan balance of $4.47 billion.
The top three lending institutions ranked by outstanding loan value tracked by Galaxy Research are Tether, Nexo, and Galaxy. As of September 30, Tether's outstanding loans were $14.6 billion, Nexo's were $2.04 billion, and Galaxy's were $1.8 billion.
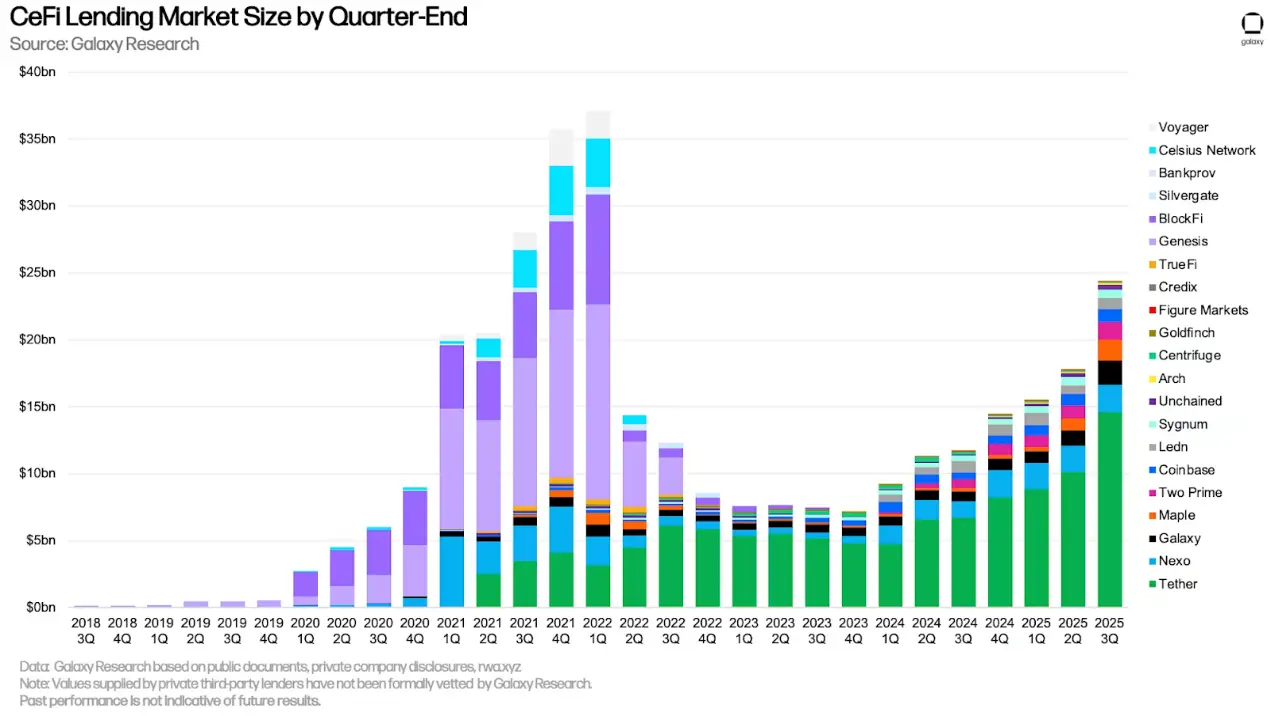
Tether is the dominant lender, holding a 59.91% market share (up 289 basis points from the previous quarter). Together with Nexo (market share 8.36%, down 265 basis points from the previous quarter) and Galaxy (market share 7.38%, up 115 basis points from the previous quarter), the top three centralized finance lenders control 75.66% of the market (up 140 basis points from the previous quarter).
When comparing market shares, it is important to note the differences between CeFi lending institutions. Some lenders only offer certain types of loans (e.g., only Bitcoin collateralized loans, altcoin collateral products, and cash loans excluding stablecoins), serve only certain types of clients (e.g., institutional clients versus retail), and operate only in certain jurisdictions. This combination of factors makes it easier for some lenders to scale than others.

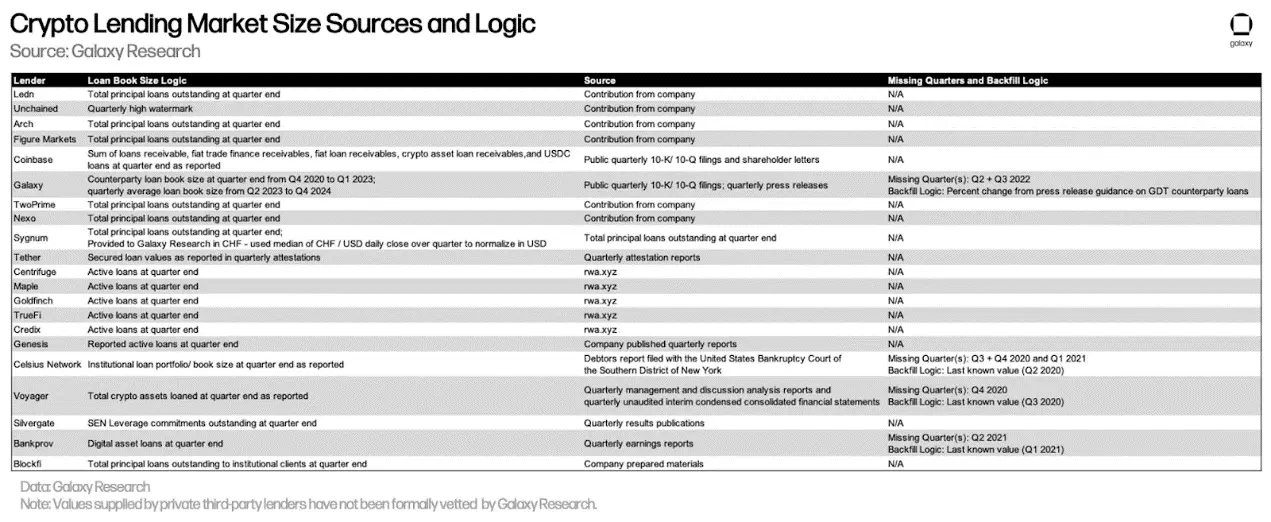
The following table details the data sources used by Galaxy Research for each CeFi lending institution and the logic used to calculate their loan volumes. While DeFi and on-chain CeFi lending data can be obtained from on-chain data, which is transparent and easily accessible, obtaining CeFi data is quite challenging. This is due to the differences in how CeFi lending institutions record outstanding loans and the frequency of information disclosure, as well as the difficulty in obtaining such information itself.
CeFi and DeFi Lending
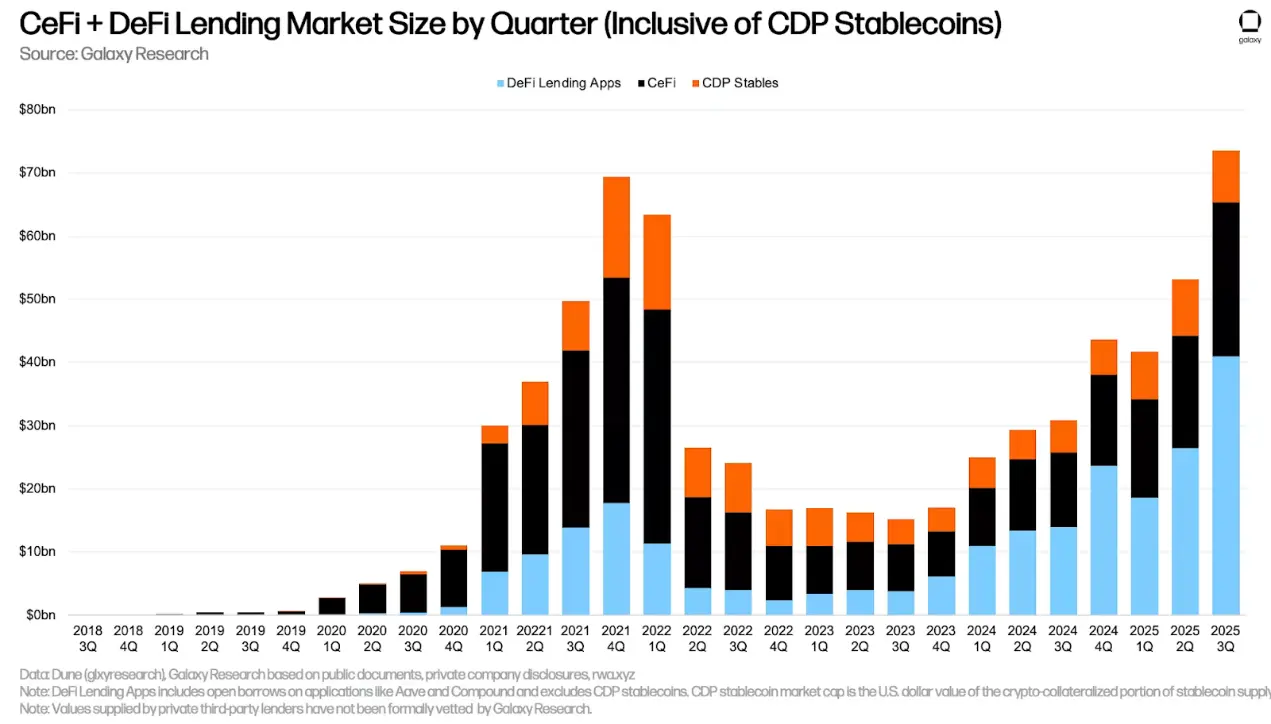
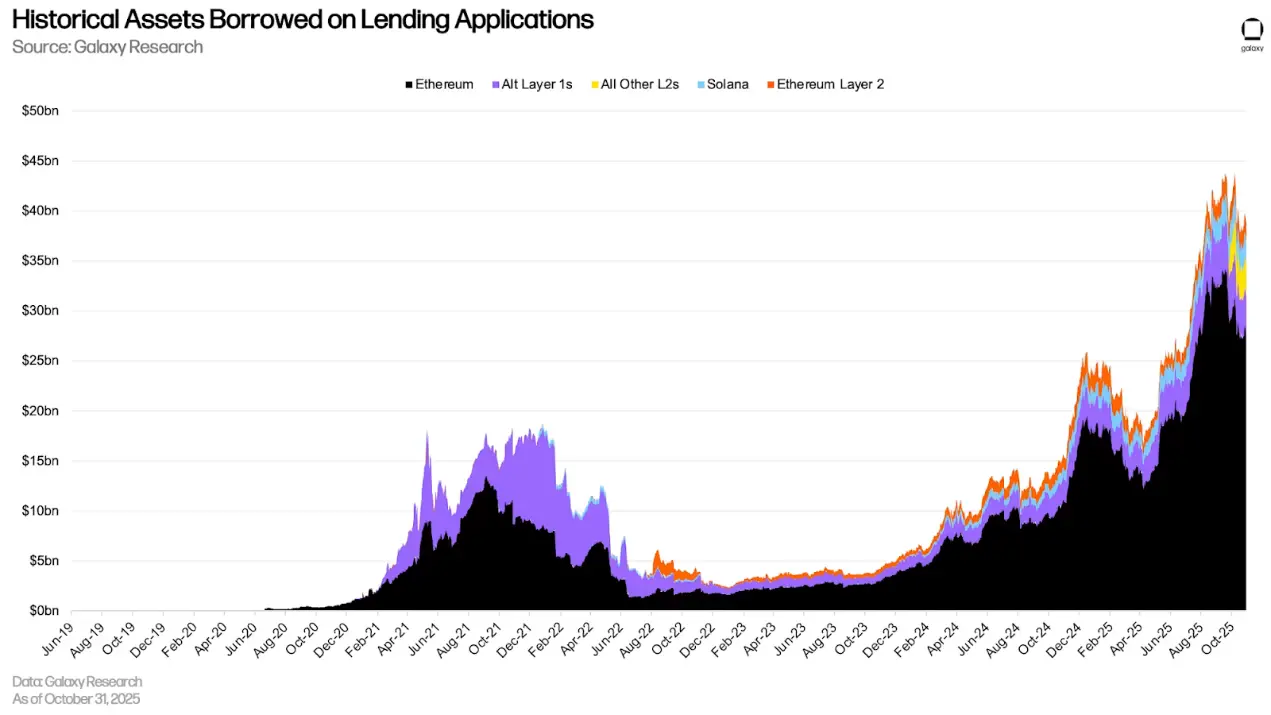
The dollar value of outstanding loans in DeFi applications reached a new historical high at the end of the third quarter, increasing by $14.52 billion (54.84%) to $40.99 billion. When combining DeFi applications with CeFi lending venues, the outstanding balance of cryptocurrency collateralized loans was $65.37 billion at the end of the quarter. This represents an increase of $21.12 billion (47.72%) from the previous quarter, primarily due to the growth of outstanding loans in DeFi lending applications. Overall, the outstanding balance of DeFi lending applications and CeFi loans reached a new historical peak, exceeding the historical high of $53.44 billion in the fourth quarter of 2021 by $11.93 billion (22.32%).
The continued growth of DeFi lending is driven by several factors:
- Incentive Mining: Airdrop mining and incentive programs encourage users to maintain borrowing even under market conditions or loan yield pressures. Such programs are offered across numerous applications and blockchains.
- Improved Collateral Assets: Collateral assets like Pendle PT allow users to cycle stablecoin strategies with favorable loan-to-value (LTV) ratios, leveraging efficient collateral assets that match the growth of stablecoins.
- Price Increases: Lending activity is closely related to asset prices; when prices rise, users can borrow more funds against the same collateral. BTC saw a slight increase in the third quarter, while ETH rose by about 50%, reaching a historical high not seen since November 2021, and SOL also increased by about 33%.

Due to the quarter-on-quarter growth of outstanding loans in DeFi lending applications, their advantage over CeFi lending venues rebounded to a historical high. As of the end of the third quarter of 2025, the dominance of DeFi lending applications relative to CeFi lending venues reached 62.71%, up from 59.83% at the end of the second quarter of 2025, and an increase of 72 basis points from the peak of 61.99% in the fourth quarter of 2024.

The supply of collateralized debt position (CDP) stablecoins decreased by $658 million (a quarter-on-quarter decline of 7.4%). Similarly, since some CeFi entities may rely on collateralizing cryptocurrencies to mint CDP stablecoins for off-chain clients, there may be instances of double counting between the total amount of CeFi loans and the supply of CDP stablecoins.
Overall, cryptocurrency collateralized loans increased by $20.46 billion (38.5%) in the third quarter, reaching a historical high of $73.59 billion. This is $4.22 billion (6.09%) higher than the historical record of $69.37 billion set at the end of the fourth quarter of 2021.
As of the end of the third quarter of 2025, DeFi lending applications accounted for 55.7% of the cryptocurrency collateralized lending market (an increase of 588 basis points from the second quarter of 2025), while CeFi platforms held 33.12% (a decrease of 36 basis points from the second quarter of 2025), and the cryptocurrency portion used for collateralized debt positions (CDP) stablecoin supply accounted for 11.18% (a decrease of 547 basis points from the second quarter of 2025). When combining DeFi lending applications and CDP stablecoins, the market share in on-chain lending venues is 66.88% (an increase of 33 basis points from the second quarter of 2025), rising by 2 basis points from the historical high of 66.86% at the end of the fourth quarter of 2024.
Other Perspectives on DeFi Lending
Despite market volatility, outstanding loans in DeFi lending applications remain robust. After reaching a historical daily high of $43.82 billion in outstanding loans on October 7, the outstanding loans only decreased by $5.06 billion (11.55%) as of October 31.
Notably, since its launch on October 6, the Plasma blockchain has attracted significant lending activity within five weeks, with total outstanding loans exceeding $3 billion as of October 31. The Aave protocol holds a substantial share of the lending market on Plasma, accounting for 68.8% of the total lending volume on that chain as of October 31. Plasma has now become Aave's second-largest instance, replacing Arbitrum, which had long held the second position.
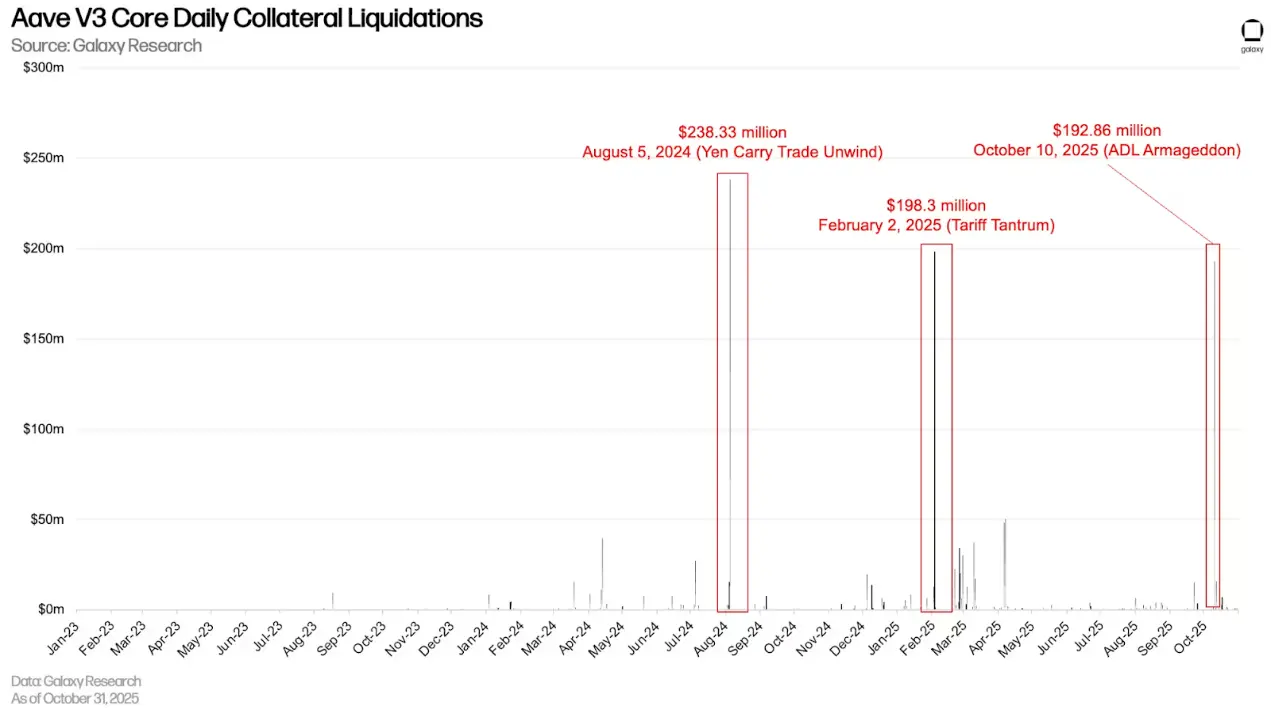
The automatic deleveraging (ADL) event on October 10 led to a significant increase in liquidation volumes within lending applications. Aave V3 Core on Ethereum experienced its third-highest daily liquidation amount ever, reaching $19.286 million, second only to the liquidation during the yen arbitrage trade in August 2024 and the event in February 2025 that caused a sharp drop in cryptocurrency prices due to tariff issues. On October 10, the most liquidated asset type was wrapped Bitcoin, with a liquidation amount of $8.217 million.
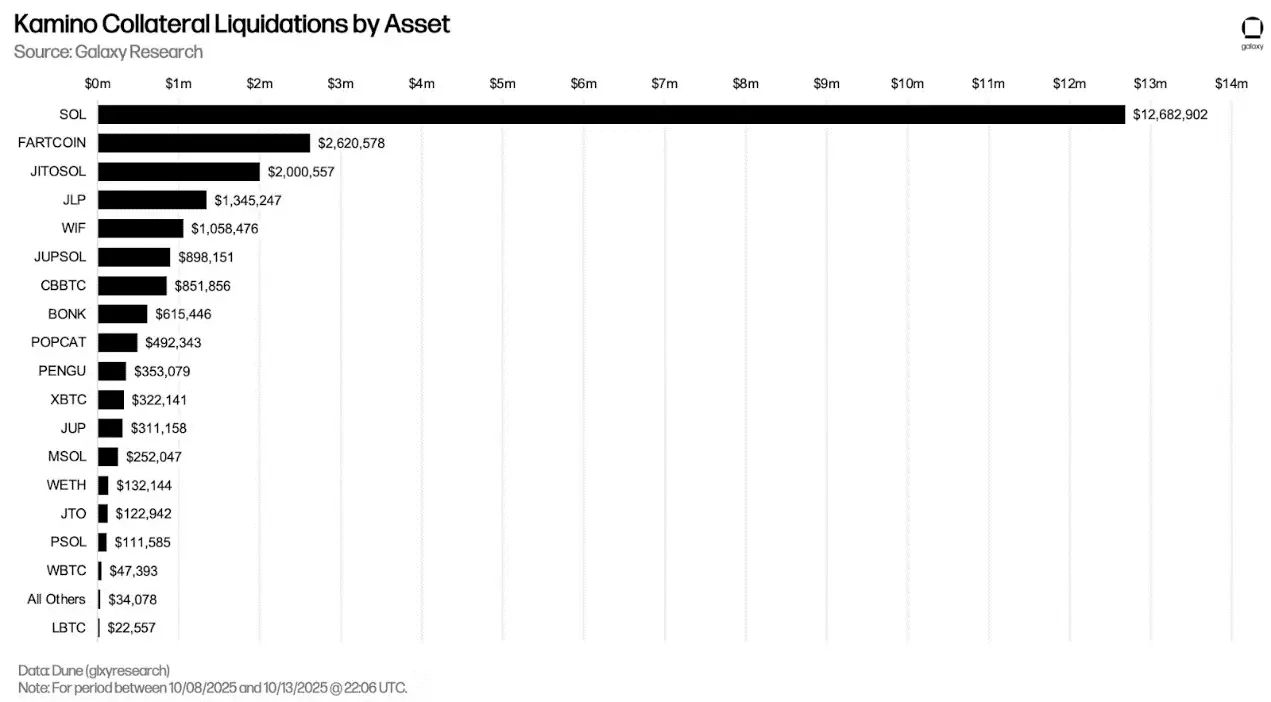
Kamino also experienced significant liquidations between October 8 and 10, with $12.7 million worth of WSOL and $2.6 million worth of FARTCOIN being liquidated.
During the deleveraging on October 10, Fluid (involving five chains) had $17.38 million in liquidations, while Morpho (involving 12 chains) had $27.7 million in liquidations.
On-chain and Off-chain Rates
The following compares the lending rates of stablecoins, Bitcoin, and Ethereum in the on-chain lending market and off-chain channels.
Stablecoins
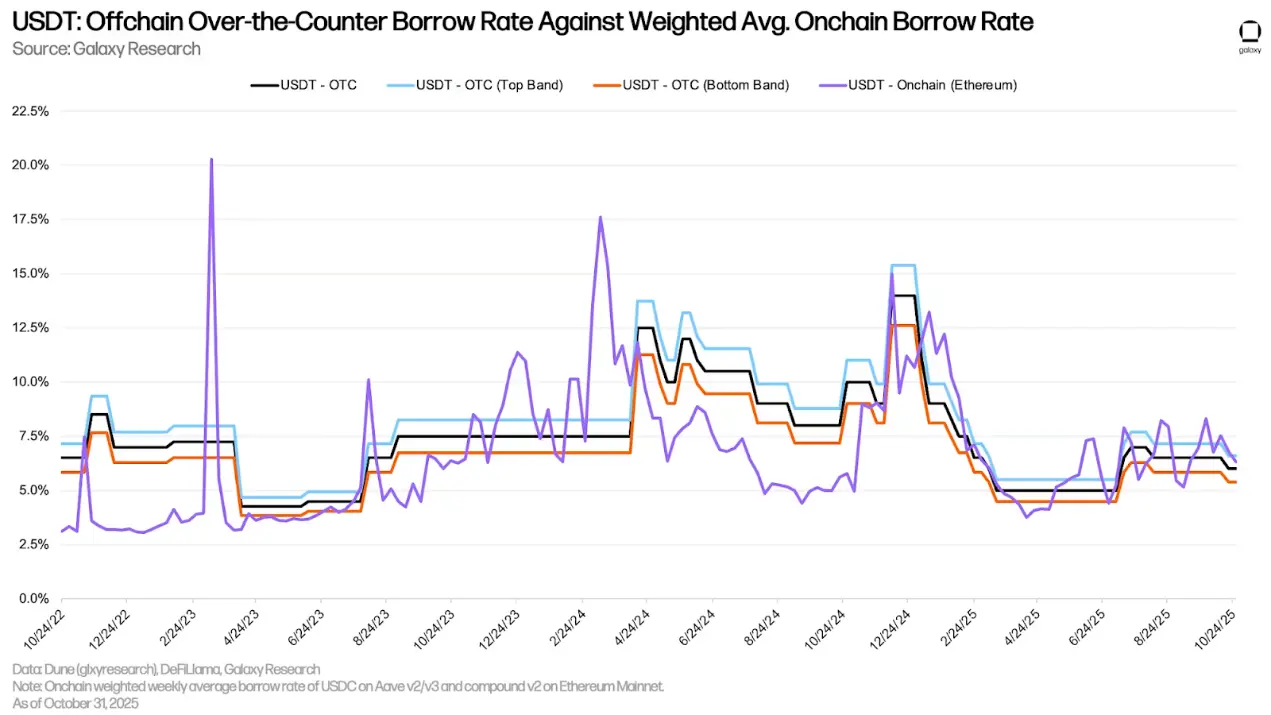
As of October 31, the weighted average lending rate for stablecoins slightly increased from 4.23% on June 30 to 4.83%. This data is derived from the borrowing costs of lending protocols and the minting fees for CDP stablecoins, weighted by the amount of outstanding loans.

The following chart lists the costs of borrowing stablecoins through lending applications and the costs of minting CDP stablecoins using cryptocurrencies as collateral. The trends of these two rates are closely related; however, the CDP stablecoin minting rate typically exhibits less volatility, as it is set manually at regular intervals and does not fluctuate in sync with the market.

This quarter, the over-the-counter (OTC) benchmark rate for USDC rose from 5% on June 30 to 6.5% on September 30. However, this rate has since slightly decreased to 6%. The on-chain rate for USDC this quarter is closer to the bottom (lowest risk) range of the OTC rate and did not exceed the midpoint of the OTC rate during the third quarter, based on weekly average rates.

The following chart tracks the same rates as above but focuses on USDT lending. The on-chain rate for USDT is closer to the OTC mid-price than that of USDC.
Bitcoin
The following chart shows the weighted borrowing rates for wrapped Bitcoin (WBTC) across multiple applications and on-chain. The cost of borrowing wrapped Bitcoin on-chain is generally lower, as wrapped Bitcoin tokens are primarily used as collateral in on-chain markets, leading to lower demand for borrowing. Unlike stablecoins, the cost of borrowing Bitcoin on-chain remains stable, as users borrow and repay Bitcoin less frequently. The on-chain borrowing rate for Bitcoin decreased from 0.28% at the end of the second quarter to 0.22% at the end of the third quarter.

In the third quarter, the historical difference between on-chain and off-chain Bitcoin borrowing rates persisted, although the off-chain Bitcoin borrowing rate saw a significant decline. In the off-chain trading market, the demand for borrowing Bitcoin is primarily driven by two factors: 1) the demand to short Bitcoin; 2) using Bitcoin as collateral for stablecoin and cash loans. The former is a less common source of demand in the on-chain lending market, resulting in a price difference between on-chain and off-chain Bitcoin borrowing costs.
As of September 30, the off-chain trading rate for Bitcoin decreased by 175 basis points this quarter, from 3% to 1.25%.

ETH and stETH
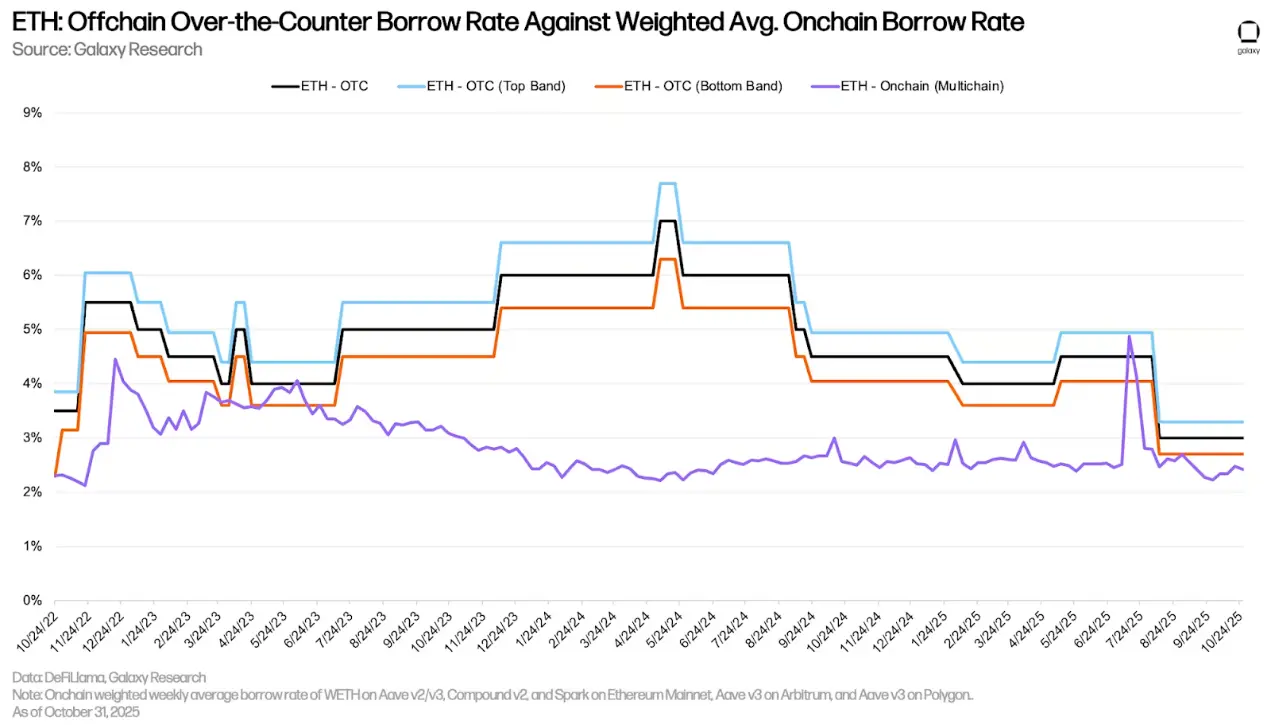
The following chart shows the weighted borrowing rates for ETH and stETH in lending applications across multiple applications and blockchains. Since users borrow ETH to drive cyclical strategies, gaining leveraged exposure to the Ethereum network's staking annual yield—with stETH as collateral—ETH's borrowing costs have historically been higher than those of stETH. Therefore, the borrowing cost of ETH typically fluctuates within a range of 30 to 50 basis points above the staking annual yield of Ethereum. When borrowing costs exceed staking yields, this strategy becomes uneconomical, making it uncommon for borrowing annual rates to remain significantly above staking annual rates for extended periods. However, due to large withdrawals from Aave V3 Core on Ethereum, ETH's borrowing rates saw a significant spike in July.
Similar to WBTC, the borrowing costs for stETH are generally lower, as this asset is primarily used as collateral and has limited use cases.

By using LSTs (liquid staking tokens) or LRTs (liquid staking yield tokens) as collateral, users can obtain ETH loans at lower net borrowing rates (often negative). This cost-effectiveness drives a cyclical strategy where users repeatedly use LSTs as collateral to borrow unstaked ETH, stake it, and then use the resulting LSTs to borrow more ETH, thereby amplifying their exposure to the stETH staking annual yield. This strategy is only viable when the borrowing cost of ETH is lower than the stETH staking annual yield. Most of the time, users can successfully implement this strategy.
However, from July 15 to 25, there was a capital outflow of nearly 300,000 ETH from the Aave V3 core protocol on Ethereum. This led to a spike in ETH borrowing rates, making the cyclical strategy unprofitable (as shown by the net rate remaining above 0% in the chart below). Since then, the interest rate environment for ETH has stabilized, and the cyclical strategy has once again become profitable. However, the scale of traders' cycles appears to be smaller, with the amount of ETH borrowed on Aave V3 core decreasing from about 2.3 million in mid-July to about 2.1 million as of November 4.

Off-chain Ethereum Trading Rates
Similar to Bitcoin, borrowing Ethereum through on-chain lending applications is significantly cheaper than borrowing through off-chain trading. This is driven by two factors: 1) like Bitcoin, there is substantial demand from short sellers in off-chain trading, which is less common on-chain; 2) the staking annual yield of Ethereum serves as the minimum rate for off-chain trading lending, as there is little incentive for suppliers to deposit assets into off-chain trading venues or to lend assets at rates below the staking annual yield. Therefore, for Ethereum, the minimum rate for off-chain trading lending is typically the staking annual yield, while on-chain, the staking annual yield usually serves as the upper limit rate maintained by arbitrageurs.
Corporate Debt Strategies
At the beginning of the third quarter, digital asset treasury (DAT) companies once again became a focal point. Unlike the previous quarter, there was an increase in non-Bitcoin-related DATs. Ethereum DATs, such as SBET and Bitmine, gained more attention as they began to implement treasury strategies, while the launch of Forward Industries expanded the landscape for Solana DATs.
For most of this year, outstanding debt has remained stable, increasing by $422.5 million in the third quarter. Strategy still holds the most debt, totaling $8.214 billion (excluding perpetual debt). The outstanding debt of Strategy remained unchanged compared to the previous quarter.

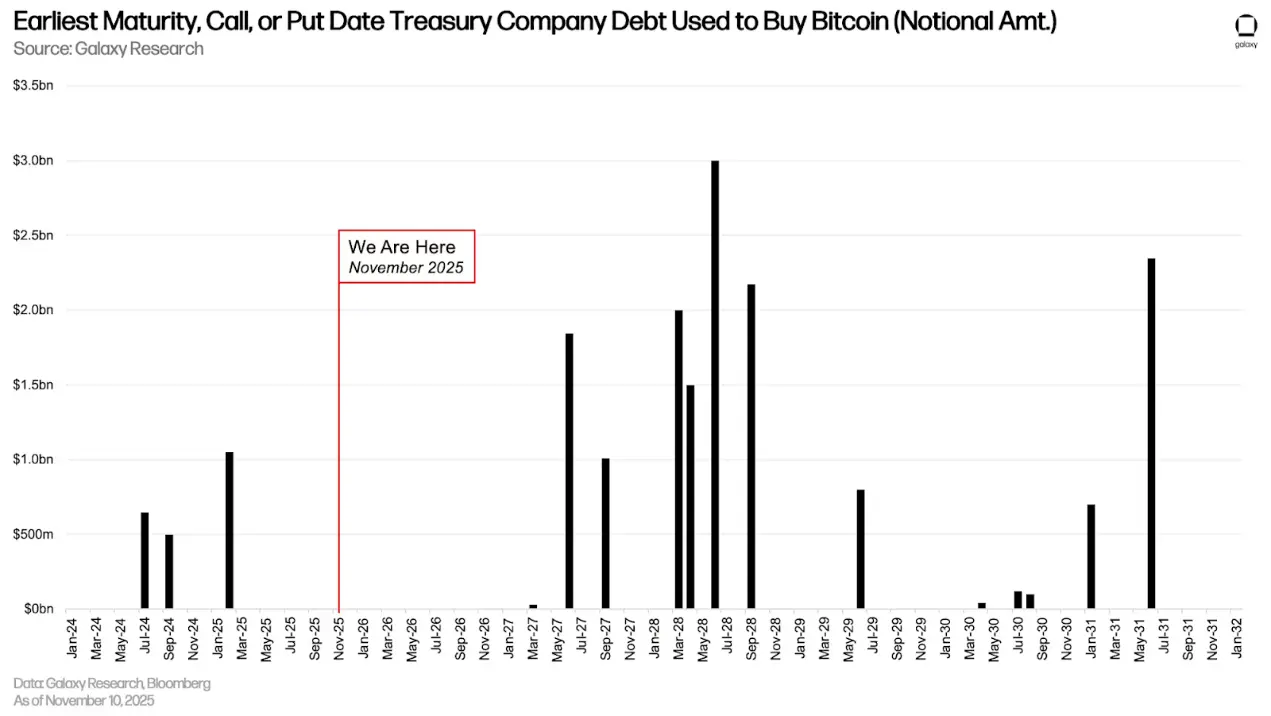
Most DAT debts are set to mature between June 2027 and October 2028.
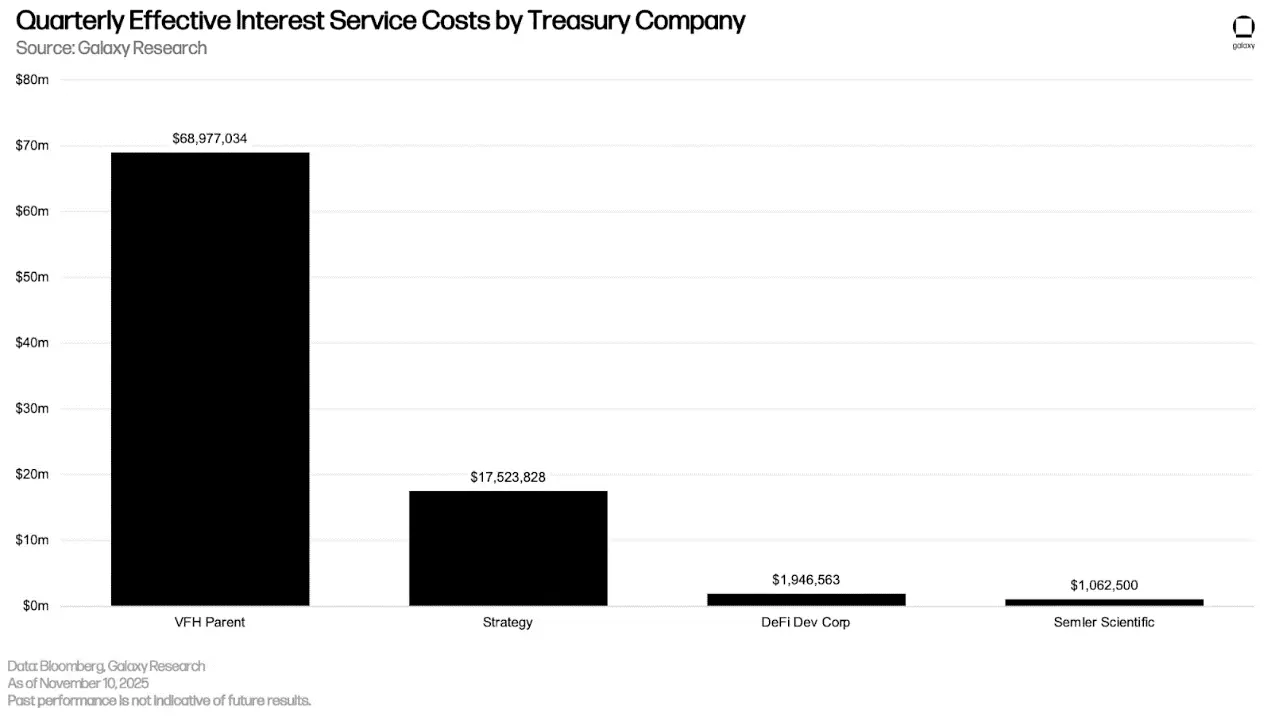
The actual quarterly interest receivable for Strategy and Semler Scientific remained unchanged compared to the previous report, while the newly added VFH Parent and DeFi Development Corp. owe $68.98 million and $1.95 million, respectively.
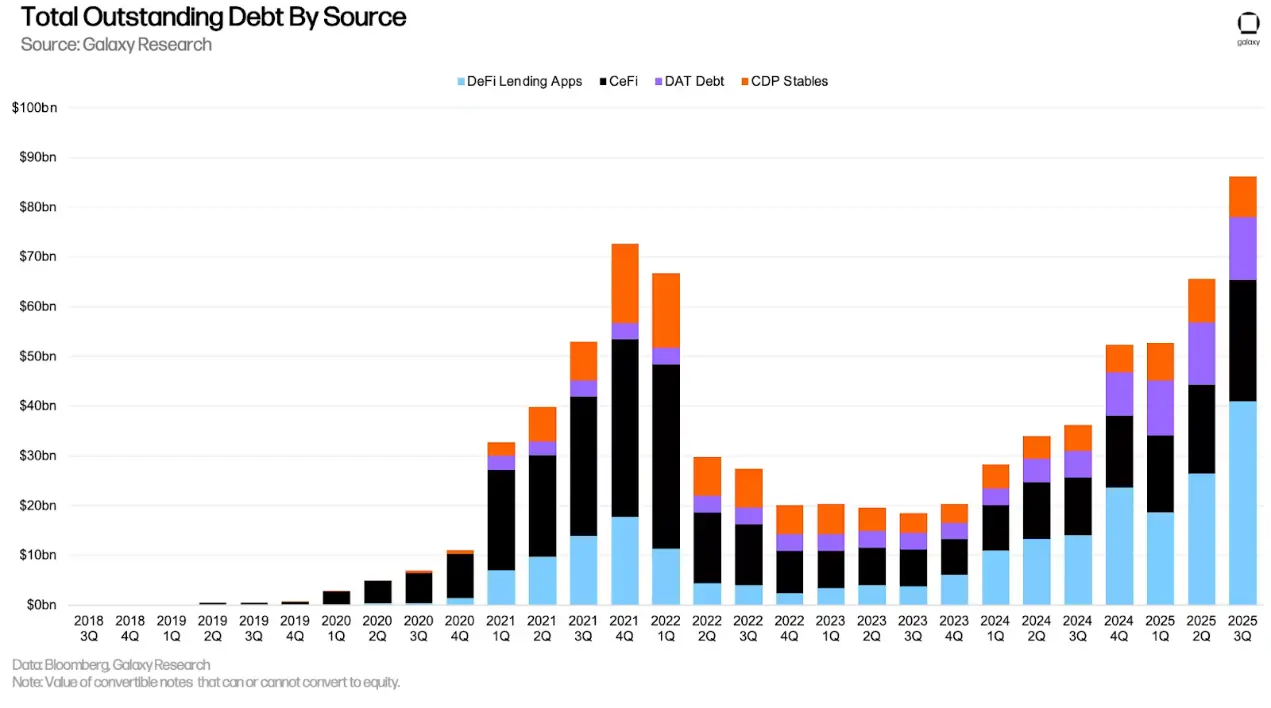
Including the debt undertaken by DAT, the total outstanding debt reached a historical high of $86.26 billion in the third quarter. This represents a quarter-on-quarter growth of 31.33%, an absolute increase of $20.58 billion. The new historical high exceeds the previous peak of $72.67 billion set in the fourth quarter of 2021 by $13.59 billion.
Futures Market
As of September 30, the open interest (OI) for futures contracts, including perpetual futures, grew by 41.46% from the previous quarter, rising from $132.75 billion to $187.79 billion, and reached a historical high of $220.37 billion on October 6. After the liquidation of perpetual futures on October 10, the open interest dropped overnight from $207.62 billion on October 9 to $146.06 billion at the close on October 10. In the third quarter:
- As of October 29, Bitcoin futures open interest increased by $9.41 billion (+14.45%), reaching $74.52 billion, with a total contract value of $77.82 billion.
- Ethereum futures open interest increased by $22.37 billion (+76.61%), reaching $51.52 billion, with a total contract value of $44.78 billion as of October 29.
- As of October 29, Solana futures open interest increased by $6.05 billion (growth of 91.94%), reaching $12.63 billion, with a total contract value of $11.52 billion.
- As of October 29, futures open interest for all other crypto assets increased by $17.21 billion, reaching $49.12 billion (growth of 53.93%), with a total contract value of $30.68 billion.
It is important to note that the total position of futures open interest does not reflect whether traders are using 2x leverage or 100x leverage, nor does it reveal how much of the open interest comes from directional bets versus hedging or delta-neutral structures. Some open interest is generated by traders holding the underlying assets who hedge by shorting perpetual contracts or futures. These positions increase the number of open contracts but do not add meaningful directional risk, so the raw number of open contracts alone does not indicate how high the actual leverage level in the market is.
The liquidation wave on October 10 was the largest single-day liquidation event in history, with liquidations of over $19 billion for both long and short positions. Hyperliquid alone reported liquidations of $10.27 billion within 24 hours. Bybit and Binance followed closely, reporting liquidations of $4.6 billion and $2.3 billion, respectively.
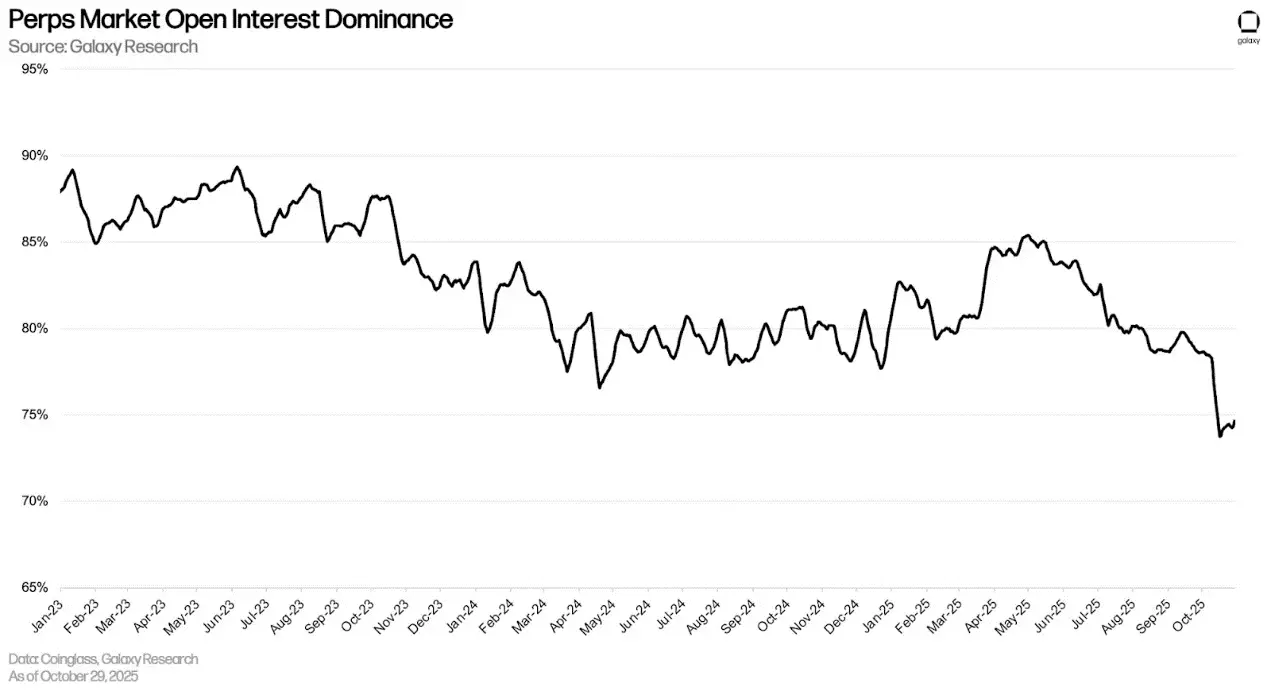
As of September 30, the Chicago Mercantile Exchange (CME) held a share of 14.4% of open contracts (including perpetual and non-perpetual contracts), a decrease of 109 basis points from the previous quarter. As of September 30, CME's share of the total open contracts in Ethereum was 17.28% (an increase of 651 basis points from the previous quarter); while CME's share of the total open contracts in Bitcoin was 20.78% (a decrease of 554 basis points from the previous quarter). The leverage unwind on October 10 caused CME's share of futures open contracts to rise overnight from 14.78% to 18.76%, an increase of 398 basis points.

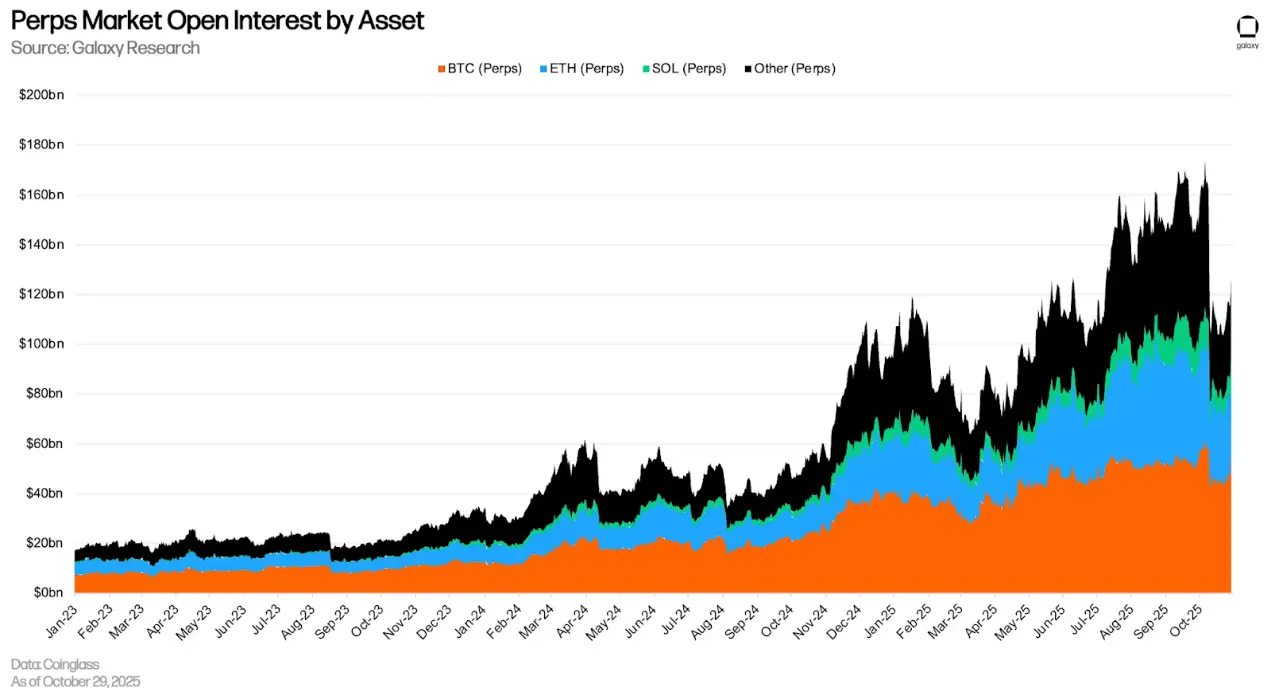
Perpetual Contracts
As of September 30, the value of perpetual contracts open interest was $147.55 billion, an increase of $38.62 billion (+36.05%) from the end of the second quarter. As of October 29, the value of perpetual contracts open interest decreased by 27.14% from the historical high of $173.41 billion set on October 6. The market share of Bitcoin perpetual contracts was 45.15%, Ethereum was 24.24%, Solana was 7.47%, and all other contracts accounted for 23.15%.
As of October 29, the value of perpetual contracts open interest accounted for 76.67%, a decrease of 538 basis points from the end of the second quarter. The liquidation wave on October 10 caused the proportion of perpetual contracts open interest to plummet by 442 basis points overnight, as users were liquidated and automatically closed their positions, while non-perpetual contracts remained stable.
Conclusion
In the third quarter of 2025, outstanding loans, futures open interest, and DAT debt all reached new highs, but the composition of leverage differs from previous cycles. The growth was primarily driven by collateralized on-chain lending and CeFi lending, rather than unsecured credit and highly speculative strategies.
Although the liquidation wave on October 10 exposed the scale and reflexivity of derivatives leverage, it did not reveal systemic credit risk. Most forced liquidations were mechanical rather than due to bankruptcy. However, the event highlighted that leverage remains deeply embedded in market structure, even as its transmission channels have changed.
Overall, cryptocurrency leverage has expanded again, but collateral standards are stricter, transparency is higher, and the boundaries between credit and speculation are clearer. The system is not without risk, but its foundation is more solid than it was in 2021.
Related reading: A Comprehensive Analysis of Q2 Crypto Market Leverage Status
免责声明:本文章仅代表作者个人观点,不代表本平台的立场和观点。本文章仅供信息分享,不构成对任何人的任何投资建议。用户与作者之间的任何争议,与本平台无关。如网页中刊载的文章或图片涉及侵权,请提供相关的权利证明和身份证明发送邮件到support@aicoin.com,本平台相关工作人员将会进行核查。


