The digital asset market is turbulent, with Bitcoin's price dropping to $86,100, yet on-chain data reveals a silent transfer of chips.
Behind the panic permeating the market is a profound transformation in Bitcoin's holding structure. Long-term whales remain steadfast, mid-term players hastily exit, while a batch of new "small fish" quietly takes over.
The futures market is undergoing a cleansing after excessive speculation, with open interest contracts plummeting by 32% and funding rates rebounding from the bottom. This adjustment is not just a price correction but also a restructuring of market participants.
1. Market Appearance: Panic Spreads and Price Correction
The Bitcoin market is undergoing a test of confidence. As of November 21, 2025, Bitcoin's price has fallen to around $86,100, a 30% correction from recent highs.
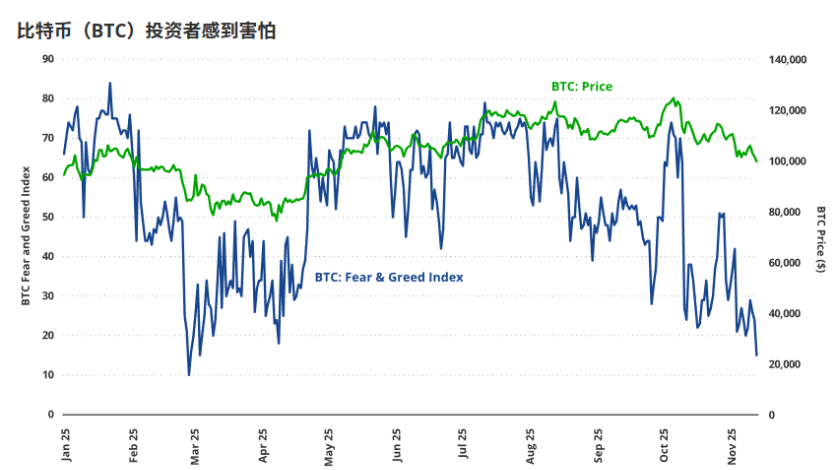
● Panic sentiment is rampant in the market. The Fear/Greed Index has dropped to its lowest level since the "tariff panic" in March 2025, with market sentiment at a freezing point.
● Continuous outflows from ETPs (Exchange-Traded Products) have exacerbated market weakness. Since October 10, the BTC ETP balance has decreased by a cumulative 49,300 BTC, equivalent to 2% of the total assets under management.
● The retreat of weak holders has become a major source of selling pressure. Investors who entered at high prices, facing uncertainty over interest rate adjustments and wavering AI narratives, ultimately chose to surrender and exit.
● More notably, a whale from the "Satoshi era" emptied an entire wallet during the week of November 14, selling BTC worth up to $1.5 billion. This action further shook the already fragile market confidence.
2. Holder Map: Differentiation Between Long-term Whales and Mid-term Players
Beneath the market appearance, there is a significant differentiation in the behavior of Bitcoin holders.
● Long-term whales holding Bitcoin for over five years have shown remarkable steadfastness. AiCoin data indicates that these oldest wallets not only refrained from selling but also net increased their Bitcoin supply by 278,000 BTC over the past two years.
● The real selling pressure comes from mid-term holders. On-chain data clearly shows that tokens last active between 3-5 years have experienced the largest outflow. This group has seen a 32% decrease in supply over the past two years, with a large number of tokens transferred to new addresses.
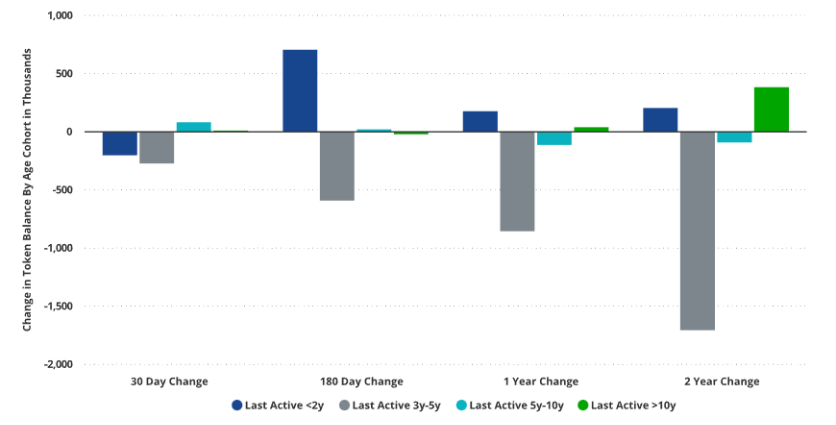
● VanEck analysts point out that these mid-term holders are mostly "cycle-driven traders" rather than long-term believers. Many accumulated chips during the downturn of the last Bitcoin cycle and are now choosing to take profits at relatively high prices. Tokens aged between 6 months and 2 years show net growth, indicating that the market is experiencing a transfer of chips from mid-term holders to new entrants.
3. Whale Game: Strategic Divergence Between Large and Small Players
Bitcoin whales are not a monolith; holders of different sizes are engaged in a fascinating long-short game.
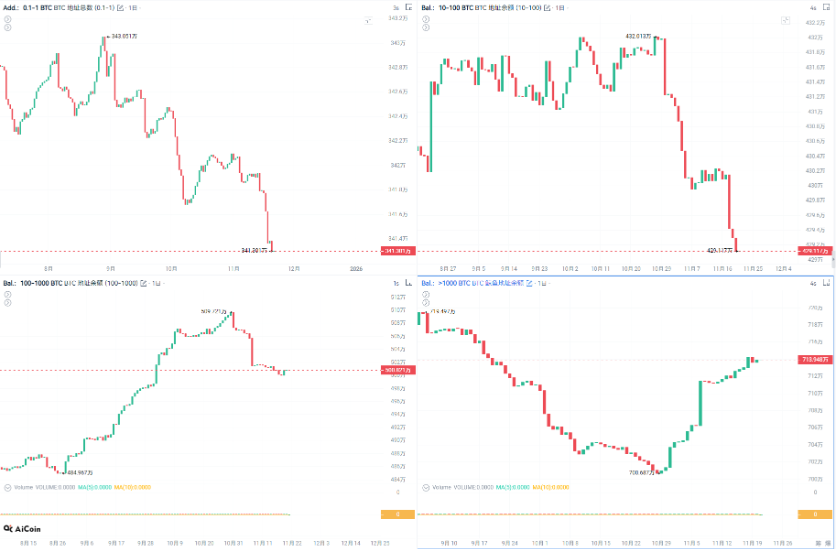
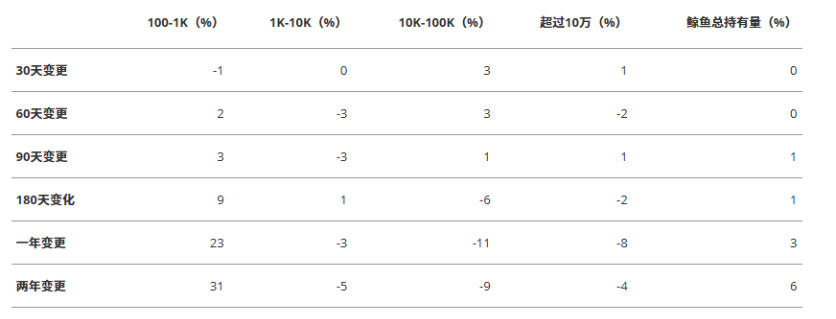
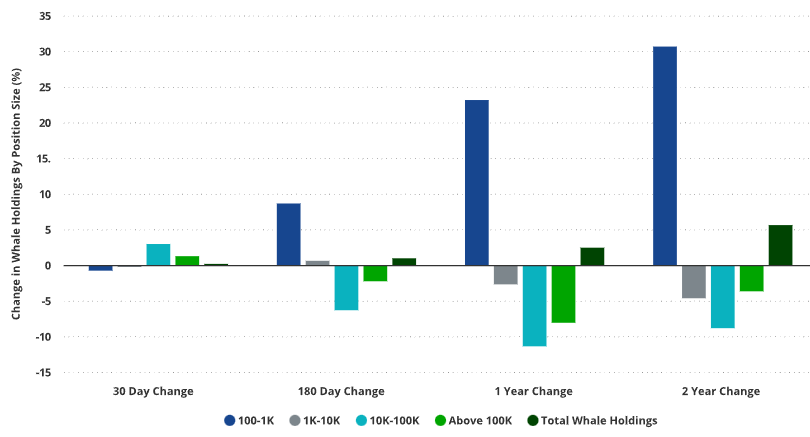
● Super large whales (holding 10,000-100,000 BTC) have continuously reduced their holdings over the past year, with supply decreasing by 11%. These largest market players are choosing to gradually cash out profits at market highs.
● The sold chips are being quietly absorbed by smaller whales (holding 100-1,000 BTC). This group has increased its holdings by 9% and 23% over the past 6 months and 12 months, respectively, demonstrating strong absorption capacity.
● Short-term data reveals a subtle change: some large whale groups have begun to replenish their positions after the recent price drop. The group holding 10,000–100,000 BTC has increased its holdings by approximately 3%, 2.5%, and 0.84% over the past 30 days, 60 days, and 90 days, respectively.
This exchange of chips between large and small whales reflects the market's differing value judgments across various price ranges and provides necessary liquidity to the market.
4. Futures Market: Speculative Bubble Compression and Reconstruction
The Bitcoin futures market has undergone a severe deleveraging process, with excessive speculation significantly curtailed.
● Open interest in perpetual futures has sharply shrunk. Since October 9, open interest calculated in BTC has decreased by 20%, while in USD it has plummeted by 32%. This drastic contraction reflects a significant decline in market leverage.
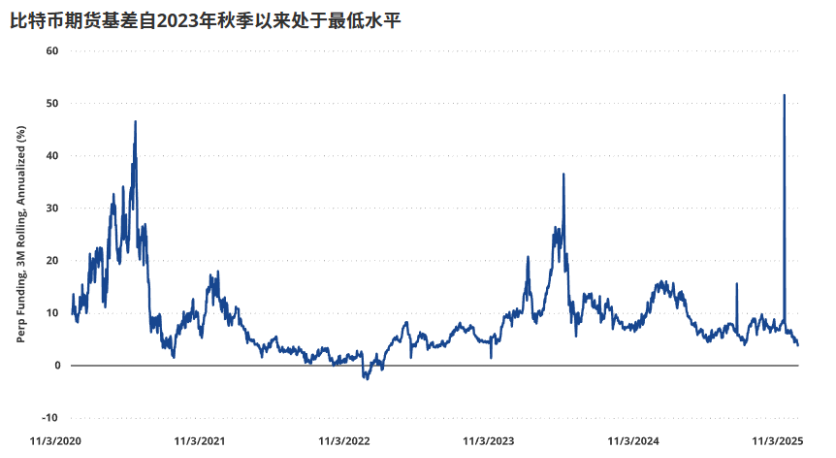
● A key indicator measuring market sentiment—the funding rate—has simultaneously collapsed, reaching its lowest level since the fall of 2023. The decline in funding rates indicates a clear reduction in bullish market sentiment and a substantial decrease in speculative activity.
● Historical experience shows that such a severe cleansing in the futures market often signals the formation of a phase bottom. In Bitcoin's history, prolonged price declines have typically preceded speculative frenzies with funding rates as high as 40%. However, since March 2024, the market has not seen such extreme speculative phenomena.
● An important factor to consider is that basis trading projects like Ethena have affected the effectiveness of funding rates. Ethena's TVL (Total Value Locked) plummeted from $14 billion in October 2025 to $8.3 billion, as a large number of "spot long + futures short" basis trades artificially depressed funding rates.
5. Opportunities Hidden in the Data
Beyond the surface panic, several on-chain indicators are sending positive tactical signals.
● NUPL (Net Unrealized Profit/Loss) has reached a tactically oversold level, similar to the "tariff panic" in spring 2025 and the "yen collapse" in August 2024. The historical performance of this indicator suggests that current levels often correspond to market phase bottoms.
● Miner behavior is becoming more rational. Despite the drop in Bitcoin prices, the amount transferred to exchanges by miners has decreased by 24%, indicating reduced selling pressure from miners. Meanwhile, mining difficulty has risen to 653T, setting a new historical high, showing that miners are still continuously investing.
● On-chain activity remains healthy. The number of daily active addresses is 695,396, although down 5% from last month, it remains at a historically high level. Notably, inscriptions activity has surged, increasing by 123% within 30 days, indicating that the application scenarios of the Bitcoin network are still expanding.
● The proportion of long-term holders remains stable. Bitcoin supply dormant for over 3 years accounts for as much as 43%, down 8 percentage points from a year ago, but still close to historical highs, indicating that true long-term investors have not been shaken by price fluctuations.
The market always oscillates between fear and greed, but data never lies. When panic becomes the headline, rational investors have already begun to listen to the whispers on-chain.
The underlying structure of Bitcoin remains solid, long-term holders' original intentions unchanged, and market leverage effectively squeezed. Those small fish quietly accumulating during the downturn may be nurturing the momentum for the next round of price increases.
Join our community to discuss and grow stronger together!
Official Telegram community: https://t.me/aicoincn
AiCoin Chinese Twitter: https://x.com/AiCoinzh
OKX benefits group: https://aicoin.com/link/chat?cid=l61eM4owQ
Binance benefits group: https://aicoin.com/link/chat?cid=ynr7d1P6Z
免责声明:本文章仅代表作者个人观点,不代表本平台的立场和观点。本文章仅供信息分享,不构成对任何人的任何投资建议。用户与作者之间的任何争议,与本平台无关。如网页中刊载的文章或图片涉及侵权,请提供相关的权利证明和身份证明发送邮件到support@aicoin.com,本平台相关工作人员将会进行核查。


