Written by: ChandlerZ, Foresight News
The price of Bitcoin fell sharply again after reaching a rebound test of the 2025 opening price around noon on November 20. Following the delayed release of the U.S. September non-farm payroll data, which was 43 days late, Bitcoin rose to $92,564 before dropping, with an intraday low near $86,000, marking a new low for the year.
ETH briefly fell below $2,800 but has since slightly recovered to around $2,850; SOL dropped to a low of $131 and is currently quoted at $134. According to Coinglass data, the total liquidation across the network in the past 24 hours reached $832 million, with long positions liquidated at $712 million and short positions at $119 million. Among them, Bitcoin saw liquidations of $410 million, while Ethereum had $177 million in liquidations.

According to SoSoValue data, the overall cryptocurrency market is in a downward trend, with the Layer1 sector down 3.79% in 24 hours. Within this sector, NEAR Protocol (NEAR) fell 12.36%; the CeFi sector dropped 3.98%, with Aster (ASTER) down 9.93%; the Meme sector decreased by 4.25%, with Cheems Token (CHEEMS) rising 10.40%; the DeFi sector fell 4.32%, with Uniswap (UNI) down 7.88%; the PayFi sector dropped 4.82%, with Telcoin (TEL) down 19.39%; and the Layer2 sector decreased by 5.05%, with SOON (SOON) down 17.72%.
Delayed September Non-Farm Data Causes Major Shock to Rate Cut Expectations
The U.S. September non-farm payroll data shows that 119,000 new non-farm jobs were added in September, significantly higher than the approximately 50,000 that economists had previously expected. However, alongside the job increase, the unemployment rate rose by 0.1 percentage points to 4.4%, the highest since October 2021, complicating the market's assessment of the employment situation.
Chicago Fed President Austan Goolsbee hinted that he remains cautious about the possibility of another rate cut at the Federal Reserve's December meeting. He stated that inflation seems to have stagnated, and there are even warning signs of it going in the wrong direction. "This makes me a bit uneasy."
Goolsbee noted that the September employment data indicates a stable job market that is slightly cooling, and unemployment claims data does not show a rapid deterioration in the job market. He even directly stated that after the Fed's rate cut in September, there is only a need for one more cut in 2025. This statement poured cold water on the market's expectations for a rate cut in the U.S.
Some U.S. economists emphasized that the stronger-than-expected job growth is a comforting highlight, but this resilience also means there is not enough reason to force the Fed to further loosen monetary policy in December. Meanwhile, the slight rise in the unemployment rate suggests some weakness within the labor market, making the overall economic assessment more nuanced. Some traders believe this employment report will reduce the likelihood of the Fed continuing to cut rates in December.
According to Polymarket data, the market's bets on the Fed not cutting rates in December have risen to 65%, even peaking at 76% on the 20th. Currently, the total trading volume in this prediction market exceeds $132 million.

Global Stock Markets in Turmoil, Tech Assets Under Pressure
Against this macro backdrop, Bitcoin's decline is not an isolated event but a reflection of the sharp downturn in global market sentiment. U.S. stocks experienced severe volatility, with all three major indices closing down. The Nasdaq fell 2.15%, the S&P 500 dropped 1.56%, and the tech sector was particularly weak, as even Nvidia's strong earnings report could not prevent investors from quickly fleeing high-risk assets.
On the 21st, Asian stock markets plummeted, with the Seoul Composite Index's intraday decline expanding to 4% and the Nikkei 225 Index dropping over 2%. The semiconductor and tech sectors were the main drivers of the sell-off: SK Hynix plummeted 9%, Kioxia briefly fell over 16%, and SoftBank dropped more than 11%.
Risk assets faced indiscriminate selling globally, indicating that capital is rapidly withdrawing from tech stocks, growth stocks, and crypto assets, flowing back into more liquid and safe-haven assets like the U.S. dollar and short-term bonds. Meanwhile, safe-haven funds are massively returning to dollar assets, pushing the dollar index to strengthen in the short term, further exacerbating the valuation pressure on global risk assets. Commodities like gold and oil also faced downward pressure, failing to show the resilience expected of traditional safe-haven assets, as market risk appetite shifts from holding assets to holding liquidity.
11 Consecutive Daily Losses, What’s Next for Bitcoin?
According to Glassnode's analysis, nearly all investor groups have recently experienced losses, a structure that typically triggers panic selling and weakens market momentum, requiring time to recover. In the short term, the $95,000 to $97,000 range may constitute local resistance; if the price can regain this range, it would indicate that the market is gradually restoring balance.

From the perspective of investor behavior, this recent crash marks the third time since early 2024 that prices have fallen below the lower bound of the short-term holder cost basis model. Moreover, the level of panic among top buyers is noticeably higher this time. The 7-day moving average of realized losses for short-term holders has surged to $523 million per day, reaching the highest level since the FTX collapse.
Such high realized losses highlight a heavier top structure formed between $106,000 and $118,000, with a density far exceeding previous cycle peaks. This means that either stronger demand is needed to absorb the sold stocks, or the market must undergo a longer and deeper accumulation phase to restore balance.
Additionally, from the perspective of investor behavior, this recent crash marks the third time since early 2024 that prices have fallen below the lower bound of the short-term holder cost basis model. The level of panic among top buyers is noticeably higher this time. The 7-day moving average of realized losses for short-term holders has surged to $523 million per day, reaching the highest level since the FTX collapse.
Such high realized losses highlight a heavier top structure formed between $106,000 and $118,000, with a density far exceeding previous cycle peaks. This means that either stronger demand is needed to absorb the sold stocks, or the market must undergo a longer and deeper accumulation phase to restore balance.
Currently, Bitcoin's Mayer multiple has retreated to the lower limit of the long-term range, indicating a slowdown in momentum. Historically, this often aligns with a price consolidation phase, where demand begins to enter the value-driven stage.

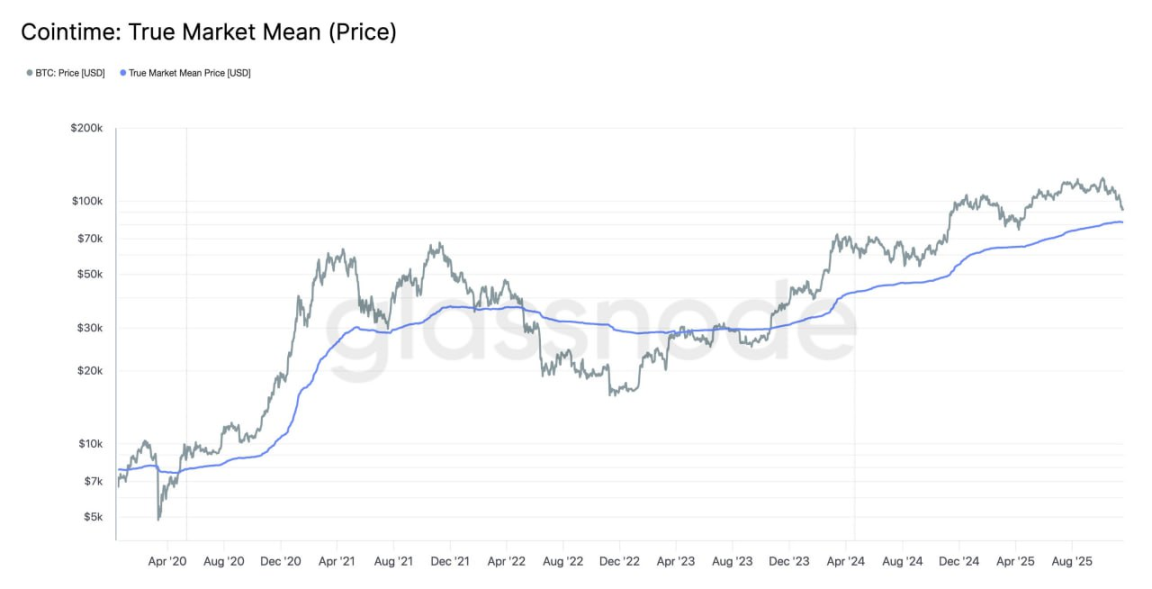
However, it also points out that although Bitcoin's price has fallen below the main lower bound of the short-term holder cost basis model, the scale and extent of losses suffered by investors are far less extreme than during the bear market of 2022-2023. The price range between the actual price for active investors ($88,600) and the real market average ($81,900) may serve as a boundary distinguishing a mild bear market phase from a comprehensive bear market structure similar to that of 2022-2023.
免责声明:本文章仅代表作者个人观点,不代表本平台的立场和观点。本文章仅供信息分享,不构成对任何人的任何投资建议。用户与作者之间的任何争议,与本平台无关。如网页中刊载的文章或图片涉及侵权,请提供相关的权利证明和身份证明发送邮件到support@aicoin.com,本平台相关工作人员将会进行核查。


