Shiba Inu (SHIB) has reached a point where the charts are giving us a clear picture of what's going on for the once popular meme coin. The price of SHIB, according to Trading View, sits near $0.00000867, and all three major time frames — daily, weekly, monthly — now point to the same conclusion: SHIB is currently at the lower end of its range, and the next move will decide if this is just a correction or if it will go deeper.
If you look at the daily chart, SHIB trades below the middle Bollinger Band at about $0.00000950, and every attempt to climb toward the upper band around $0.00001044 has failed. This shows a market that cannot break through the resistance, but it is not collapsing either.
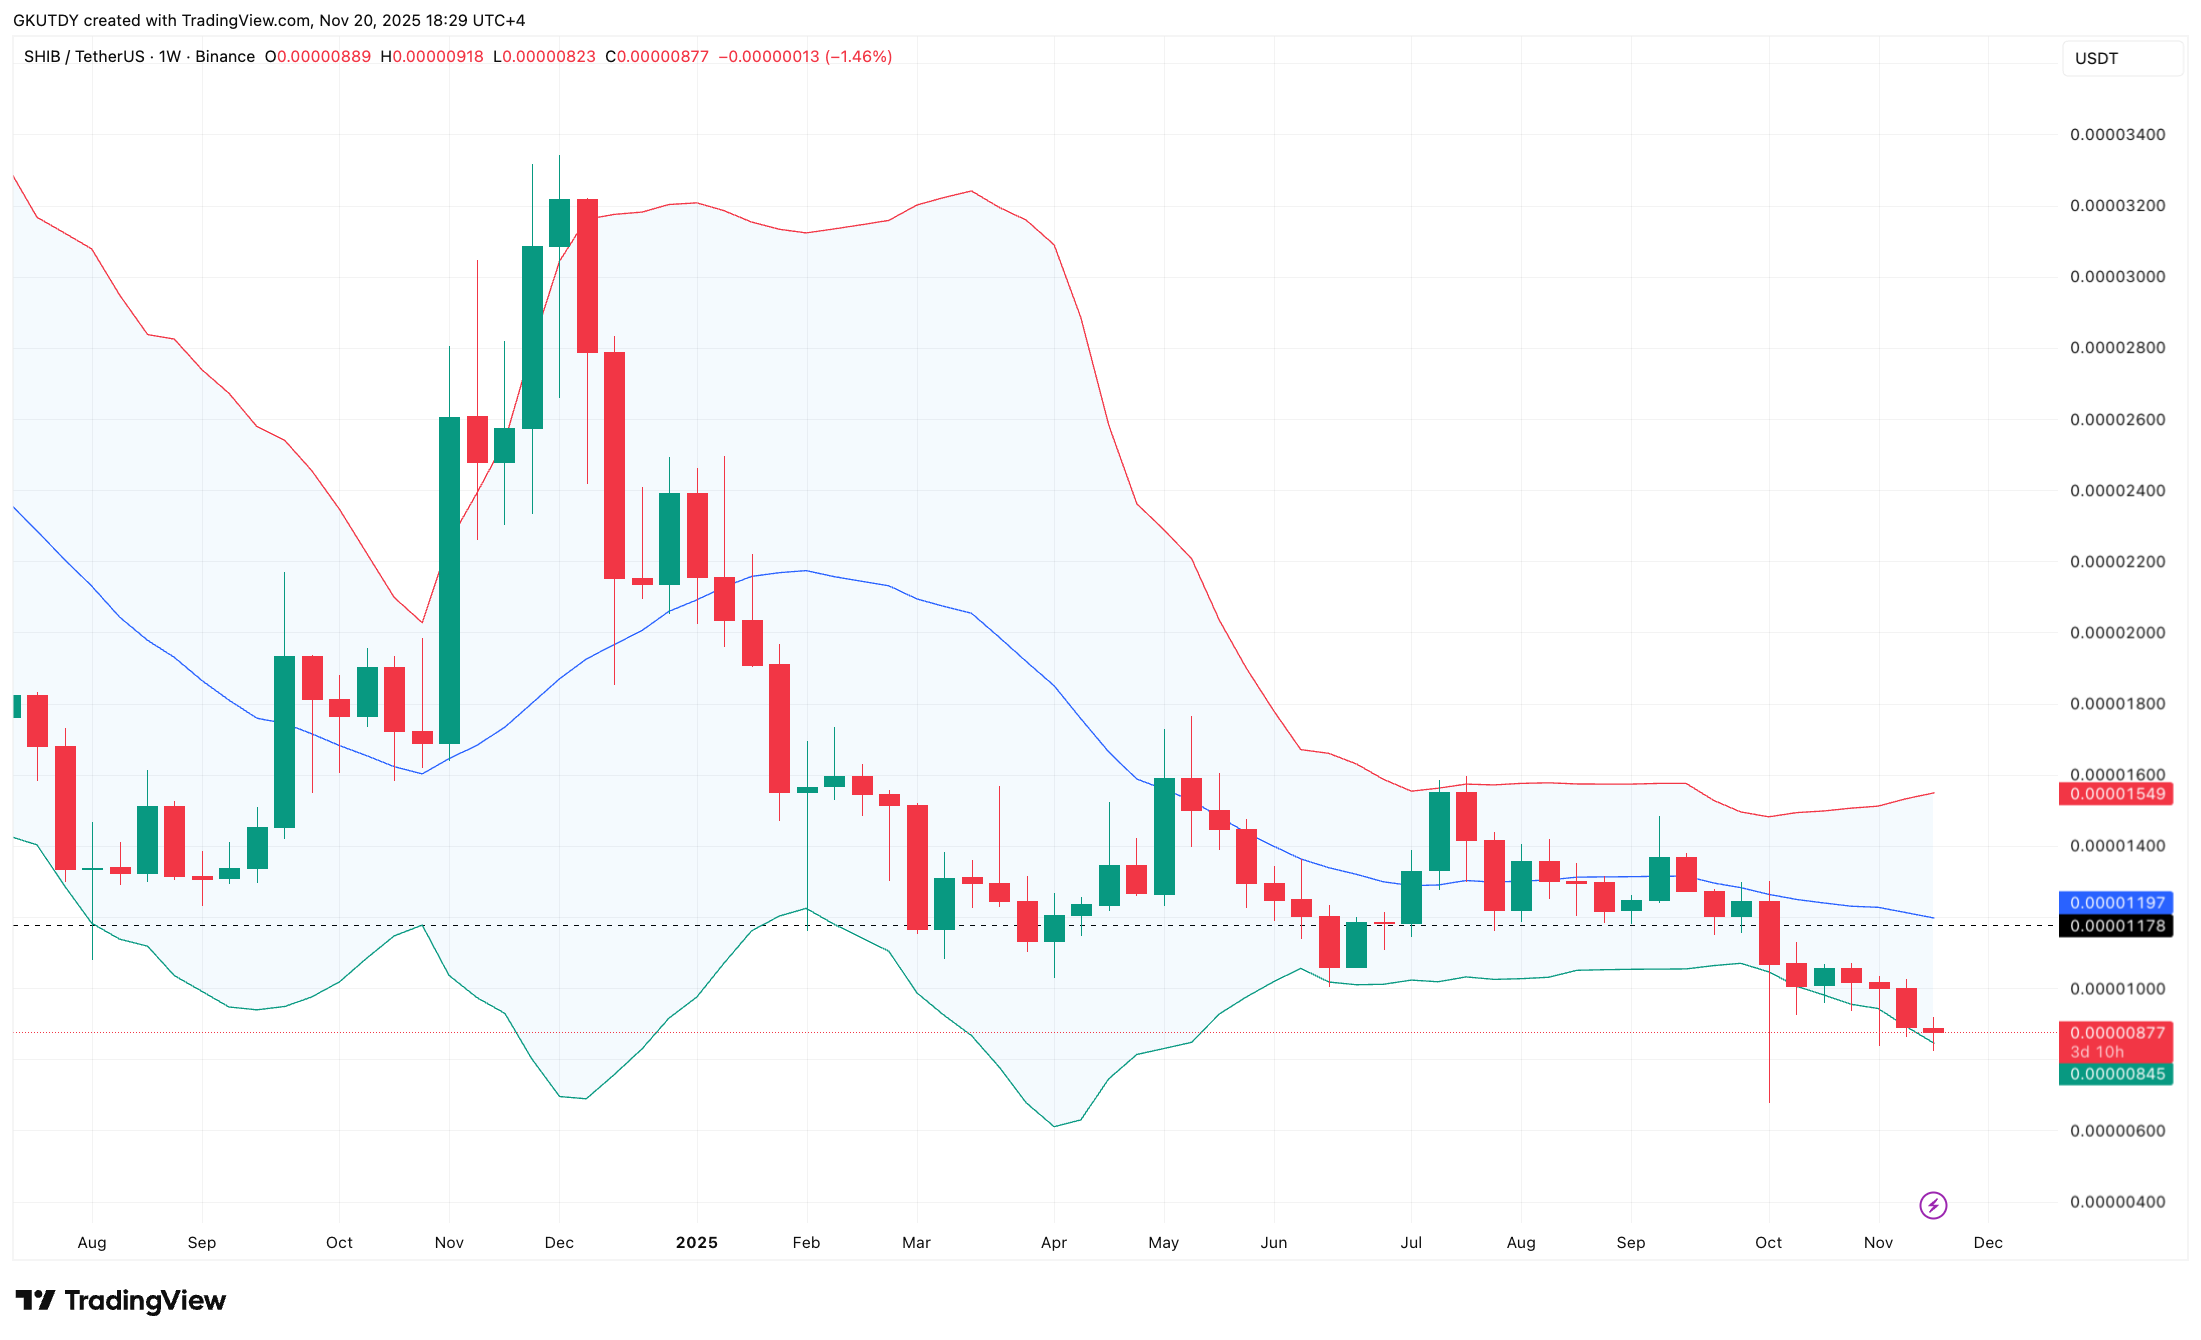
SHIB/USD by TradingView
The weekly chart explains why the situation feels tighter. The Shiba Inu coin has been stuck under the weekly midband at about $0.00001197 for months, and the price now sits just above the weekly lower band near $0.00000843. When an asset sits this close to the lower band without breaching it, it usually signals exhaustion rather than a trend break.
HOT Stories Billinaire Dalio: Bitcoin Could Be Hacked by Quantum Computing Morning Crypto Report: XRP Staking to Attract BlackRock? Santa Rally May Bring Bitcoin to $112,000, Shiba Inu (SHIB) Scores New Listing in USNvidia Rescues Bitcoin with Higher-Than-Expected EarningsXRP to Start Trading on NYSE Tomorrow
It also shows that buyers are no longer in control.
Can SHIB survive a 30% drawdown?
The monthly chart sets the full boundary. The midband is high at about $0.00001580. That level is the best case path, and it would require a move of more than 80% from current pricing to flip SHIB back into long-term bullish form.
You Might Also Like
Thu, 11/20/2025 - 11:45 Shiba Inu Gets Sudden Security Update for SHIB Holders, What's Behind It?ByTomiwabold Olajide
The lower band is at about $0.00000599, and that is the worst-case slide, a drop of around 31% that would send SHIB back to its early days' support.
The crossroads are as follows: if the SHIB price moves back above the weekly midband, it will continue rising, but if it goes below the monthly lower band, it will confirm the other direction.
免责声明:本文章仅代表作者个人观点,不代表本平台的立场和观点。本文章仅供信息分享,不构成对任何人的任何投资建议。用户与作者之间的任何争议,与本平台无关。如网页中刊载的文章或图片涉及侵权,请提供相关的权利证明和身份证明发送邮件到support@aicoin.com,本平台相关工作人员将会进行核查。


