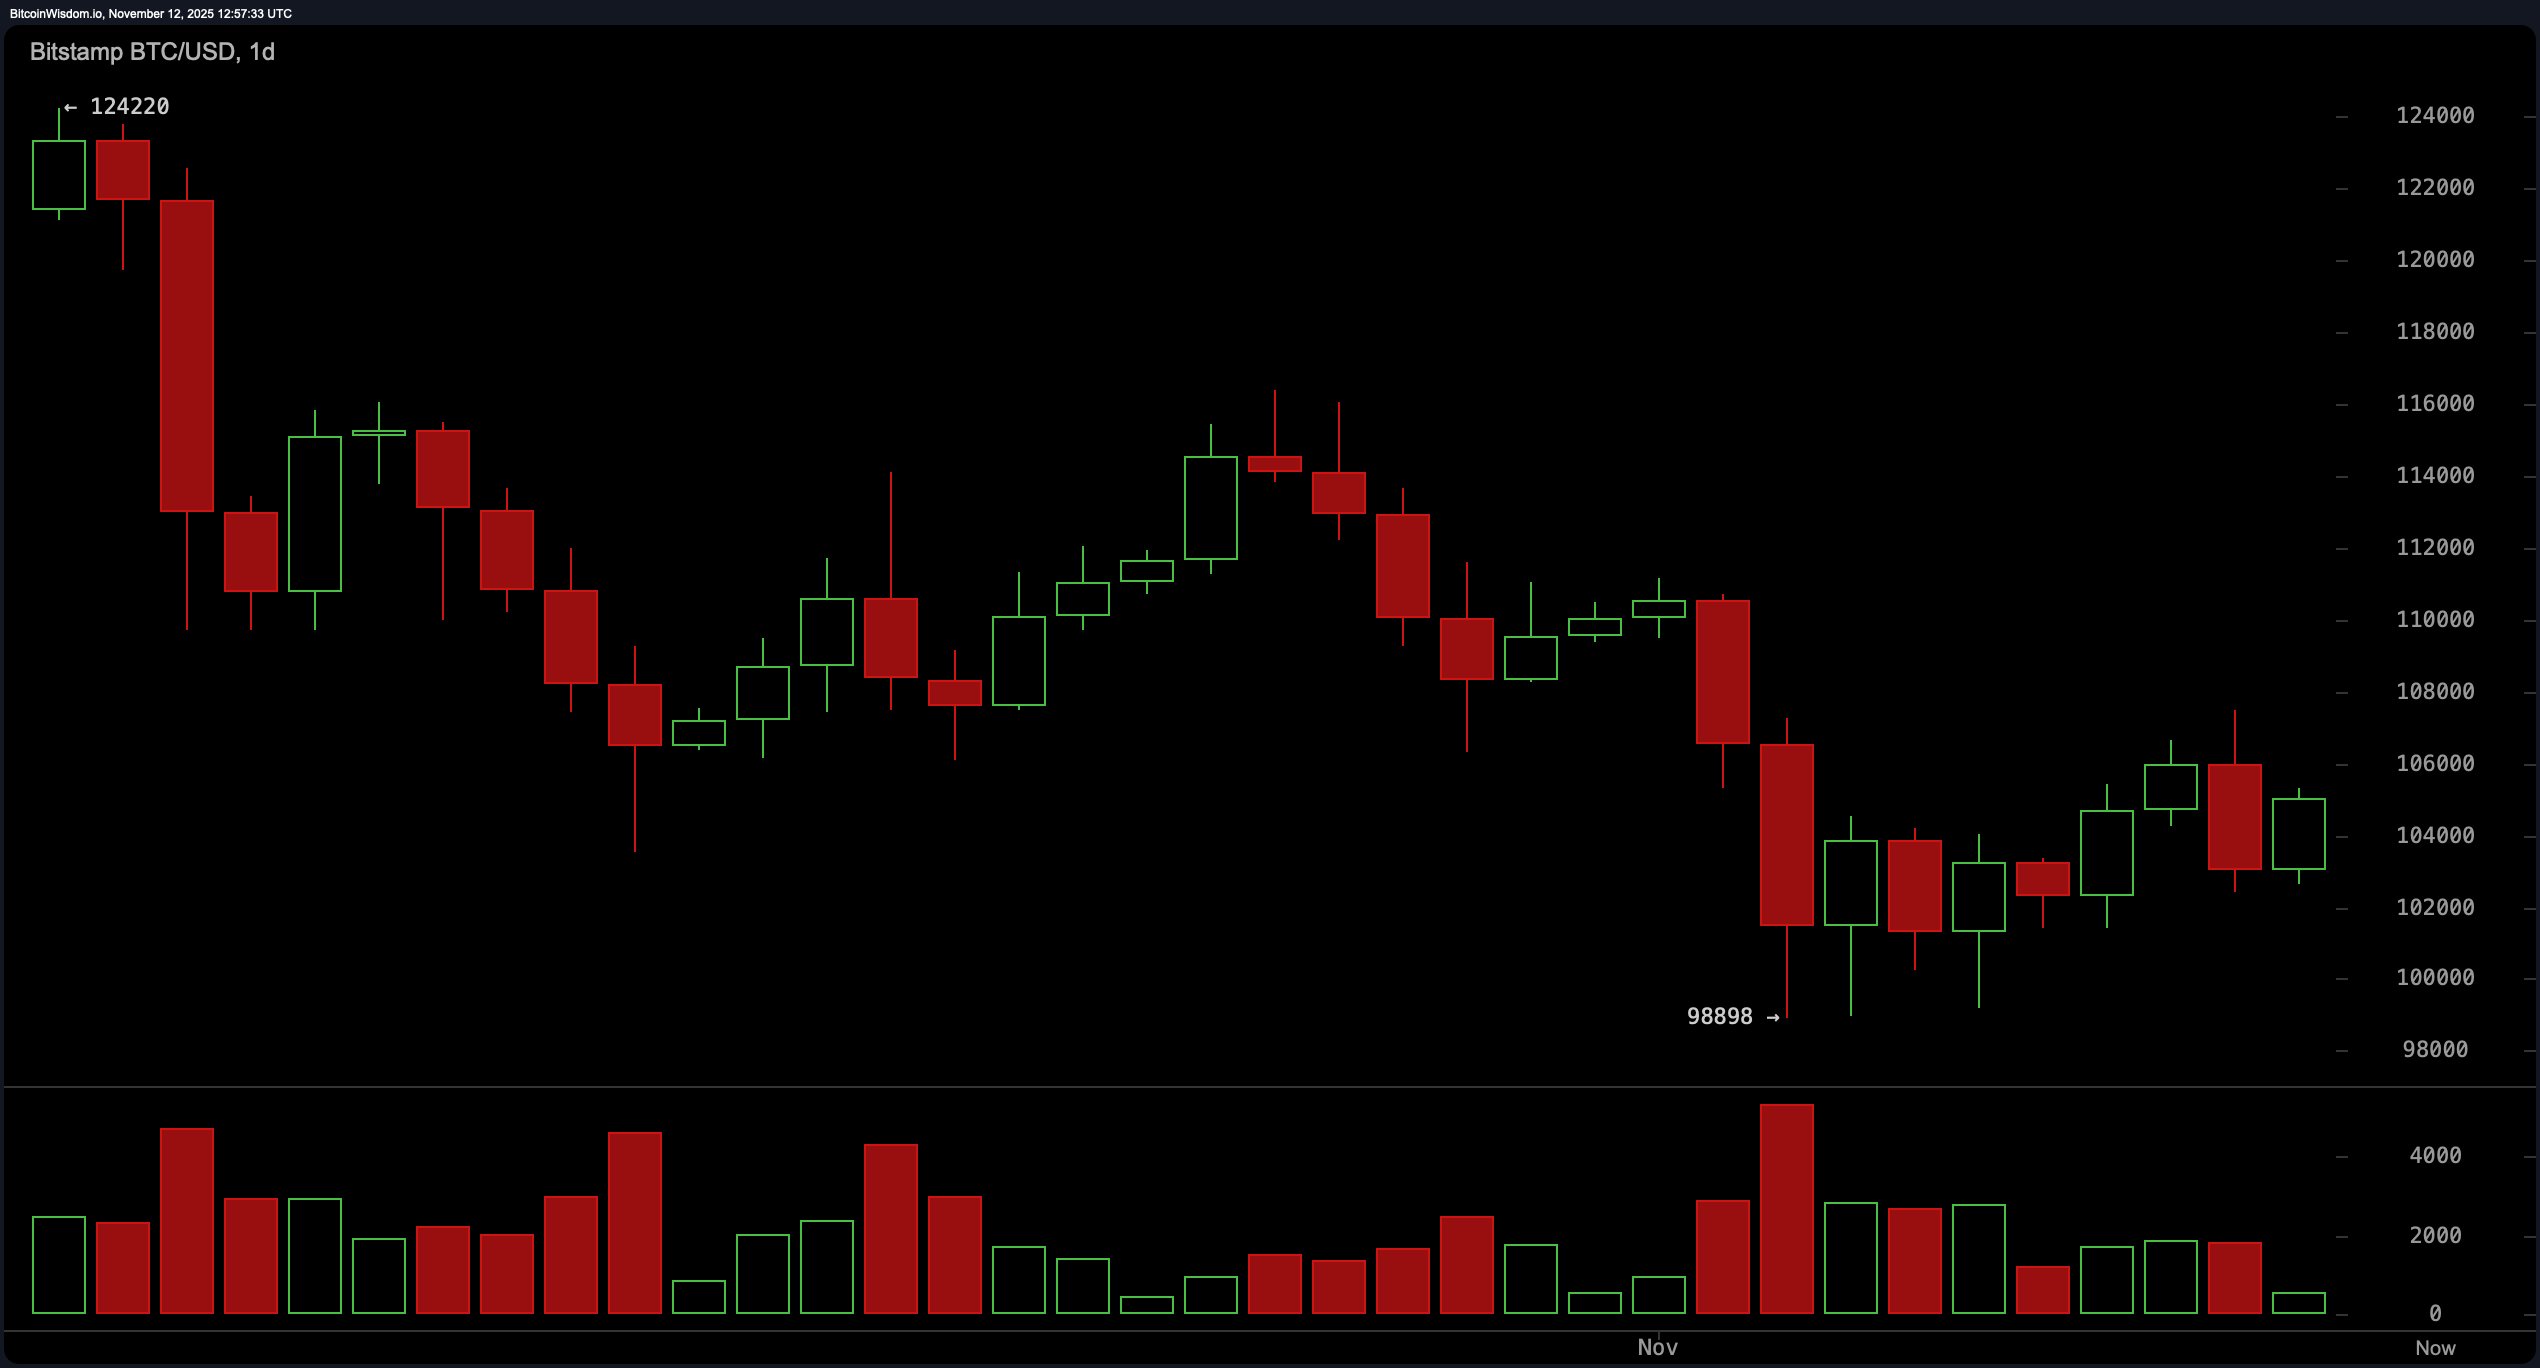
From a daily standpoint, bitcoin remains in a broader downtrend after cascading from its $124,220 high to a trough at $98,898. Recent price action shows a possible double bottom near the $99,000 support, with faint green candles signaling an attempted rebound.
However, the volume tells a more skeptical tale—waning enthusiasm as prices lift, which points to fragile bullish conviction. The $110,000 mark stands tall as macro resistance, and until bulls can muscle through it with volume, the ceiling remains solid.

BTC/USD 1-day chart via Bitstamp on Nov. 12, 2025.
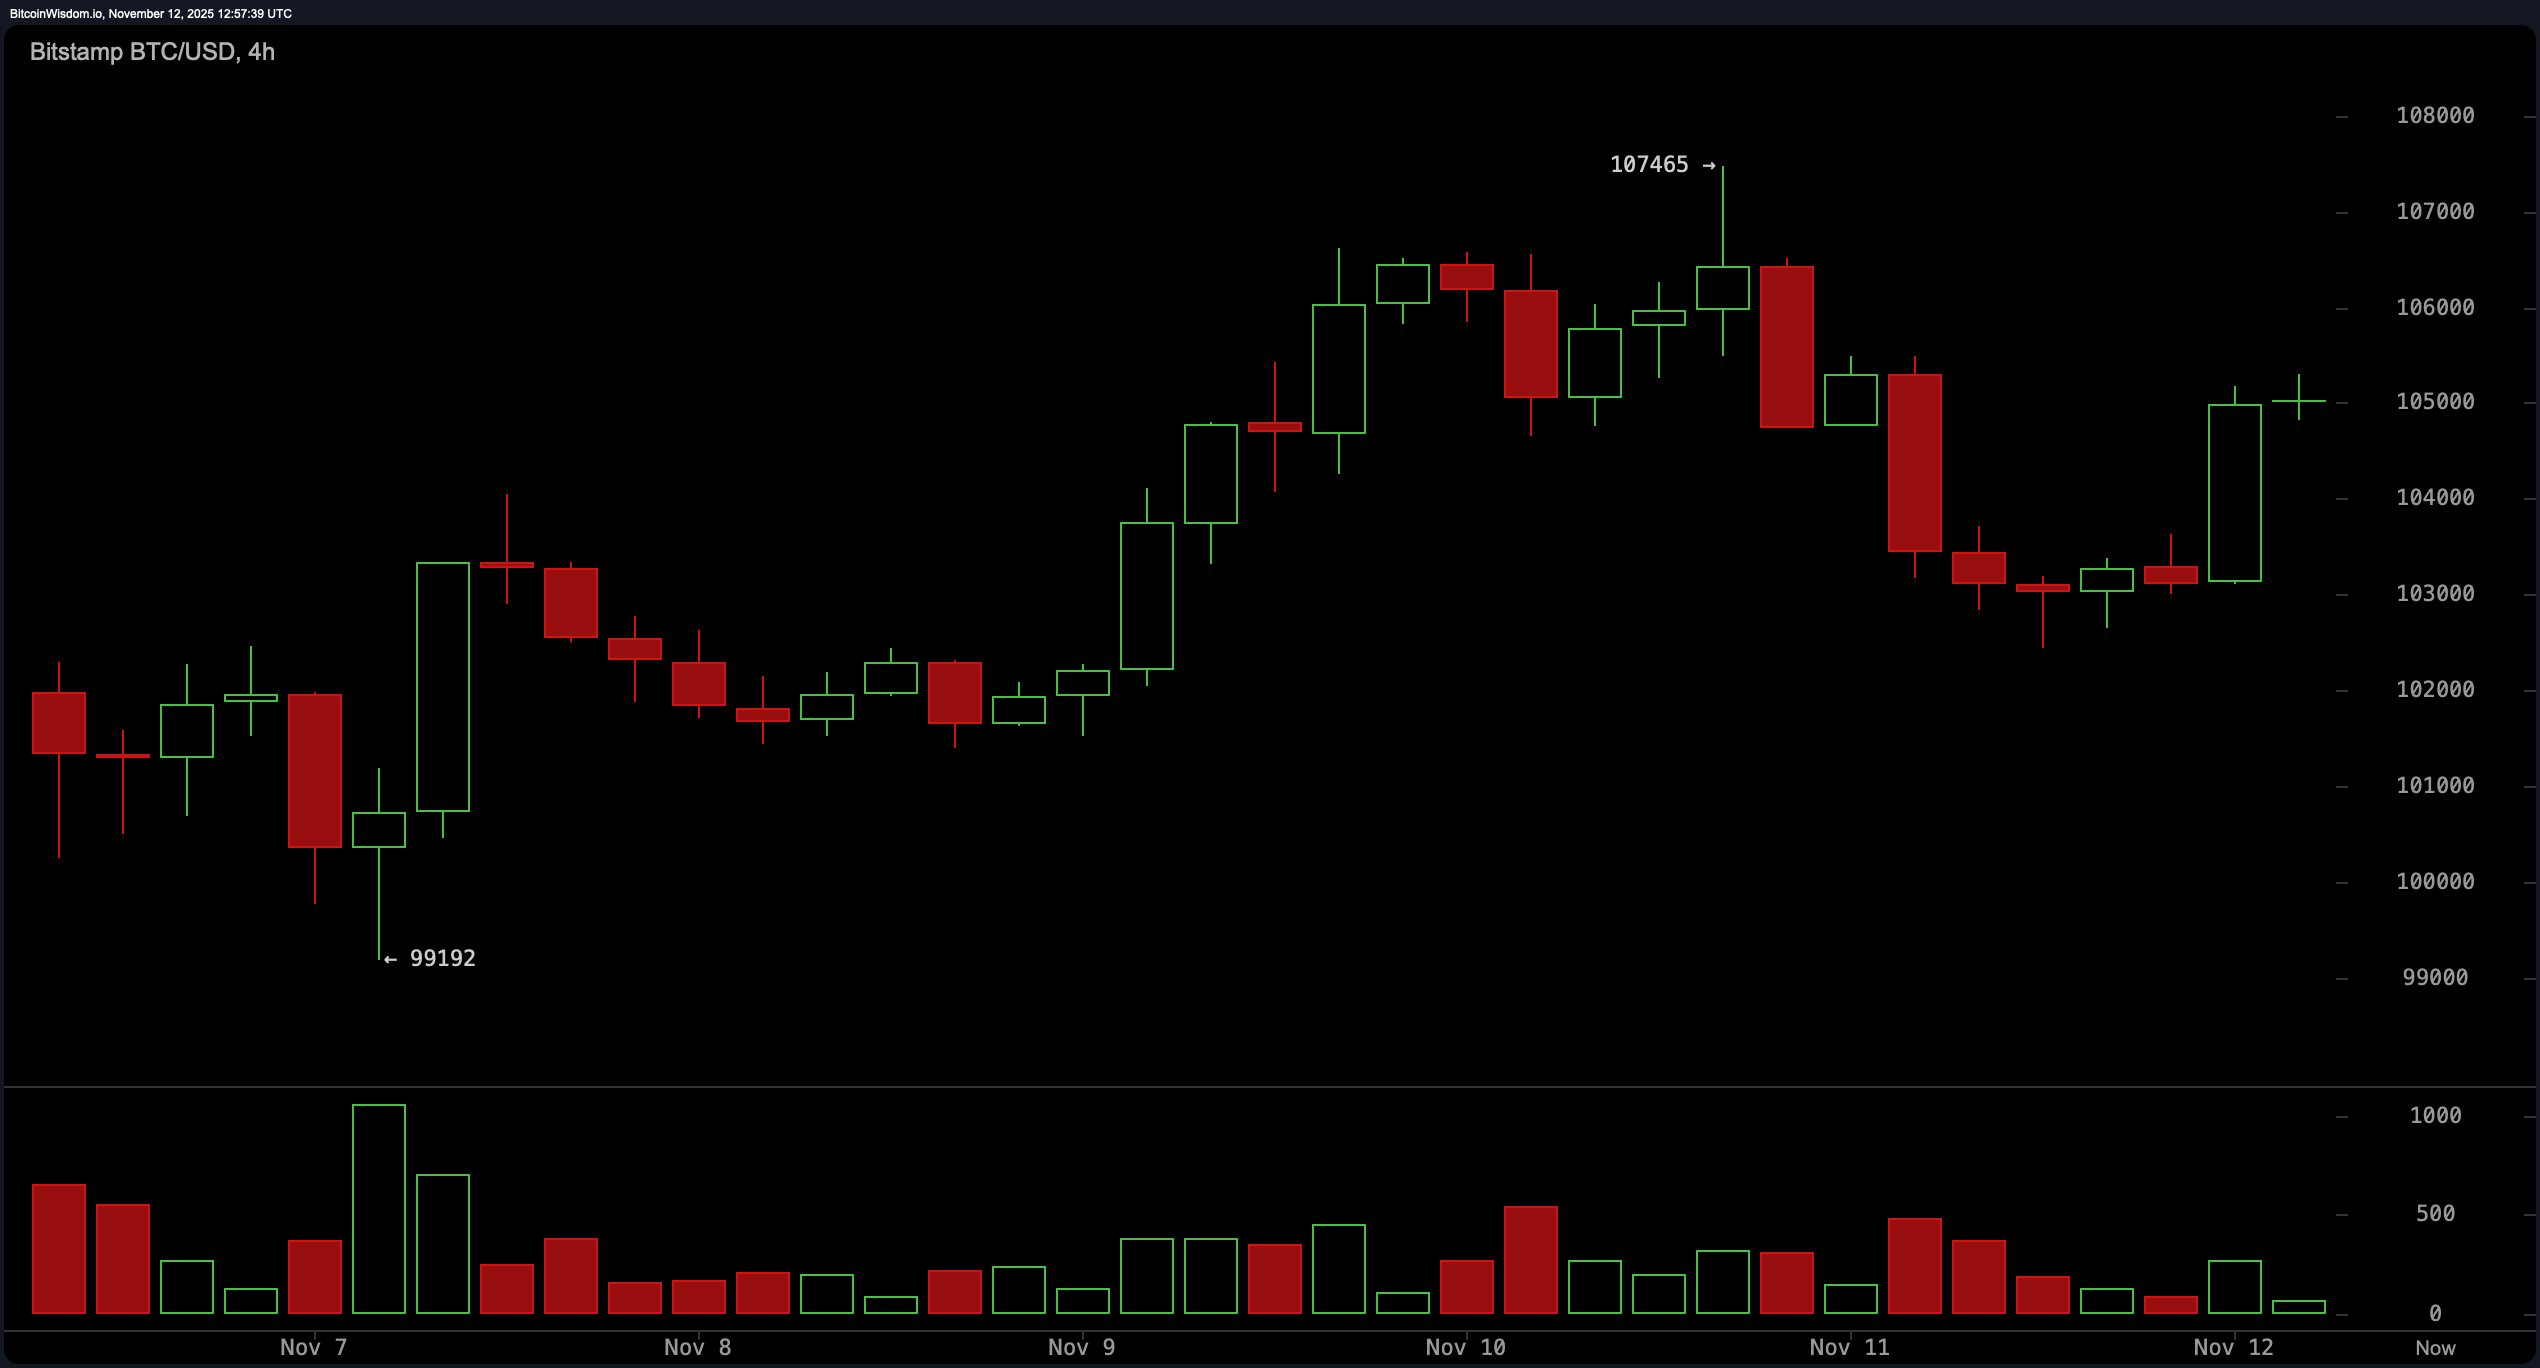
Zooming in on the 4-hour chart, the mood turns more constructive. Bitcoin has climbed from $99,192 to $107,465 in a steady formation of higher highs and higher lows. Despite a temporary stumble to $103,000, the swift recovery suggests dip-hunting traders are alive and kicking. The support zone at $103,000–$104,000 is holding the line well, but any close below that range would put the short-term uptrend in jeopardy faster than a caffeine crash at midnight.

BTC/USD 4-hour chart via Bitstamp on Nov. 12, 2025.
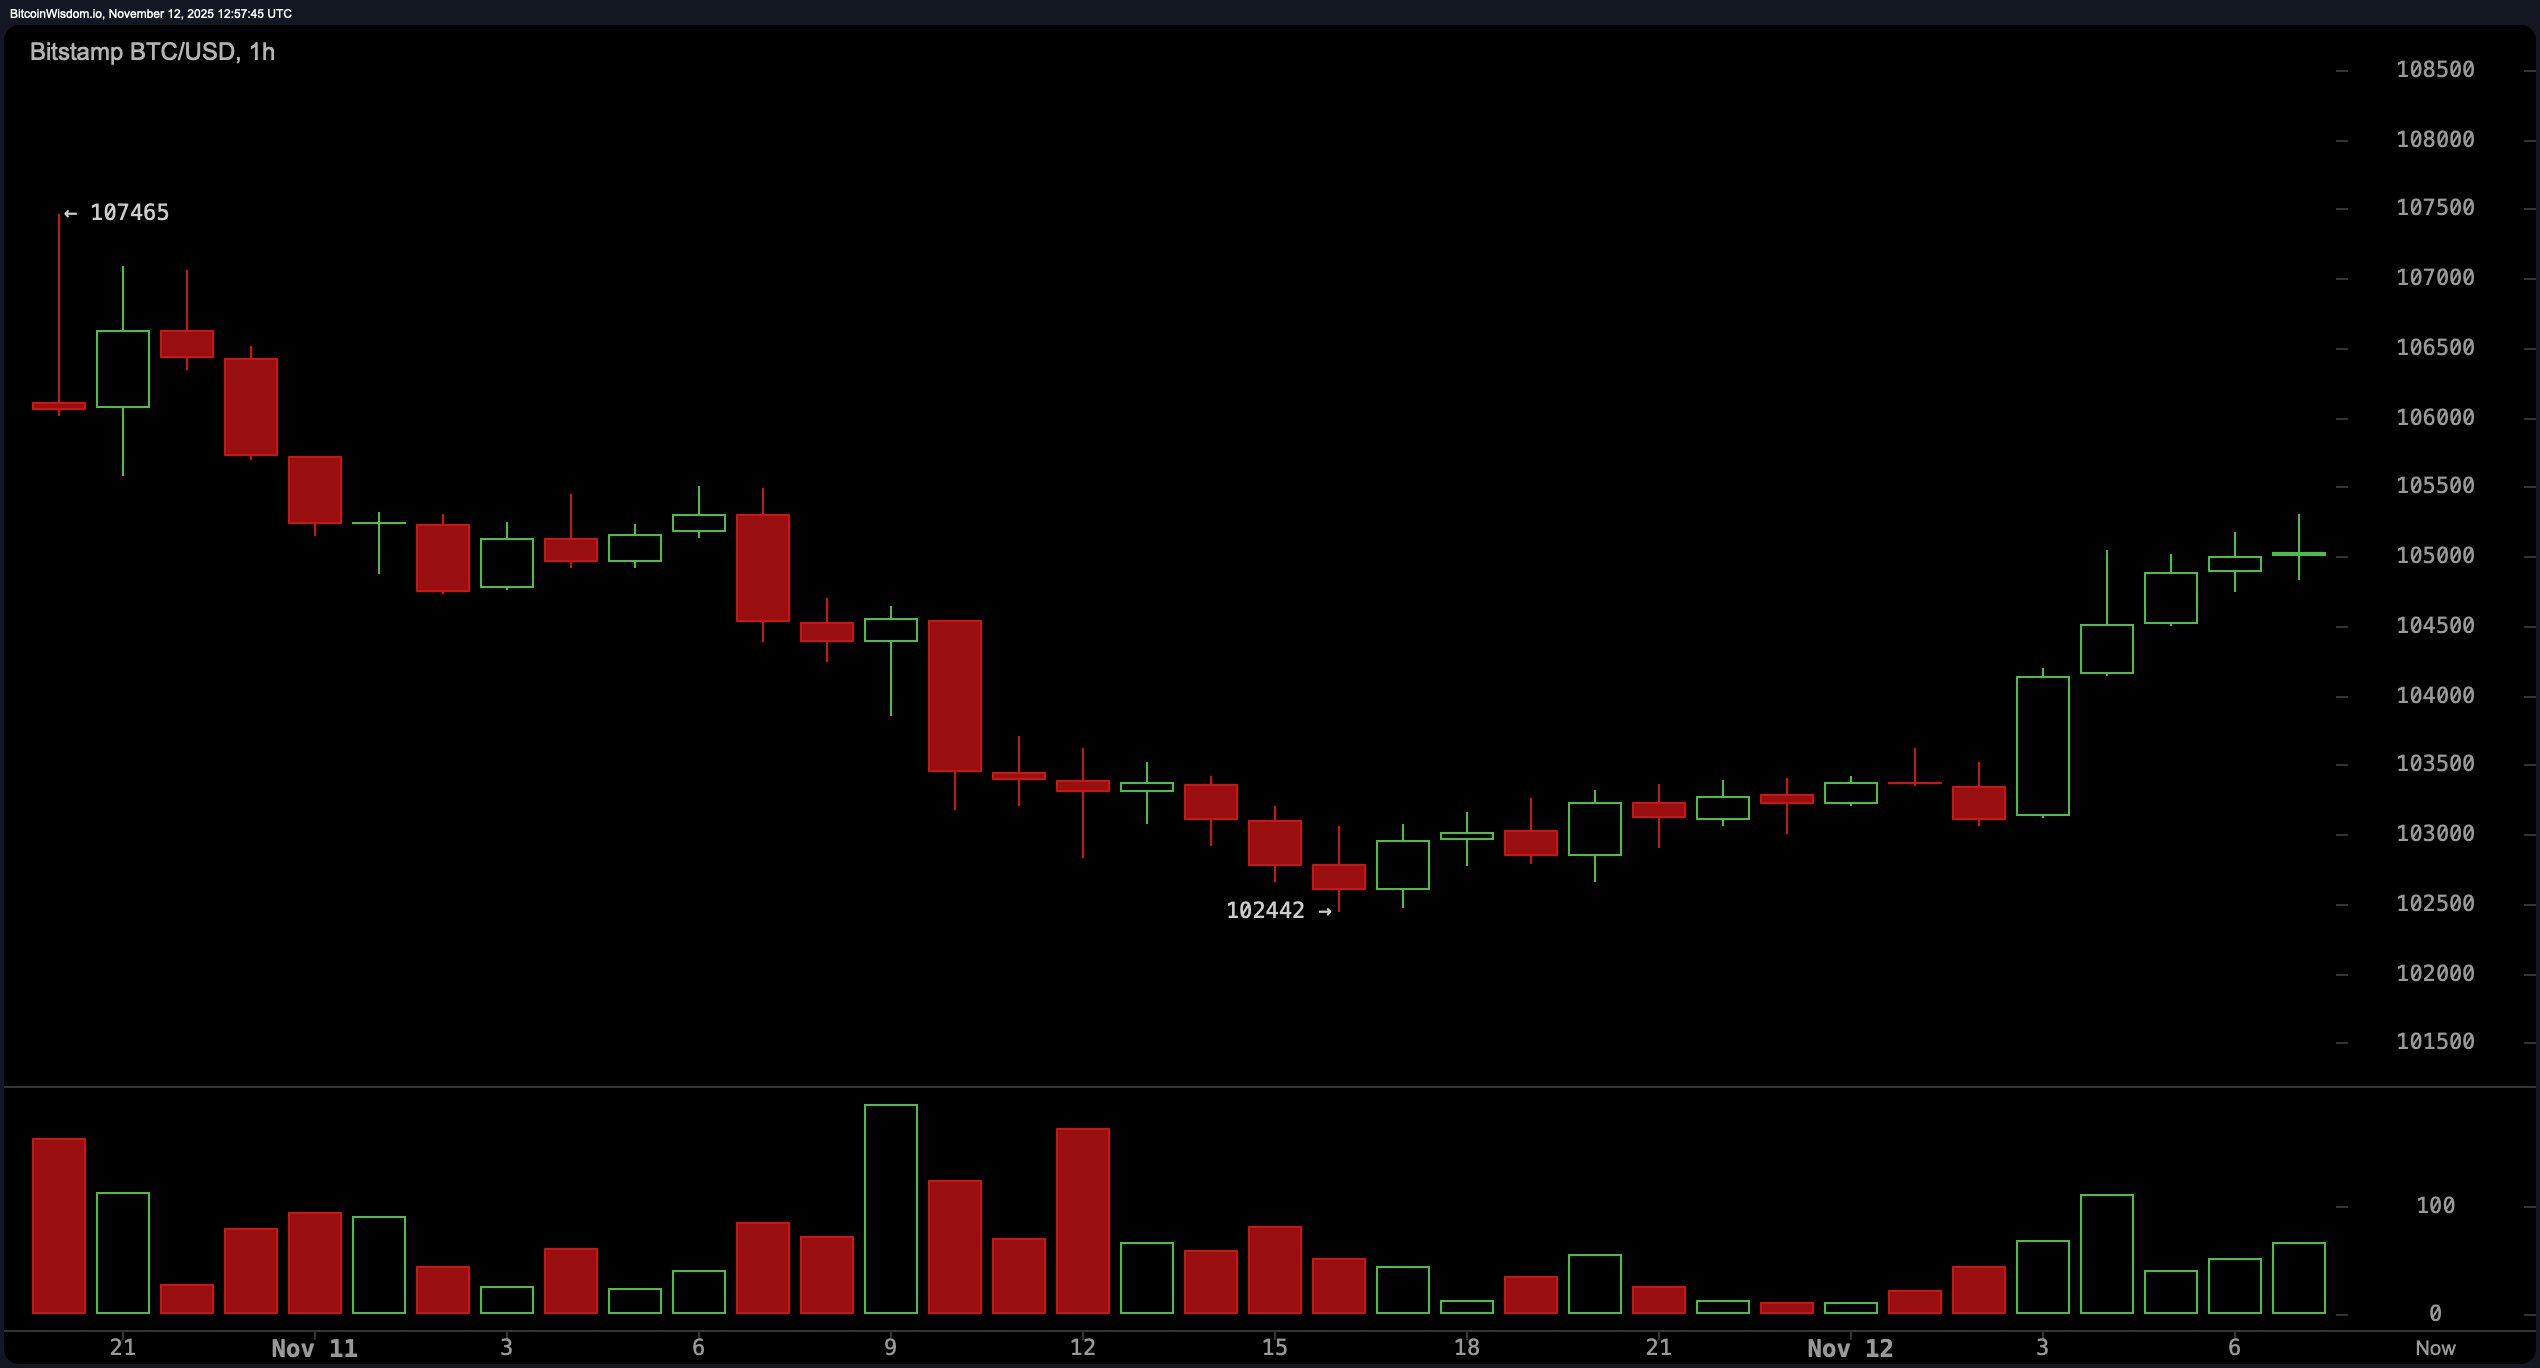
The hourly chart displays the most enthusiasm, reflecting a sharp rebound from $102,442 to a local high of $105,500. Green volume spikes support the bullish tone, hinting that lower-timeframe players are pressing their advantage. That said, the $105,500 resistance is acting like an overprotective bouncer at a velvet-rope club. Unless there’s a surge in volume to force the doors open, a pullback wouldn’t surprise anyone paying attention.

BTC/USD 1-hour chart via Bitstamp on Nov. 12, 2025.
Oscillator indicators are collectively playing the middle ground. The relative strength index (RSI) at 45, stochastic at 39, commodity channel index (CCI) at -56, average directional index (ADX) at 26, and awesome oscillator at -4,800 all flash neutrality. Momentum alone offers an optimistic reading with a value of -5,506—indicating some directional bias—but the moving average convergence divergence (MACD) at -2,271 leans toward further weakness, underscoring indecision in the current setup.
The moving averages ensemble is singing a familiar song: short-term strength, longer-term skepticism. Both the 10-period exponential moving average (EMA) and simple moving average (SMA) hover near $104,000 and suggest support. However, from the 20-period through the 200-period, both exponential and simple moving averages lean downward, waving red flags above $106,000. Unless bitcoin stages a confident close above $110,000 with volume to match, the current trend remains vulnerable to turbulence.
Bull Verdict:
If bitcoin continues to defend the $103,000–$104,000 support zone and manages to break above $105,500 with conviction, there’s potential for a rally toward the $110,000 resistance. Sustained volume on upward moves and confirmation of the double bottom on the daily chart would set the stage for a shift in momentum, turning short-term optimism into a broader recovery attempt.
Bear Verdict:
Failure to hold above $103,000—especially with the weight of the long-term moving averages pressing downward—could open the door to a retest of $99,000 or lower. With momentum indicators still conflicted and volume fading on rebounds, the current bounce risks being nothing more than a dead-cat scamper unless bulls show stronger follow-through.
- What is bitcoin’s price today?
Bitcoin is trading between $104,779 to $105,153 as of Nov. 12, 2025 at 8:50 a.m. EST. - What is the key resistance level for bitcoin now?
The major resistance is near $110,000, a level bulls must clear to shift the trend. - Where is bitcoin’s strongest support?
The $103,000–$104,000 zone is acting as critical short-term support. - Is bitcoin showing bullish or bearish signs?
Short-term charts suggest bullish momentum, but broader trends remain bearish.
免责声明:本文章仅代表作者个人观点,不代表本平台的立场和观点。本文章仅供信息分享,不构成对任何人的任何投资建议。用户与作者之间的任何争议,与本平台无关。如网页中刊载的文章或图片涉及侵权,请提供相关的权利证明和身份证明发送邮件到support@aicoin.com,本平台相关工作人员将会进行核查。


