Author: 0xWeilan
After the interest rate cut in September, some funds "sold the fact" and exited the market, leading to a re-aggregation of on-chain and off-chain funds that propelled BTC to "start" a new round of increases, reaching a historical high of $126,296.00 on October 6 (Coinbase quote, same below). However, this enthusiasm was interrupted on October 10 by the renewed escalation of the "US-China tariff war." BTC subsequently plummeted, dropping to a low of $103,516.75 within several trading days, a decline of over 18%.
Afterwards, with the consensus reached between the US and China during the APEC meeting to pause several confrontational measures, and the Federal Reserve also conducting its second interest rate cut of the year on October 29, coupled with better-than-expected Q3 earnings reports, US stocks hit a new monthly high. However, BTC struggled to rebound, remaining trapped around the 200-day moving average (the upper edge of the "Trump floor" at $110,000), and by the end of the month, it had given back all gains since July.
This month's BTC and cryptocurrency market trends are constrained by a combination of factors, including improvements in macro liquidity, the US-China "reciprocal tariff" war, cyclical sell-offs, and the outflow of main funds from the new cycle.
Currently, as the prospects for interest rate cuts face new twists and risk appetite has not fully recovered, cyclical sell-offs (cyclical law) have become the main force driving BTC's trend. Without further economic and employment data support, if risk appetite shifts and funds flow back while long-term selling continues, if BTC effectively breaks below the bull-bear dividing line, a "long squeeze" could occur, significantly increasing the probability of the end of the BTC cycle.
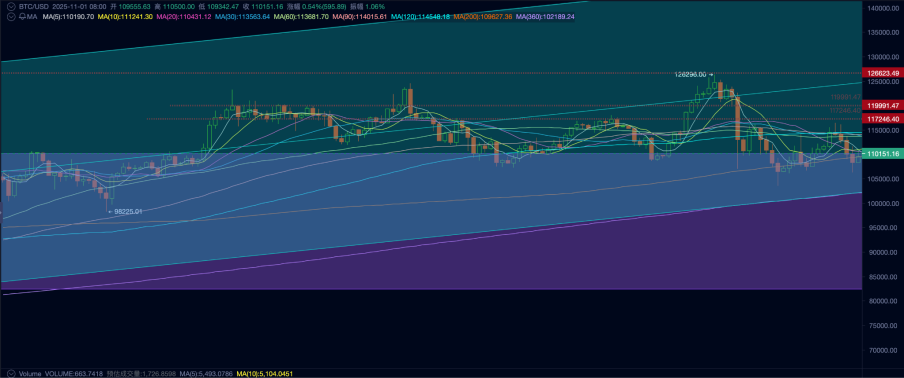
BTC Price Daily Chart
US-China "Reciprocal Tariff" War: A Temporary Respite, but Confrontation Will Persist Long-term
After the interest rate cut "sell the fact," BTC began a new trend in early October.
On October 10, the US announced an "additional 100%" increase in tariffs on certain imports from China and simultaneously threatened to impose export controls on "key software"; global risk assets weakened, and the cryptocurrency market quickly plummeted.
On the 24th and 25th, delegations from both sides held talks in Malaysia. On the 30th, the leaders of the US and China met face-to-face in South Korea, the APEC venue. Achievements included the US reducing the average tariff on China from about 57% to about 47%, China suspending a new round of rare earth restrictions for a year, resuming agricultural product purchases, and advancing fentanyl law enforcement cooperation; however, deep-seated issues such as structural competition and confrontation between the two sides remain unresolved. US stocks rebounded, but BTC and the cryptocurrency market suffered severe internal structural damage due to the rapid decline and continued to consolidate at low levels.
The escalation of tariffs increases inflation and growth uncertainty, with the market short-term leaning towards a "strong dollar + resilient real interest rates" combination, compressing risk appetite for high-beta assets (such as cryptocurrencies). This is the transmission path of the US-China "reciprocal tariff" war's impact on the cryptocurrency market.
Since the low of 96.214 on September 18, the US dollar index has continued to rebound, rising to 99.720 by the end of the month, and has not retreated due to the temporary easing of the "reciprocal tariff war." The suppression of risk assets caused by the dollar index has led to capital outflows from high-beta assets, while gold continues to rise.
Due to AI narratives and strong profit growth, the upward momentum of US stocks, especially technology stocks, has not been harmed. However, the BTC and cryptocurrency market, which lacks fundamental support and relies solely on emotional impulses and capital inflows driven by consensus diffusion, has faced a continuous outflow of funds, resulting in BTC recording a monthly decline of 3.83%, significantly lagging behind the Nasdaq's monthly increase of 4.7%.
Although the leaders of both sides reached a public consensus, the certainty of a ceasefire in the short term (within one year) is relatively high, but caution is still needed regarding tail events such as "secondary tariffs/secondary embargoes."
Federal Reserve Interest Rate Cuts: Probability of Continued Cuts Significantly Reduced
On August 23, Federal Reserve Chairman Powell clearly signaled a dovish turn at the Jackson Hole Global Central Bank Annual Meeting. The Federal Reserve successfully completed two 50 basis point interest rate cuts in September and October, temporarily alleviating anxiety in the US labor market and financial market liquidity pressures.
However, the interest rate meeting on October 29 showed clear signs of discord—two voting members opposed the rate cut decision. In a subsequent speech, Powell emphasized that a rate cut in December is far from a foregone conclusion; the Federal Reserve will take a "balanced approach" between rising risks to employment and sticky inflation. Subsequently, on the 30th, several Federal Reserve officials issued hawkish tones. FedWatch indicated that the probability of a rate cut in December dropped by more than 30% within two days.
Due to a sufficient correction, BTC prices did not continue to decline in the last two days of the month, but BTC Spot ETF recorded capital outflows over the two days, indicating that the market is still pricing down the probability of rate cuts.
If economic and employment data support is not obtained, the probability of a rate cut in December will continue to decline, and the overall market risk appetite will continue to deteriorate in the medium term. Without other favorable factors to support it, BTC is likely to struggle to find real support near the 200-day line. If it falls again into the "Trump floor" range (90,000-110,000), the market under the pressure of "cyclical law" may experience a tragic "long squeeze."
Currently, the US government remains in a shutdown state, making it difficult for official economic and employment data to be released in a timely manner. Short-term traders are in a data vacuum and may be more inclined to sell cryptocurrencies lacking intrinsic growth support.
Internal Structure: Long-term Holders Continue to Sell
In the EMC Labs "BTC Cycle Multi-Factor Assessment Model," the behavior of long-term holders plays a decisive role in the formation of cycles. This group sells chips during cyclical uptrends and collects chips during cyclical downtrends, acting as both a "stabilizer" and a "top creator" in the market.
According to eMerge Engine data, long-term holder sell-offs in October reached 84,806 BTC, the highest monthly total of the year, with total sell-offs by both long and short-term holders reaching 735,930 BTC, also the highest of the year.
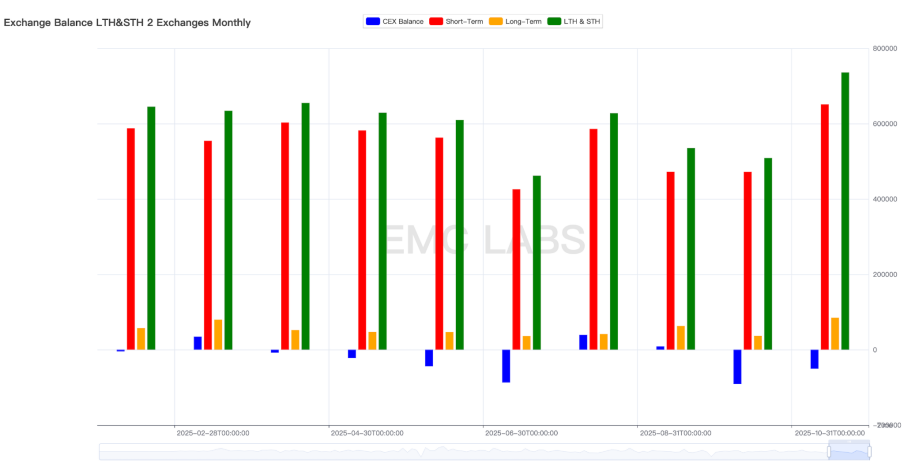
Long-term and short-term holder sell-offs and exchange stock flow statistics (monthly)
This includes sell-offs during the rise when BTC reached its historical high, as well as cost-agnostic sell-offs during the decline. This behavior of continuous significant sell-offs regardless of price movements aligns with the characteristics of long-term holders when prices peak in past cycles.
According to cyclical law, BTC prices typically peak about 1050-1070 days after a cycle low. From November 21, 2022, to October 6 (the day BTC set its all-time high), exactly 1050 days have passed. This should be the fundamental reason for the continued aggressive sell-offs by long-term holders.
In the future, if prices rebound, long-term holders are likely to continue selling; if prices fail to rebound or even decline, and long-term holders continue to sell, it is highly probable that BTC will complete the formation of the cycle's peak.
Capital Flow: Buying Power Continues to Dwindle
The maintenance of any upward trend requires continuous capital inflows for support. Moreover, for most of the time, price increases are the second derivative of capital inflows, meaning that not only must capital flow in, but it must also accelerate to drive price increases.
Over the past four months, the trend has been continuously deteriorating. Since March to June, as the US-China tariff war conflict eased, capital accelerated into the market, pushing BTC to set a monthly historical high. However, since July to October, capital inflows across all channels have continued to slow, with inflows shrinking to $9 billion in October. The ongoing slowdown in capital inflows has struggled to offset the selling pressure from long-term holders, leading to failed price advances and ultimately returning to the upper edge of the "Trump floor."
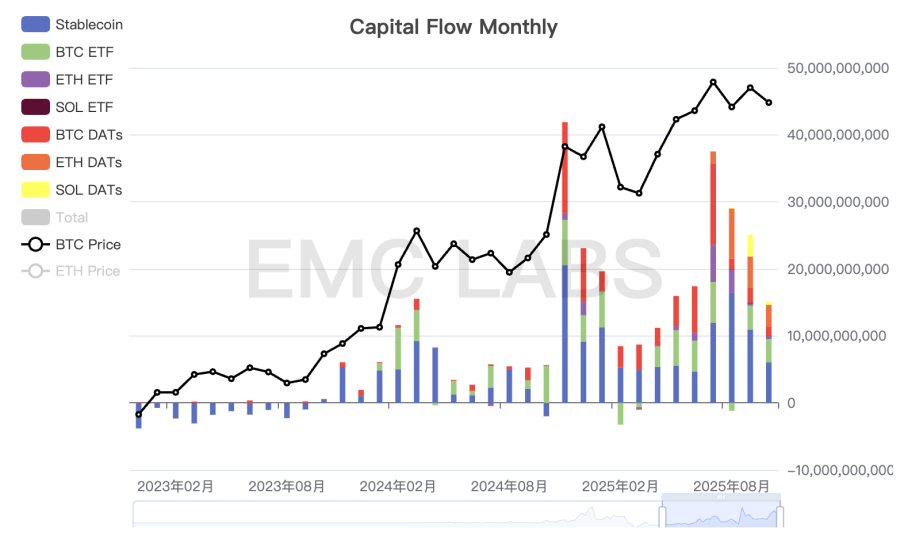
Monthly Capital Inflows in the Cryptocurrency Market
In the "September Report," we analyzed and concluded that the pulse-like capital inflows driven by "macro liquidity" and "consensus diffusion" are the main driving forces behind the upward movement of BTC prices in this bull market. This is clearly reflected in the on-chain price realization statistics.
The first round of large-scale capital inflows came from the approval of BTC ETFs, and the second round came from the election of "crypto-friendly president" Trump. From March to July 2025, the third round of large-scale capital inflows formed, driven by the easing of the US-China trade war conflict and expectations of Federal Reserve interest rate cuts, but this inflow abruptly stopped after pushing BTC prices to $120,000.
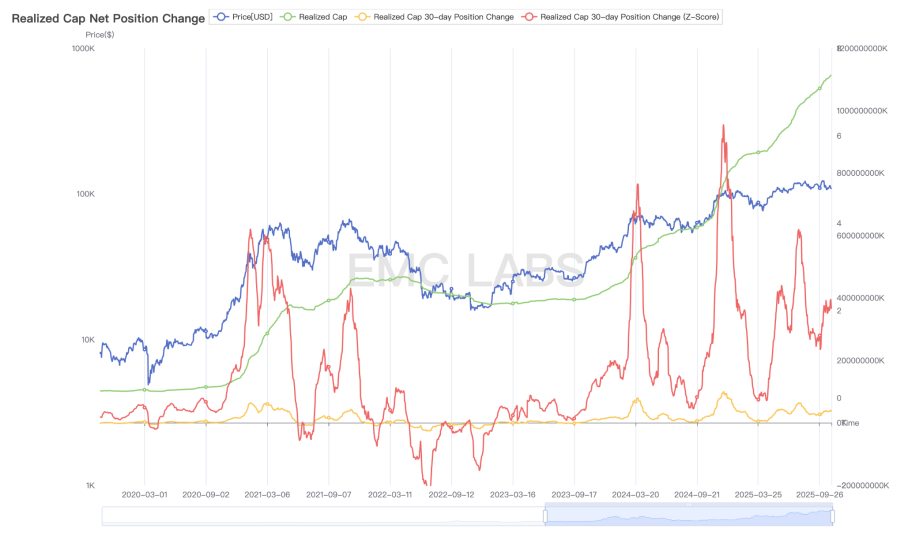
BTC On-Chain Value Realization Statistics
After the resumption of interest rate cuts, capital attempted to flow in again at the end of September, pushing prices up to $126,296, but in October, due to the US-China conflict, the enthusiasm for capital inflows was curtailed, compounded by a series of liquidations triggered by Binance exchange market makers due to USDe issues, ultimately leading to a market-wide clearance of nominal leverage exceeding $20 billion, severely damaging the internal structure of the cryptocurrency market.
After the structural changes in this cycle, the bullish forces in this bull market are concentrated in three channels: DATs, BTC Spot ETF, and shark accounts. Currently, DATs are lacking buying power, BTC Spot ETF is in a state of outflow, and only shark accounts are continuing to buy.
In the future, if macro liquidity improves or additional policy benefits stimulate a return of bullish sentiment, and buying power re-aggregates, BTC still has the opportunity to regain upward momentum and set new highs. If sentiment remains low and capital accelerates outflow, BTC is likely to end this bull market in the fourth quarter.
Conclusion
Due to the lack of intrinsic growth, the current cryptocurrency market is still in a game of capital inflows driven by "macro liquidity + consensus diffusion" and the cyclical "collect-sell" behavior of long-term investors.
Currently, "macro liquidity + consensus diffusion" is still ongoing but with significantly weakened momentum, while the long-term holder group, believing in the "cyclical law," continues to adhere to principles and sell. This game is pushing BTC prices downward for rebalancing. In the old cycle pattern, this is a typical manifestation of the transition from a conversion period to a downward phase (bear market).
The "new cycle" pattern has yet to be clarified, and we can only believe that the end of the bull market is underway.
免责声明:本文章仅代表作者个人观点,不代表本平台的立场和观点。本文章仅供信息分享,不构成对任何人的任何投资建议。用户与作者之间的任何争议,与本平台无关。如网页中刊载的文章或图片涉及侵权,请提供相关的权利证明和身份证明发送邮件到support@aicoin.com,本平台相关工作人员将会进行核查。


